National California Economies John Husing Ph D Economics


- Slides: 55
National & California Economies John Husing, Ph. D. Economics & Politics, Inc. Chief Economist, IEEP
After Losing 8. 71 Million Jobs … Now At A Record Level of Jobs U. S. Jobs Long Slow Growth - Not Over-Heating
Gross Domestic Product Very Slow Growth
Current Consumer Confidence Very High! 128. 5
Oil Prices: Low But Roughly Stable $45. 00
Consumer Quite Aggressive
Residential Construction Spending Gaining Speed
Value of the Dollar: Helps Imports & Hurts Exports 100. 0 2012 -2016 22. 1%
Looking Six Month Ahead Consumer Confidence Lagging 87. 8
Business Investment Spending Weak
Orders, Non-Defense Capital Goods Slowly Declining
Mfg. Purchasing Manager’s Index Weakening!
Industrial Capacity Utilization: Slack Full Capacity 82. 5% 75. 5%
U. S. Unemployment History Prime Rate: 21% Cold War Ends Great Recession
Consumer Price Stable: Below 2. 0% Fed Target 1. 1%
Interest Rate Environment 3. 46% 1. 62%
Required FICO Scores – 30 Year Fixed Fannie Mae Share of Income: 36% or less … 680 if LTV 75% … 620 if Less Share of Income: 45% or less … 700 if LTV 75% … 640 if Less Issue: Maximum Allowable Confirming Loan Levels FICO Report 2005 2006 2007 2008 2009 2010 2011 2012 2013 2014 2015 300 -499 6. 6% 6. 5% 7. 1% 7. 2% 7. 4% 6. 9% 6. 2% 6. 0% 5. 8% 5. 2% 5. 0% 500 -549 8. 0% 8. 2% 8. 7% 9. 0% 8. 7% 8. 5% 8. 4% 7. 9% 7. 4% 550 -599 9. 0% 8. 8% 8. 7% 9. 1% 9. 6% 9. 8% 9. 9% 9. 8% 9. 5% 9. 2% 600 -649 10. 2% 9. 7% 9. 6% 9. 5% 10. 0% 10. 1% 10. 2% 10. 3% 650 -699 12. 8% 12. 5% 12. 1% 12. 0% 11. 9% 12. 1% 12. 2% 12. 7% 700 -749 16. 4% 16. 3% 16. 2% 16. 0% 15. 9% 15. 7% 15. 5% 16. 2% 750 -799 20. 1% 19. 8% 19. 6% 19. 4% 19. 5% 19. 4% 800 -850 16. 9% 17. 9% 18. 4% 18. 7% 18. 2% 17. 9% Total 100. 0% 68. 1% 12. 8% 13. 0% 16. 3% 16. 6% 16. 8% 18. 4% 55. 1% 18. 3% 18. 4% 18. 6% 19. 6% 20. 0% 100. 0%
U. S. Home Sales Remain Relatively Weak
U. S. Median Home Prices Soaring!
California Job Gains/Losses 2007 15, 844, 325 2016 16, 918, 587 Up 1, 074, 272 6. 8% Up Recovery 2, 253, 330 Great Recession -1, 179, 058
U. S. & CA Unemployment History Prime Rate: 21% Cold War Ends Great Recession
CA’s East-West Split in Prosperity San Francisco-Oakland-Fremont 4. 10% Bay Area San Jose-Sunnyvale-Santa Clara 4. 10% Bay Area Napa 4. 10% Bay Area Orange County 4. 40% So. Coast San Luis Obispo-Paso Robles 4. 60% No. Coast Santa Barbara-Santa Maria-Goleta 4. 80% So. Coast San Diego-Carlsbad-San Marcos 5. 00% So. Coast Los Angeles County 5. 30% So. Coast Sacramento-Arden-Arcade-Roseville 5. 50% No. Inland Salinas-Monterey 5. 70% No. Coast Vallejo-Fairfield 5. 70% Bay Area Oxnard-Thousand Oaks-Ventura 5. 80% So. Coast Santa Cruz-Watsonville 5. 80% No. Coast Riverside-San Bernardino-Ontario 6. 60% So. Inland Chico 6. 70% No. Inland Redding 6. 80% No. Inland Stockton 7. 80% Central Modesto 8. 00% Central Yuba City 8. 10% No. Inland Madera-Chowchilla 8. 30% Central Fresno 8. 70% Central Hanford-Corcoran 8. 90% Central Merced 9. 30% Central Bakersfield-Delano 9. 70% Central Visalia-Porterville 10. 70% North El Centro 23. 80% So. Inland
Job Quality & Income Split 2011 -2016 e Growth Period
Gold Mine Theory Secondary Tier Primary Tier
Science, Technology, Math, Engineering
STEM - Strong Job Growth! 15. 3%
Office Vacancy/SF Absorption Bay Area – Rest of CA Split! Sacramento Inland Empire Central Valley L. A. Co. San Diego Orange Co. Contra Costa SF Peninsula Silicon Valley Alameda Co. San Francisco 2016 Q 2 15. 8% 14. 1% 14. 0% 13. 8% 12. 5% 10. 0% 8. 7% 8. 0% 7. 9% 7. 2% 6. 3% 421, 000 64, 000 24, 000 1, 200, 000 -119, 000 -464, 000 515, 000 -149, 000 360, 000 16, 000 348, 000
Health Care
Physician Availability, CA Regions, 2013
Share of Adults, 18 -64, No Health Insurance By California Region, 2012 vs. 2015
Health Care - Strong Job Growth! 9. 4%
Construction: Slowly Coming Back
Housing Permits, Single Family Residential Seasonally Adjusted Annual Rate
Change In Sales Demand vs. Supply of Active Listings August 2015 -2016 Sales: Demand Active Listings: Supply 8% 6% 7% -2% -4% -9% Bay Area Southern California Central Valley
Months of Housing Supply Available By California Region Bay Area So. CA Central Valley 8. 0 7. 0 6. 0 5. 0 4. 0 3. 6 3. 0 3. 2 2. 0 1. 0 0. 0 2. 4
CA: State Prices Almost All The Way Back Median Price Existing Detached Homes, 2005 -2016 $594, 530 $526, 580 5. 8% -11. 4% $245, 230 -59% $497, 520
High Priced Bay Area & Central Coast Bay Area U. S. = $307, 454 Affordability Median Price Payment Required Income San Francisco 13% $1, 375, 000 $6, 740 $269, 601 San Mateo 14% $1, 330, 000 $6, 519 $260, 778 Marin 18% $1, 225, 000 $6, 005 $240, 190 Santa Clara 19% $1, 085, 000 $5, 318 $212, 740 Alameda 20% $825, 700 $4, 047 $161, 898 Napa 25% $630, 000 $3, 088 $123, 526 Contra-Costa 32% $628, 150 $3, 079 $123, 164 Sonoma 26% $585, 000 $2, 868 $114, 703 Solano 45% $386, 000 $1, 892 $75, 684 Central Coast Affordability Median Price Payment Required Income Santa Cruz 17% $799, 000 $3, 917 $156, 663 Santa Barbara 20% $703, 460 $3, 448 $137, 930 San Luis Obispo 27% $546, 620 $2, 679 $107, 178 Monterey 25% $535, 000 $2, 622 $104, 899
Mix Priced So. California Modestly Priced Central Valley So. California U. S. = $307, 454 Affordability Median Price Payment Required Income Orange County 22% $742, 220 $3, 638 $145, 530 Ventura 29% $647, 320 $3, 173 $126, 922 San Diego 26% $589, 910 $2, 892 $115, 666 Los Angeles 30% $480, 040 $2, 353 $94, 123 Riverside County 41% $355, 320 $1, 742 $69, 669 San Bernardino 56% $242, 370 $1, 188 $47, 522 Central Valley Affordability Median Price Payment Required Income Placer County 46% $438, 490 $2, 149 $85, 976 Sacramento 45% $323, 710 $1, 587 $63, 471 San Joaquin 45% $313, 840 $1, 538 $61, 536 Stanislaus 48% $271, 940 $1, 333 $53, 320 Fresno 50% $235, 020 $1, 152 $46, 081 Kern (Bakersfield) 54% $228, 950 $1, 122 $44, 891 Madera 50% $221, 700 $1, 087 $43, 469 Kings County 56% $212, 660 $1, 042 $41, 697 Merced 52% $212, 080 $1, 040 $41, 583 Tulare 50% $207, 700 $1, 018 $40, 724
Construction - Strong Job Growth! 9. 2%
Logistics Flow of Goods
Port Container Volumes On Pace For Import Record
Fulfillment Centers
E-Commerce Growth Rates Year Over Year by Quarter
Logistics - Strong Job Growth! 8. 7%
Manufacturing: Should Be A Major Growth Source
California Manufacturing Job Growth Just 5. 4% of U. S. Growth
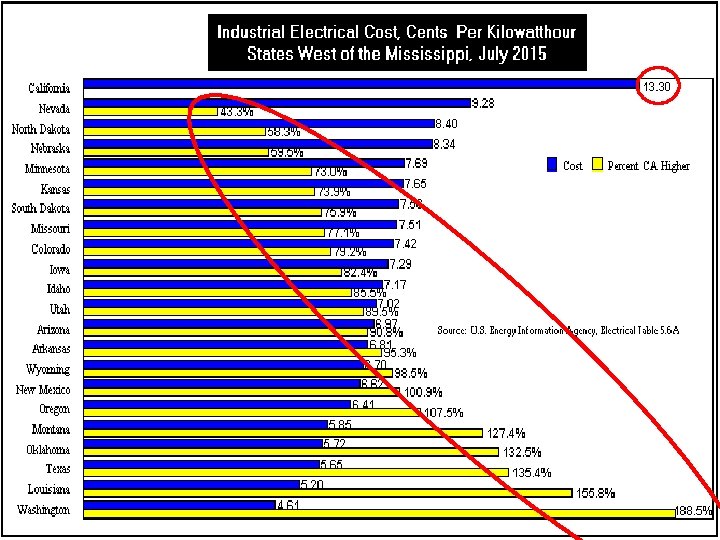
CA Is Not Loved By Executives & Entrepreneurs
Manufacturing Poor Job Growth! 1. 9%
Industrial Vacancy Rate Low Almost Everywhere! Sacramento San Diego Inland Empire Central Valley Orange Co. Silicon Valley SF Peninsula L. A. Co. 2016 Q 4 8. 5% 4. 5% 3. 3% 2. 0% 1. 6% 1. 4% 1. 2% 1. 1%
Industrial Absorption Sq. Feet Largely Related To So. CA Ports Inland Empire Central Valley L. A. Co. Sacramento Silicon Valley Orange Co. San Diego SF Peninsula 2016 Q 4 6. 2 million 2. 3 million 1. 0 million 0. 9 million 0. 8 million 0. 2 million 0. 03 million 0. 001 million
Political Key: 42 -45 Votes of 80 • Moderate Democrats from Poor Districts: Their Party is Hurting Their Constituents (14 -17) • Combined With Republicans Create Legislation Rolling Back Regulators (28) • CEQA • AQMD • CARB
Economic Impact?
www. johnhusing. com