Monitoring Present and Future Pedro Andrade CERN IT

- Slides: 24

Monitoring: Present and Future Pedro Andrade (CERN IT) pedro. andrade@cern. ch 31 st August 2012 Grid. Ka School – Karlsruhe, Germany CERN IT Department CH-1211 Genève 23 Switzerland www. cern. ch/it

Outline • What’s / Why Monitoring ? • Terminology and Architecture • Technologies and Tools • WLCG and CERN Examples • Current Problems & Future Solutions 2

What’s Monitoring ? “Observe and check the progress or quality of something over a period of time. ” Google define “Capability to execute continuous observance and analysis of the operational state of systems and provide decision support regarding situational awareness and deviations from expectations. ” US National Institute of Standards and Technology 3

Why Monitoring ? It’s a core IT function The value of a service to an organization is proportional to the availability of the service It’s powerful Understanding and using monitoring data correctly gives a competitive advantage It’s fun Many people enjoy looking to nice dashboards and graphs of service status and availability 4

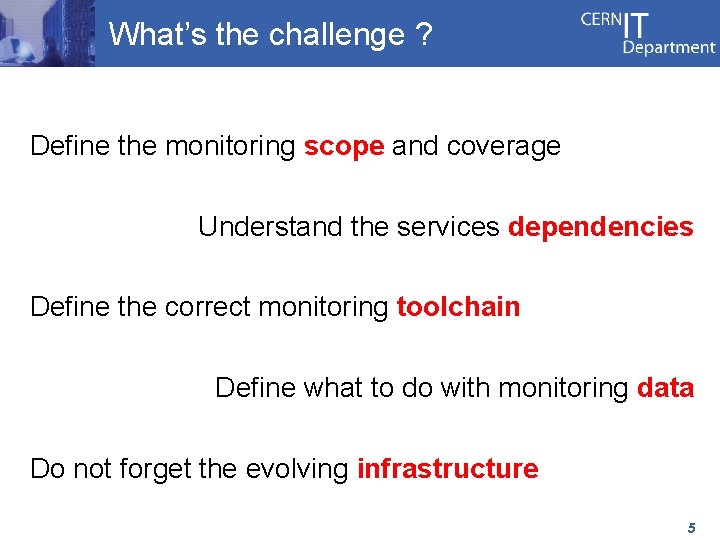
What’s the challenge ? Define the monitoring scope and coverage Understand the services dependencies Define the correct monitoring toolchain Define what to do with monitoring data Do not forget the evolving infrastructure 5

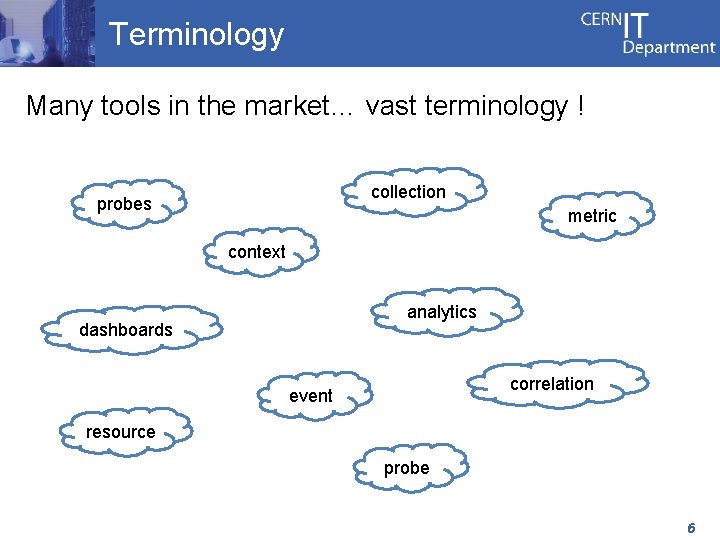
Terminology Many tools in the market… vast terminology ! collection probes metric context analytics dashboards correlation event resource probe 6

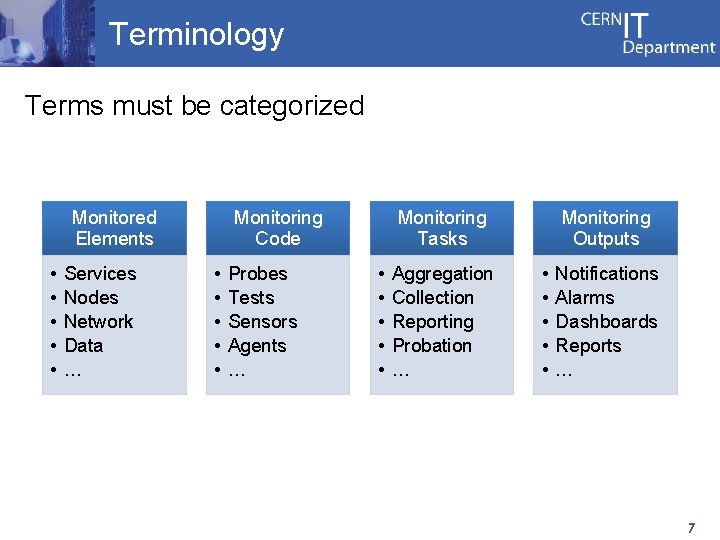
Terminology Terms must be categorized Monitored Elements • • • Services Nodes Network Data … Monitoring Code • • • Probes Tests Sensors Agents … Monitoring Tasks • • • Aggregation Collection Reporting Probation … Monitoring Outputs • • • Notifications Alarms Dashboards Reports … 7

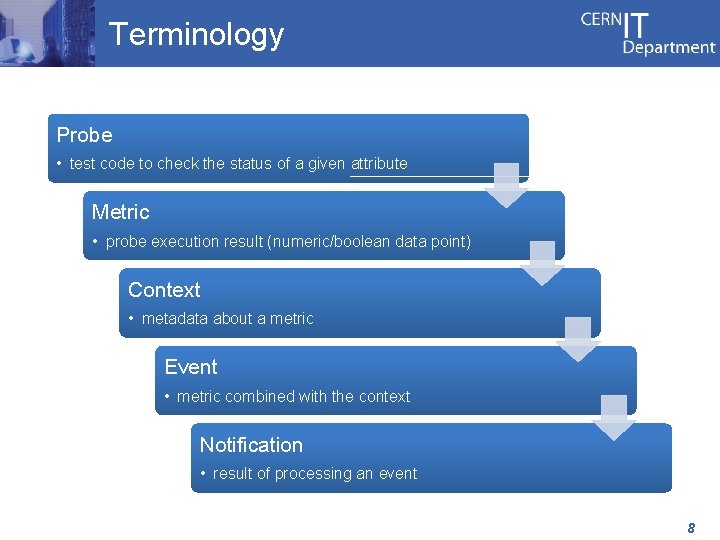
Terminology Probe • test code to check the status of a given attribute Metric • probe execution result (numeric/boolean data point) Context • metadata about a metric Event • metric combined with the context Notification • result of processing an event 8

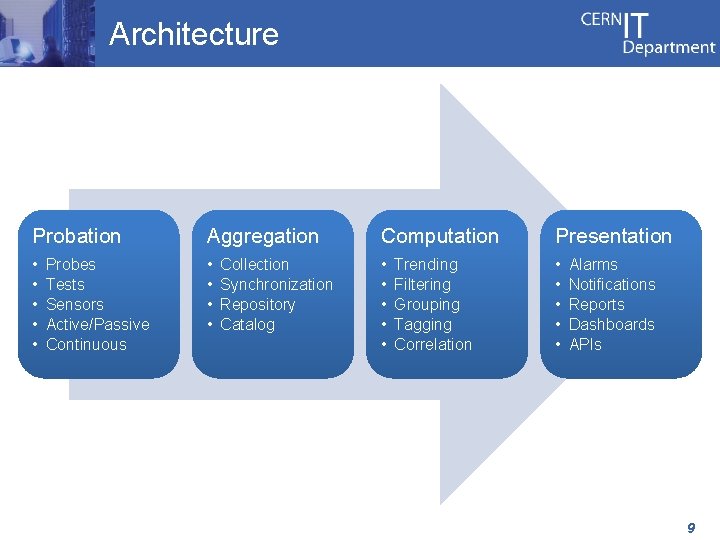
Architecture Probation Aggregation Computation Presentation • • • • • Probes Tests Sensors Active/Passive Continuous Collection Synchronization Repository Catalog Trending Filtering Grouping Tagging Correlation Alarms Notifications Reports Dashboards APIs 9

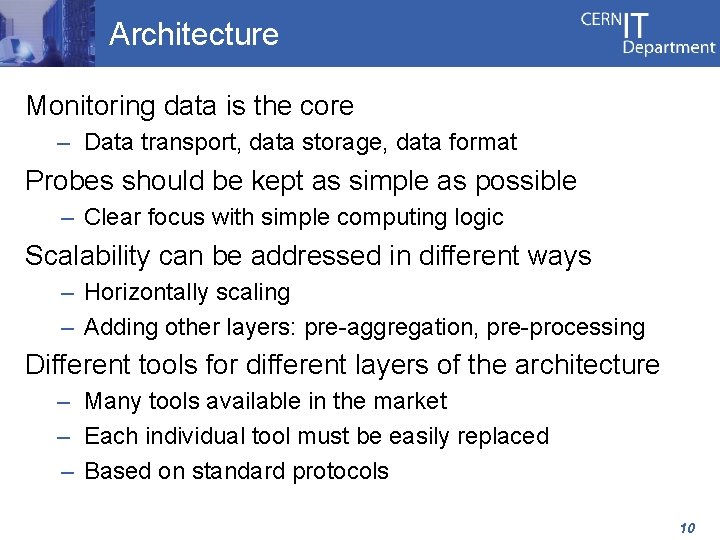
Architecture Monitoring data is the core – Data transport, data storage, data format Probes should be kept as simple as possible – Clear focus with simple computing logic Scalability can be addressed in different ways – Horizontally scaling – Adding other layers: pre-aggregation, pre-processing Different tools for different layers of the architecture – Many tools available in the market – Each individual tool must be easily replaced – Based on standard protocols 10

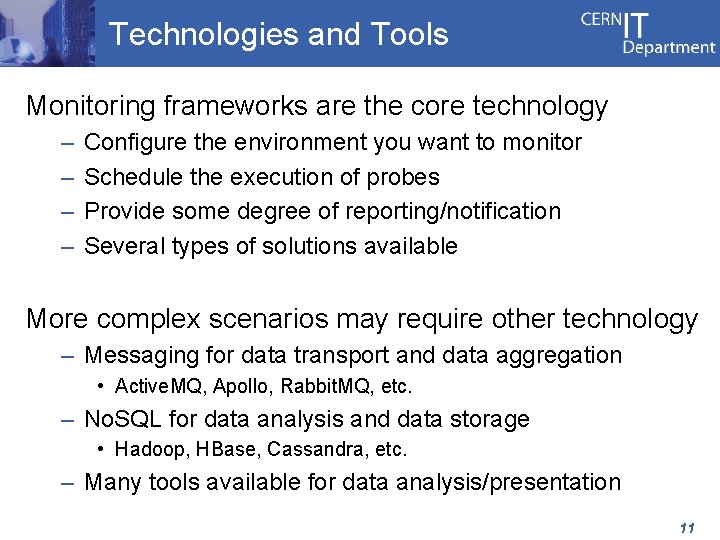
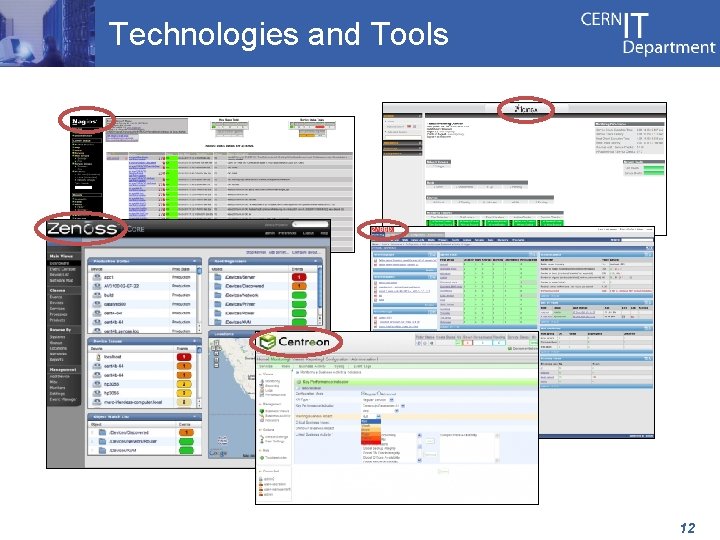
Technologies and Tools Monitoring frameworks are the core technology – – Configure the environment you want to monitor Schedule the execution of probes Provide some degree of reporting/notification Several types of solutions available More complex scenarios may require other technology – Messaging for data transport and data aggregation • Active. MQ, Apollo, Rabbit. MQ, etc. – No. SQL for data analysis and data storage • Hadoop, HBase, Cassandra, etc. – Many tools available for data analysis/presentation 11

Technologies and Tools 12

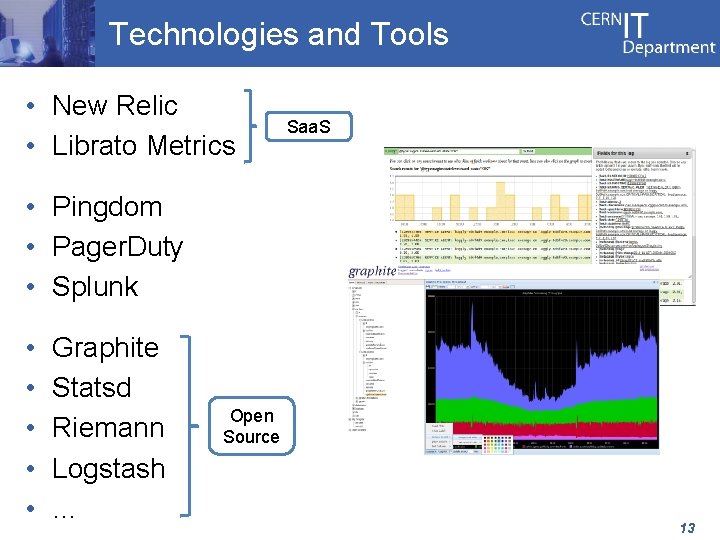
Technologies and Tools • New Relic • Librato Metrics Saa. S • Pingdom • Pager. Duty • Splunk • • • Graphite Statsd Riemann Logstash … Open Source 13

Monitoring @ WLCG The Worldwide LHC Computing Grid (WLCG) is a distributed infrastructure composed by 152 sites and >320, 000 logical CPUs serving the computing needs of WLCG VOs. It brings together resources provided by the EGI and OSG infrastructures. Multi-organization infrastructure, few services. Monitoring is based on the SAM system: – SAM-Nagios testing sites and services (for VOs/NGIs) – SAM-Gridmon aggregating/computing monitoring data – WLCG Dashboards providing dedicated portals to VOs 14

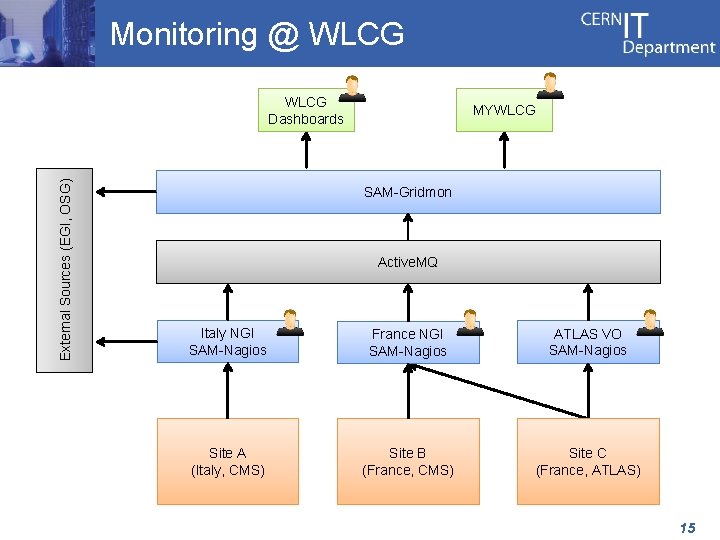
Monitoring @ WLCG External Sources (EGI, OSG) WLCG Dashboards MYWLCG SAM-Gridmon Active. MQ Italy NGI SAM-Nagios France NGI SAM-Nagios ATLAS VO SAM-Nagios Site A (Italy, CMS) Site B (France, CMS) Site C (France, ATLAS) 15

Monitoring @ WLCG Some statistics – – 236 probes for operations and VO checks +4000 service endpoints being tested 41 NGI SAM-Nagios + 4 WLCG VO SAM-Nagios 500 k metrics results processed per day Key features – – – Based on open source systems: Nagios, Active. MQ Distributed responsibility for tests execution: NGIs, VOs Centralized computation of status and availability Supports integration of 3 rd party monitoring systems Provides web REST API to consume monitoring data 16

Monitoring @ CERN Computer Centre houses servers and data storage systems for the WLCG Tier-0, physics analysis, and other CERN services. It currently provides 30 PB storage on disk and 65, 000 cores (plus 20, 000 cores and 5, 5 PB of storage from new Computer Centre in Budapest). Single-organization infrastructure, many services. Monitoring is based on the Lemon system plus many application specific tools. A new monitoring architecture is being defined under the AI project. 17

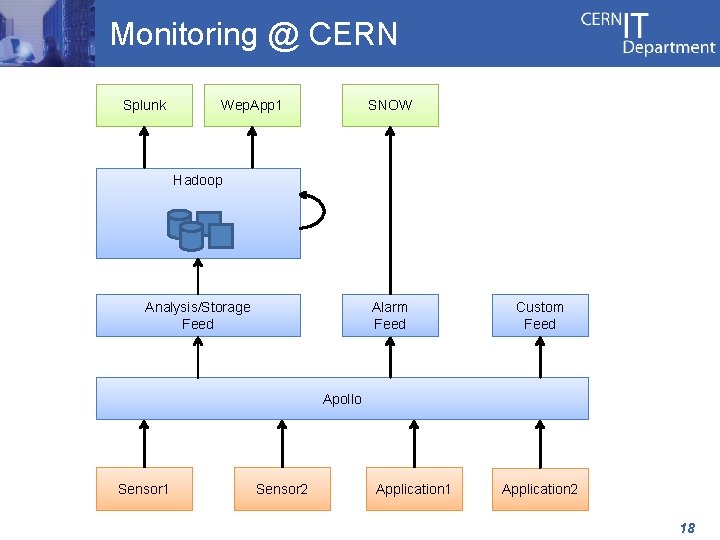
Monitoring @ CERN Splunk Wep. App 1 SNOW Hadoop Analysis/Storage Feed Alarm Feed Custom Feed Apollo Sensor 1 Sensor 2 Application 1 Application 2 18

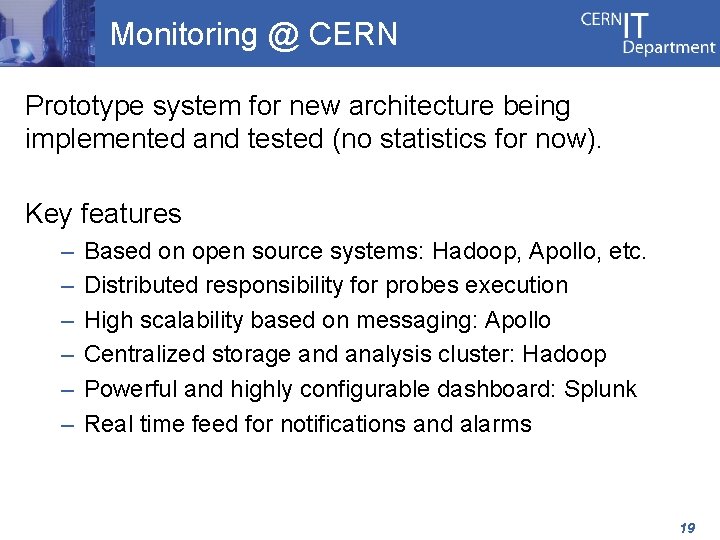
Monitoring @ CERN Prototype system for new architecture being implemented and tested (no statistics for now). Key features – – – Based on open source systems: Hadoop, Apollo, etc. Distributed responsibility for probes execution High scalability based on messaging: Apollo Centralized storage and analysis cluster: Hadoop Powerful and highly configurable dashboard: Splunk Real time feed for notifications and alarms 19

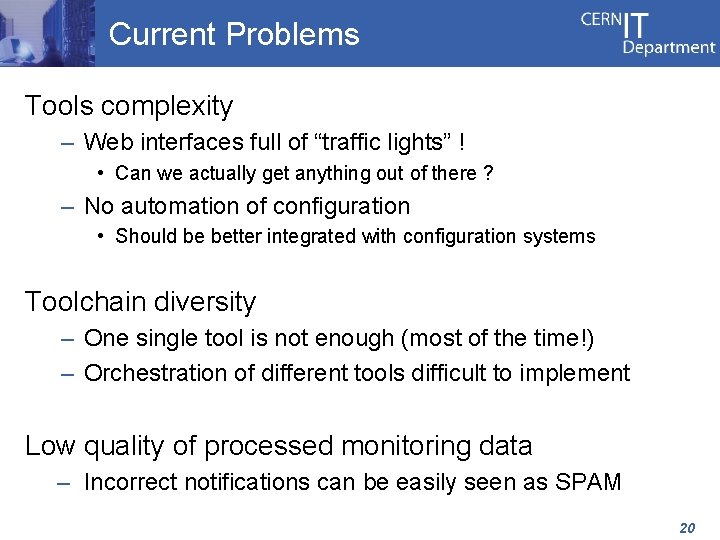
Current Problems Tools complexity – Web interfaces full of “traffic lights” ! • Can we actually get anything out of there ? – No automation of configuration • Should be better integrated with configuration systems Toolchain diversity – One single tool is not enough (most of the time!) – Orchestration of different tools difficult to implement Low quality of processed monitoring data – Incorrect notifications can be easily seen as SPAM 20

Current Problems Monitoring granularity – Most of the times based on hosts – Why can’t we have other 1 st class monitoring elements? Sources of truth – Different tools hold different databases of hosts/services – Is there a master? Are there copies? Cache data? Timing (depends of tool!) – Long intervals between checks, high latency 21

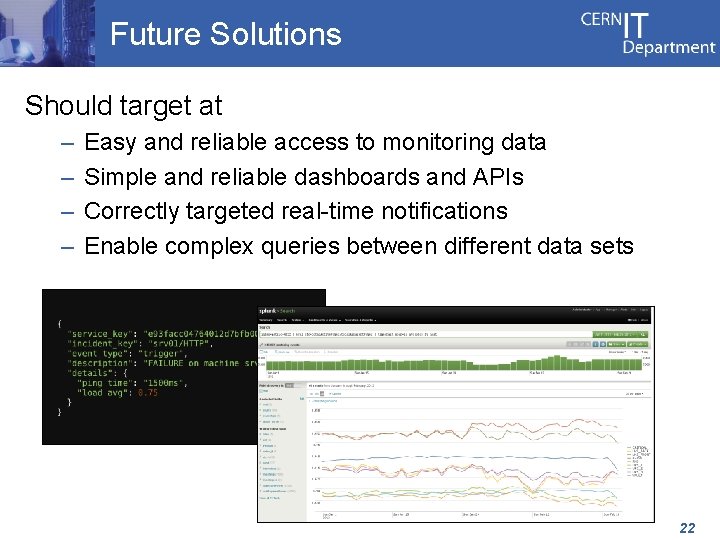
Future Solutions Should target at – – Easy and reliable access to monitoring data Simple and reliable dashboards and APIs Correctly targeted real-time notifications Enable complex queries between different data sets 22

Future Solutions Well designed monitoring toolchain – Appropriate for the infrastructure being monitored Consider alternatives to monitoring frameworks – Messaging infrastructure as transport layer Give top priority to the monitoring data ! – Single data format, flexible schema – Store all monitoring data (incl. historical) for analysis – Feed the system with curated monitoring data 23

Thank You ! 24