Methods Excerpt from Neonatal Intensive Care Nurse Stressors


. Crosssectional general population survey data")
. Crosssectional general population survey data")


- Slides: 39
Methods Excerpt from: Neonatal Intensive Care Nurse Stressors: An American Study All NICU nurses in an upper Midwestern state were invited to participate in this study (N=167); 59 nurses responded, yielding a 35% response rate. The study sample consisted of 58 females; 46 (78%) were married and 12 (20%) were single. The mean age was 34. 74 years (SD=5. 97). Thirty-four (58%) nurses were baccalaureate prepared, compared to 18 (30%) who were diploma nurses and 4 (7%) who held associate degrees. The mean for years practiced in NICU was 9. 2 (SD=5. 39). This compares to a mean of 12. 02 (SD=5. 76) for years practiced as a RN.
Methods Excerpt from: Neonatal Intensive Care Nurse Stressors: An American Study All NICU nurses in an upper Midwestern state were invited to participate in this study (N=167); 59 nurses responded, yielding a 35% response rate.
All NICU nurses in an upper Midwestern state were invited to participate in this study (N=167). Participants in this study were randomly chosen from health care units located in the upper Midwest of the United States.
• All NICU nurses in an upper Midwestern state were invited to participate in this study (N=167). • Participants in this study were randomly chosen from health care units located in the upper Midwest of the United States.
• All NICU nurses in an upper Midwestern state were invited to participate in this study (N=167). • Participants in this study were randomly chosen from health care units located in the upper Midwest of the United States.
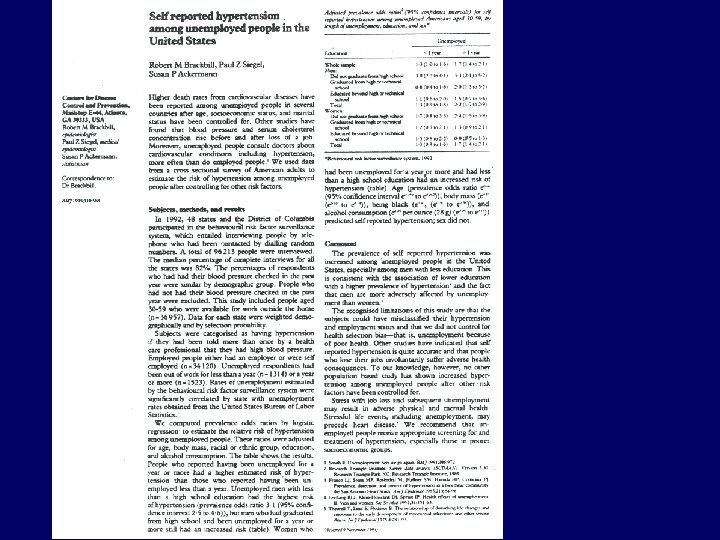
Data sources. Method Behavioral Risk Factor Surveillance System (BRFSS). Crosssectional general population survey data from 1987 to 1990, collected by the BRFSS, were analyzed. The number of participating states (including the District of Columbia) increased from 33 in 1987 to 45 in 1990. The primary objective of this system is to obtain state specific prevalences of behavioral risks in adult populations that are associated with the leading causes of death and morbidity. Using random-digit dialing, each state selects a random sample of its noninstitutionalized adult population (age 18 or older) who have a telephone. For instance, in 1990, thirty-seven states used a multistage cluster-sampling design based on the Waksberg method. A trained interviewer reaches a representative household, randomly selects one adult 18 years or older and administers a standard questionnaire (See Marks et al, 1985 or Remington et al, 1988, for more detailed description of method). To meet individual needs, states may choose to use different sampling methods, such as simple random or stratified sample designs. The interviewing instrument consisted of three parts: 1) a core of questions asked by all states, 2) standardized modules of questions that are developed by CDC and added at each state’s discretion, and 3) state questions that are developed at the discretion of each participating state to meet its specific needs. When possible, questions have been adopted from national surveys, such as the National Health and Nutrition Examination Surveys (NHANES) and the National Health Interview Surveys (NHIS). The edited data were weighted to the age-, race-, and sexspecific population counts from the most current census (or intercensal estimate) in each state, as well as for the respondent’s probability of selection. The total sample available in 1987 was 50080; in 1988, 56447; in 1989, 66867; and in 1990, 81557. 31
Data sources. Method Behavioral Risk Factor Surveillance System (BRFSS). Crosssectional general population survey data from 1987 to 1990, collected by the BRFSS, were analyzed. The number of participating states (including the District of Columbia) increased from 33 in 1987 to 45 in 1990. The primary objective of this system is to obtain state specific prevalences of behavioral risks in adult populations that are associated with the leading causes of death and morbidity. Using random-digit dialing, each state selects a random sample of its noninstitutionalized adult population (age 18 or older) who have a telephone. For instance, in 1990, thirty-seven states used a multistage cluster-sampling design based on the Waksberg method. A trained interviewer reaches a representative household, randomly selects one adult 18 years or older and administers a standard questionnaire (See Marks et al, 1985 or Remington et al, 1988, for more detailed description of method). To meet individual needs, states may choose to use different sampling methods, such as simple random or stratified sample designs. The interviewing instrument consisted of three parts: 1) a core of questions asked by all states, 2) standardized modules of questions that are developed by CDC and added at each state’s discretion, and 3) state questions that are developed at the discretion of each participating state to meet its specific needs. When possible, questions have been adopted from national surveys, such as the National Health and Nutrition Examination Surveys (NHANES) and the National Health Interview Surveys (NHIS). The edited data were weighted to the age-, race-, and sexspecific population counts from the most current census (or intercensal estimate) in each state, as well as for the respondent’s probability of selection. The total sample available in 1987 was 50080; in 1988, 56447; in 1989, 66867; and in 1990, 81557. 31
Analysis variables. Definition of hypertension. Hypertension case was defined by a “yes” to the question: “Have you ever been told by a doctor, nurse, or other health professional that you have high blood pressure? ” and “more than once” to: “ Have you been told on one or more occasions that your blood pressure was high, or have you been told this only once? ” Definition of employment status. We defined employment status (employed, unemployed less than one year, and unemployed more than one year) by the respondent selfclassifying him/herself as: “employed for wages”; selfemployed”; “out of work for less than one year”; “homemaker”; “student”; or “retired”. Respondents who identified themselves as a homemaker, student, or retired (not in the labor force) were excluded from the analysis. Those who were self-employed or employed for wages were considered employed. The two categories of unemployment represented two levels of “exposure. ” Definition of covariates. Ethnic group. The three ethnic/racial groups used were white, African-American or black, and Hispanic. Two questions on the BRFSS defined these groups: (1) “What is your race? Would you say [White; black; Asian, pacific islander; Aleutian; Eskimo or American Indian; or Other]”; and (2) “Are you of Hispanic origin, such as Mexican American; Latin American; Puerto Rican; or Cuban? ” [yes; no; don’t know/not sure refused]. White was defined as a response of “white” to (1) and a “no”, don’t know/not sure, or refused to (2) ; African American by “Black” to (1) and “no”, don’t know/not sure or refused to (2) ; and Hispanic by “White” or “Black” to (1) and “yes” to (2). Age group. Each respondent was assigned to one of five age groups (18 to 30 years old; 30 -39 years; 40 -49 years; 50 -59 years; and 60 or more years) by using the answer to the question “How old were you on your last birthday? ” 32
Alcohol consumption. A measure of alcohol consumption was derived using the following BRFSS questions that asked about number of days per month or week alcohol was consumed and number of drinks on each occasion. In 1987 and 1988, the questions asked specifically about beer, wine, and spirits, while 1989 and 1990 combined these categories of alcoholic beverages into single items. The procedure for computing consumption of ounces of ethanol per week was structured on the basis of these two approaches. For all years the first question established whether the respondent consumed alcohol regularly: “Have you had any beer, wine coolers, cocktails, or liquors during the past month, that is since ____? ” [yes, no]. For 1987 and 1988, two questions for each category were asked: “During the past month, how many days per week or per month did you drink __ ? ” and; “On the days when you drank __, about how many beers did you drink on the average? ”. The questions for 1989 and 1990 were asked similarly, except that the second question consisted of: “A drink is one can or bottle of beer, one glass of wine, one can or bottle of wine cooler, one cocktail, or one shot of liquor. On days when you drank, about how many drinks did you drink on the average? ”. On the basis of responses to these questions, an estimate of ounces of ethanol was computed. We assumed that. 16 oz of ethanol were consumed in one drink, using as a proportion of all drinks consumed being 45% beer (for 1989 and 1990) (. 04 oz of ethanol per drink), 35% wine (. 15 oz), and 20% spirits (. 45 oz). Six consumption categories were used after Laforge et al (1990): None, >0 -1 ounces per week, >2 -4, >4 -10 oz, >10 oz. 33
Alcohol consumption. A measure of alcohol consumption was derived using the following BRFSS questions that asked about number of days per month or week alcohol was consumed and number of drinks on each occasion. In 1987 and 1988, the questions asked specifically about beer, wine, and spirits, while 1989 and 1990 combined these categories of alcoholic beverages into single items. The procedure for computing consumption of ounces of ethanol per week was structured on the basis of these two approaches. For all years the first question established whether the respondent consumed alcohol regularly: “Have you had any beer, wine coolers, cocktails, or liquors during the past month, that is since ____? ” [yes, no]. For 1987 and 1988, two questions for each category were asked: “During the past month, how many days per week or per month did you drink __ ? ” and; “On the days when you drank __, about how many beers did you drink on the average? ”. The questions for 1989 and 1990 were asked similarly, except that the second question consisted of: “A drink is one can or bottle of beer, one glass of wine, one can or bottle of wine cooler, one cocktail, or one shot of liquor. On days when you drank, about how many drinks did you drink on the average? ”. On the basis of responses to these questions, an estimate of ounces of ethanol was computed. We assumed that. 16 oz of ethanol were consumed in one drink, using as a proportion of all drinks consumed being 45% beer (for 1989 and 1990) (. 04 oz of ethanol per drink), 35% wine (. 15 oz), and 20% spirits (. 45 oz). Six consumption categories were used after Laforge et al (1990): None, >0 -1 ounces per week, >2 -4, >4 -10 oz, >10 oz. 33 300 words !
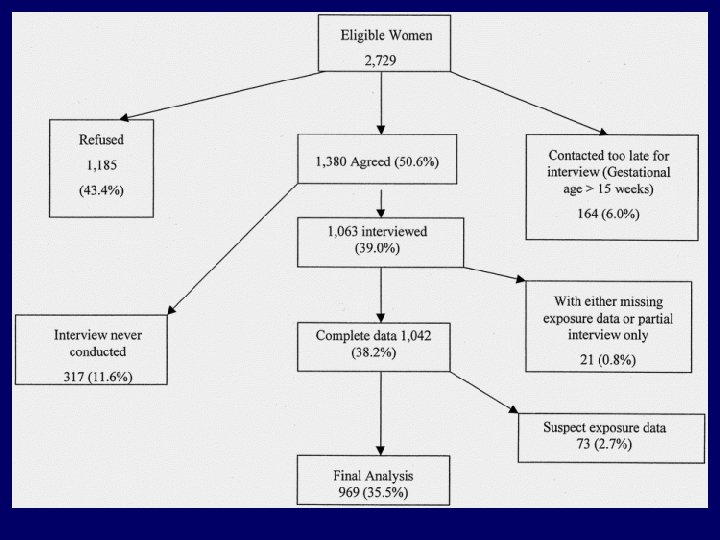
Value of flow diagrams in reports of randomized controlled trials JAMA 2001; 285: 1996– 1999
The METHODS Purpose: to describe how you collected, organized analyzed the data • Describe what you did, not what you found (Results) • Respect chronology • Describe original methods in detail; otherwise give references. (length varies depending on originality of methods used)
The METHODS Purpose: to describe how you collected, organized analyzed the data (that are relevant to the purpose of the study) • Clearly present and define all analysis variables. • Organize into logical subsections that illustrate the steps you took to collect, organize and analyze the data. • Describe what you did, not what you found (Results) • Respect chronology • Describe original methods in detail; otherwise give references. (length varies depending on originality of methods used)
Analysis variables. Definition of hypertension. Hypertension case was defined by a “yes” to the question: “Have you ever been told by a doctor, nurse, or other health professional that you have high blood pressure? ” and “more than once” to: “ Have you been told on one or more occasions that your blood pressure was high, or have you been told this only once? ” Definition of employment status. We defined employment status (employed, unemployed less than one year, and unemployed more than one year) by the respondent selfclassifying him/herself as: “employed for wages”; selfemployed”; “out of work for less than one year”; “homemaker”; “student”; or “retired”. Respondents who identified themselves as a homemaker, student, or retired (not in the labor force) were excluded from the analysis. Those who were self-employed or employed for wages were considered employed. The two categories of unemployment represented two levels of “exposure. ” Definition of covariates. Ethnic group. The three ethnic/racial groups used were white, African-American or black, and Hispanic. Two questions on the BRFSS defined these groups: (1) “What is your race? Would you say [White; black; Asian, pacific islander; Aleutian; Eskimo or American Indian; or Other]”; and (2) “Are you of Hispanic origin, such as Mexican American; Latin American; Puerto Rican; or Cuban? ” [yes; no; don’t know/not sure refused]. White was defined as a response of “white” to (1) and a “no”, don’t know/not sure, or refused to (2) ; African American by “Black” to (1) and “no”, don’t know/not sure or refused to (2) ; and Hispanic by “White” or “Black” to (1) and “yes” to (2). Age group. Each respondent was assigned to one of five age groups (18 to 30 years old; 30 -39 years; 40 -49 years; 50 -59 years; and 60 or more years) by using the answer to the question “How old were you on your last birthday? ” 32
Reliability of Information on Chronic Disease Risk Factors Collected in the Missouri Behavioral Risk Factor Surveillance System Are the analysis variables clearly defined?
If we read references 16 -20, what can we expect to learn about the analysis variables? • • how to measure/interpret “agreement”? how to measure/interpret “reliability”? whether reliability and agreement mean the same thing? how Pearson and Spearman correlation coefficients are used to measure “agreement”?
The METHODS Purpose: to describe how you collected, organized analyzed the data (that are relevant to the purpose of the study) • Clearly present and define all analysis variables. • Organize into logical subsections that illustrate the steps you took to collect, organize and analyze the data.
Examples of Subsection Headings • Study population – – • • How many subjects were eligible (eligibilty criteria) How many declined to participate (and why) How many participated How many dropped out Sampling methods Laboratory methods Epidemiologic investigation Baseline data collection Diagnostic Evaluation Intervention Follow-up Definition of variables – Exposure variables – Outcome variables – Case definition • Statistical analysis
Risk Factors for Invasive Pneumococcal Disease among Navajo Adults METHODS Setting and Case Ascertainment Participants Data Collection Definitions of Study Variables Statistical Analysis Ethical Considerations
Soft Drink Consumption and Risk of Developing Cardiometabolic Risk Factors and the Metabolic Syndrome in Middle-Aged Adults in the Community METHODS Study Sample Measurement of Covariates Assessment of Soft Drink Consumption and Dietary Intake of Other Foods Definition and Components of the Metabolic Syndrome Statistical Analyses Soft Drink Consumption and Prevalence of the Metabolic Syndrome Soft Drink Consumption and Incidence of the Metabolic Syndrome Incidence of Individual Components of the Metabolic Syndrome
METHODS Participants Intervention Process and Outcome Measures Statistical Analysis
METHODS Participants Intervention Process and Outcome Measures Diet and Physical Activity Data Anthropometric Data Metabolic Measures Statistical Analysis
Enrollment Allocation Follow-up Analysis
The METHODS Purpose: to describe how you collected, organized analyzed the data • Clearly present and define all analysis variables. • Organize into logical subsections that illustrate the steps you took to collect, organize and analyze the data. • Describe what you did, not what you found (Results) • Respect chronology • Describe original methods in detail; otherwise give references. (length varies depending on originality of methods used)
Health Perceptions and Survival: Do Global Evaluations of Health Status Really Predict Mortality? Methods (excerpt). . A total of 624 deaths occurred in the four years, 334 among the 1, 166 men (28. 6%) and 290 among the 1, 646 women (17. 6%). Because these mortality rates were quite different, all analyses were performed separately by sex. Because sex-specific death rates were unequal (male = 28. 6%, female = 17. 6%), all analyses were performed separately by sex. Idler EL, Kasl S. J Gerontol 991; 46(2): S 55 -65
Influence of Social Factors on Avoidable Mortality: A Hospital-Based Case-Control Study “. . . 124 patients died of some type of avoidable mortality cause. . -- Public Health Reports. Jan-Feb 2005: 55 -62
“. . 124 patients died of an avoidable cause. . Of the 124 eligible cases, 42 were excluded from the analysis. . . ? ? Is the term “patient who died of an avoidable cause” interchangeable with “eligible case”?
“. . 124 patients died of an avoidable cause. . Of the 124 eligible cases, 42 were excluded from the analysis. . .
“. . . 124 patients died of an avoidable cause. Forty-two of them were excluded from the analysis, including seven whose relatives declined, 11 who had no known telephone or address, and 24 who did not answer after five calls. The remaining 82 cases were included and interviewed. ” Huh? ? ? The bear of little brain has to read this twice (at least). How about you?
Forty-two of them were excluded from the analysis, including seven whose relatives declined, 11 who had no known telephone or address, and 24 who did not answer after five calls. The remaining 82 cases were included and interviewed. ”
Forty-two of them were excluded from the analysis, including seven whose relatives declined, 11 who had no known telephone or address, and 24 who did not answer after five calls. The remaining 82 cases were included and interviewed. ” Strunk and White – Rule 7, page 7 “use a colon to introduce a list”
Forty-two of them were excluded from the analysis, including seven whose relatives declined, 11 who had no known telephone or address, and 24 who did not answer after five calls. The remaining 82 cases were included and interviewed. ” Let’s try to wordsmith this, using a colon.
Forty-two of them were excluded from the analysis, including seven whose relatives declined, 11 who had no known telephone or address, and 24 who did not answer after five calls. Forty-two of them were excluded from the analysis: • •
Forty-two of them were excluded from the analysis: eleven had no known telephone or address; in seven cases relatives declined to participate; and in 24 cases no family member could be contacted within five call attempts. Relatives of the remaining 82 cases were interviewed. ” Strunk and White – Principle of Composition #15: “Put statements in positive form. ”
“Put statements in positive form. ” “. . . 124 patients died of an avoidable cause. Relatives of 82 were interviewed. The remaining 42 were excluded, either because they had no known telephone or address (n=11), relatives declined to participate (n=7), or no family member could be contacted within five call attempts (n=24). ”