Maximo UK Ireland User Group Using Splunk to


- Slides: 15

Maximo UK & Ireland User Group Using Splunk to monitor Maximo • S. Poore Vinci Facilities • M. Robbins Vetasi IBM Champion for Cloud 2017 (https: //goo. gl/Gwm. IJ 3 ) • 09/05/2017 Confidential to Vetasi Ltd

Vinci’s Maximo system • • • Complex 7. 1 system generating over 4 GB of logs a day Impossible to manually read the logs on a regular basis Support staff knew they were missing problems IT under pressure to resolve problem system IT suspected some users/user processes at fault Users complained that new releases made it slower – no proof to rebut • Wanted to be proactive and resolve problems before escalated or even before noticed

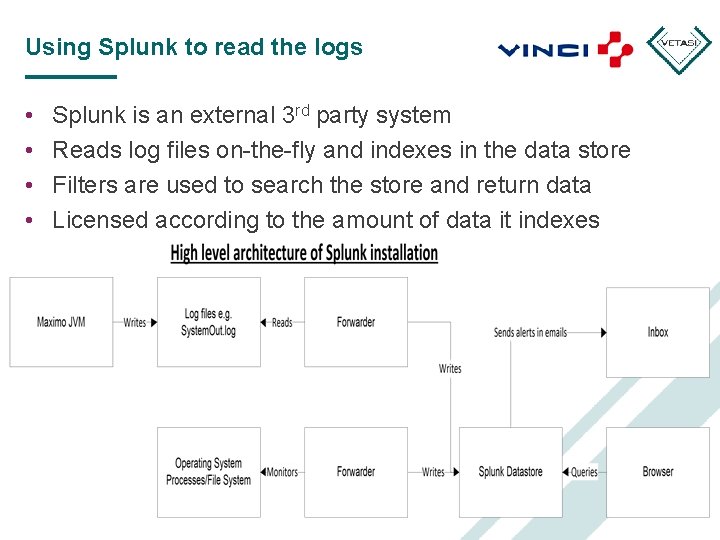
Using Splunk to read the logs • • Splunk is an external 3 rd party system Reads log files on-the-fly and indexes in the data store Filters are used to search the store and return data Licensed according to the amount of data it indexes

Searches for patterns in logs • • • Splunk searches for patterns e. g. error codes in log entries Indexes individual fields e. g. error code and datestamp Generate alerts/emails if specific patterns seen/trends occur New patterns can be added quickly without development work Support staff can use a browser to view the data

Data can be visualised • • • JVM’s memory usage Workflow timings User actions can be traced when userid in log entries Can quickly search across entries for all servers Steve is going to show some cases

BIRT report that killed JVMs – unusual cause • • Not the normal “user exports lots of data” cause There was no large output using up disk space/memory Login entries didn’t show excessive overloading Users used links in the report to create new window hosting Maximo session – This created hidden Web Client Sessions (see next slide) • Users closed new window but didn’t logout of the session • Splunk showed: – User running report – Memory usage going up – Number of Web Client Sessions (WCS) rising (created without user having to login)

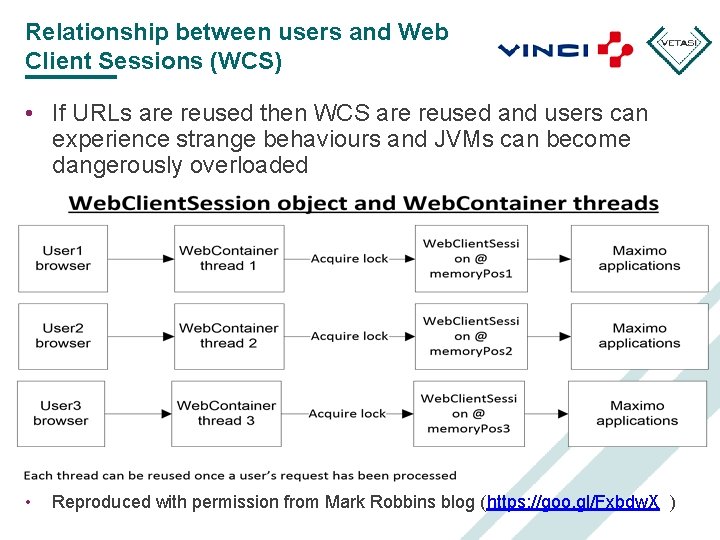
Relationship between users and Web Client Sessions (WCS) • If URLs are reused then WCS are reused and users can experience strange behaviours and JVMs can become dangerously overloaded • Reproduced with permission from Mark Robbins blog (https: //goo. gl/Fxbdw. X )

Getting the most value Installed custom Vetasi software into Maximo • Monitors the health of the JVM Can dynamically log details such as: • Users who are logged in when the memory is low • Warn when there are too many specific objects in memory e. g. Workorders • JVMs uptime – did the JVM really restart as expected? • Warn if JVM ran out of memory • Workflow timings • Other details to help support people Will create bulletin board alerts for faults

Used automated accounts to replicate user behaviour (neosense) • • Neosense was installed to replicate user’s behaviours Ran client installed on PC at actual client site Created real records in the database for test sites If a user at site A and the Neosense client reported slow timing then possible network problem • If just user’s session was slow then could be JVM or user related issue

Considering monitoring Understand: • How much are problems hidden in the logs costing you? • What do you want to look for? • How will you respond when you find it? • What can you actually do if there is a problem? Mark and Steve spent two days in a room discussing: • What the concerns were • What was possible • How to respond to particular messages • How to detect particular problems Mark gave Steve’s team two days training on: • How to interpret the logs and the important messages • How to interpret errors & identifying code that generated them • How to read their custom Java and possible problems • Maximo architecture e. g. how is memory used/freed?

Major benefits • Key events available in one place for all JVMs/web servers • Ability to instantly check logs when a helpdesk call arrives • Compare results between JVMs in real time – is it system wide? • Able to compare events against past e. g. before a release • Able to send out automatic alerts/emails • Can be used to monitor other systems e. g. Syclo • Can alert on low disk space (other system monitors this) • Shown hidden causes of problems – User who shares sessions and then logs out of one session and blocks other users – Multiple JVMs experiencing high CPU at the same time

Gotchas Maximo isn’t designed for automated monitoring • Can say there is a problem but it won’t tell you if it is fixed e. g. low disk space that is freed because task is over • Tells you the amount of free memory it is using but in a format that requires additional computation Splunk specific • Need to learn regular expressions • Can’t produce entries for earlier events – If a log entry stated that a problem started 5 minutes then it would be useful to have a warning message 5 minutes earlier in the Splunk indexes • Some problems require analysis by Vetasi’s log analysis tools – Provide specialist information e. g. Providing historical view – Giving a big picture view of data across multiple JVMs with easy filtering in Excel

Summary Implementing Splunk with Maximo customisations has: • Enabled quicker response times • Proactive real time analysis when problems occur • Uncovered hidden causes of problems • Allowed helpdesk team to tell users they know about issues • Allowed significant new avenues of problem analysis – Automatically recording users logged in when memory is running low – Identifying users running dataload operations on wrong JVMs – Identifying workflows that have slowed down over time If you need further information then contact Mark or Steve

Any questions? • Please restrict to content in the presentation • Steve Poore – Stephen. Poore@vinci. plc. uk • Mark Robbins - mark. robbins@Vetasi. com

Who are Mark Robbins & Steve Poore? • Steve Poore – – Support Analyst for Vinci Facilities Maintains the Splunk system Performs deep technical analysis Liaises closely with Mark Robbins • Mark is a support lead & trainer for Vetasi (Gold business partner) – – Reviews support calls & works on highly technical calls IBM Champion for Cloud 2017 Teaches technical courses for Maximo & Websphere Blogs about support issues ( https: //goo. gl/Gwm. IJ 3 )