Maryland Epidemiology and Genotyping Update Wendy Cronin Ph



- Slides: 37
Maryland Epidemiology and Genotyping Update Wendy Cronin, Ph. D, Epidemiologist Center for TB Control & Prevention Maryland Department of Health & Mental Hygiene TB Annual Meeting March 22, 2016 TB Annual Update, March 22, 2016
Presentation Outline • Global TB Epidemiology (2014) • Maryland TB Epidemiology (2015) – TB case numbers and trends – Demographics – Drug resistance – Comorbidities – Genotyping • TBESC Update TB Annual Update, March 22, 2016
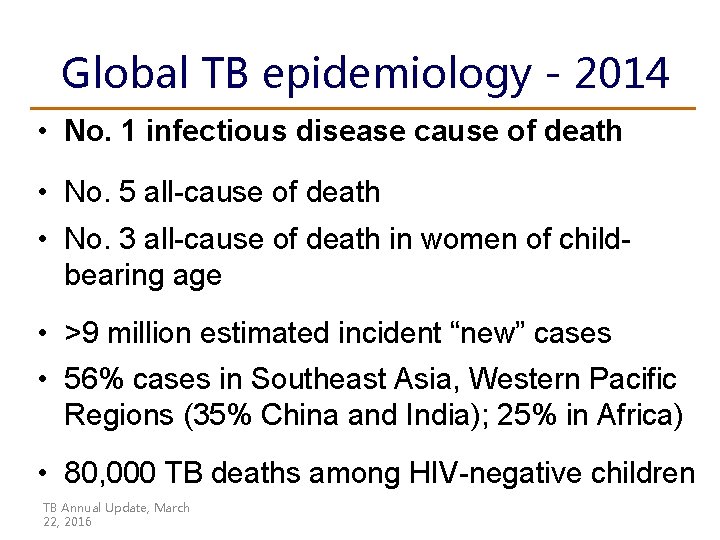
Global TB epidemiology - 2014 • No. 1 infectious disease cause of death • No. 5 all-cause of death • No. 3 all-cause of death in women of childbearing age • >9 million estimated incident “new” cases • 56% cases in Southeast Asia, Western Pacific Regions (35% China and India); 25% in Africa) • 80, 000 TB deaths among HIV-negative children TB Annual Update, March 22, 2016
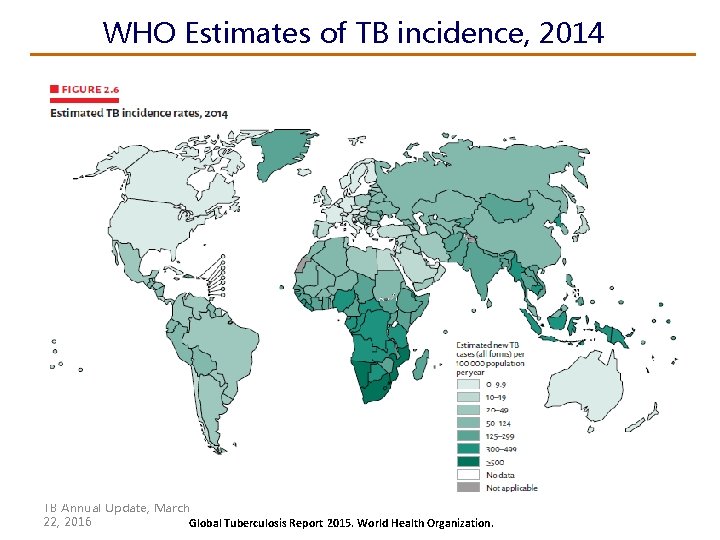
WHO Estimates of TB incidence, 2014 TB Annual Update, March 22, 2016 Global Tuberculosis Report 2015. World Health Organization.
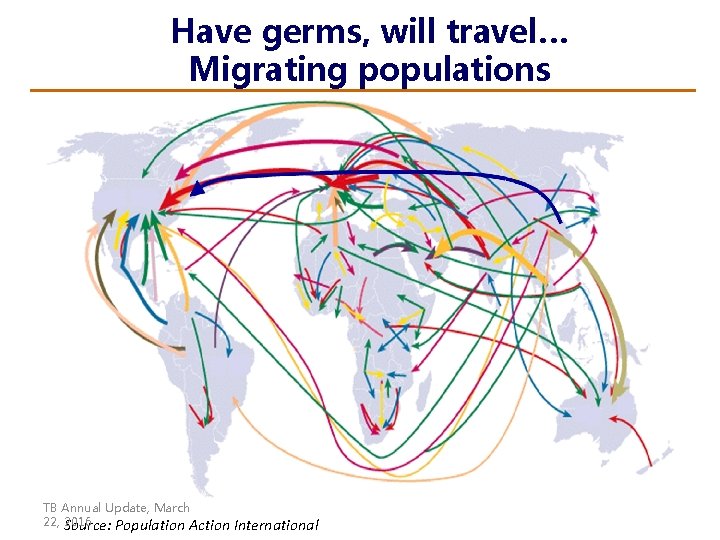
Have germs, will travel… Migrating populations TB Annual Update, March 22, Source: 2016 Population Action International
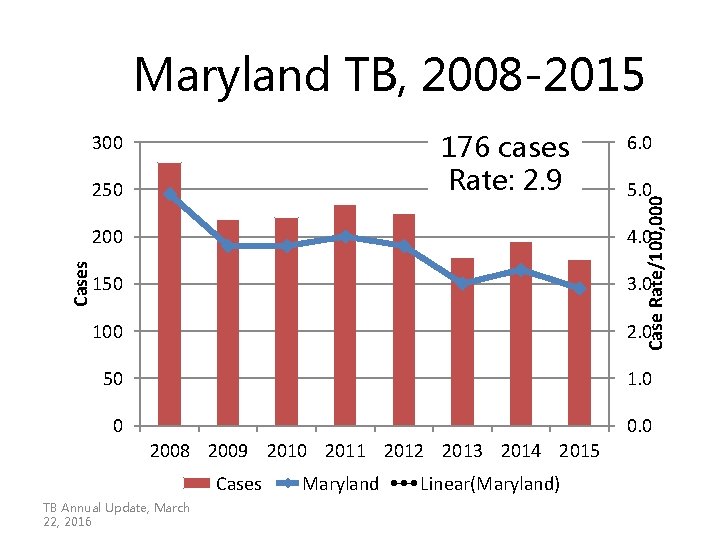
Maryland TB, 2008 -2015 Cases 250 6. 0 5. 0 Case Rate/100, 000 176 cases Rate: 2. 9 300 200 4. 0 150 3. 0 100 2. 0 50 1. 0 0 0. 0 2008 2009 2010 2011 2012 2013 2014 2015 Cases TB Annual Update, March 22, 2016 Maryland Linear(Maryland)
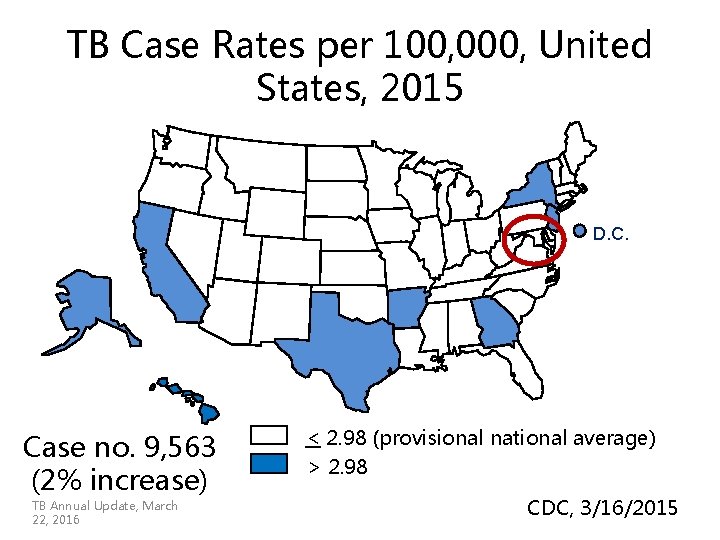
TB Case Rates per 100, 000, United States, 2015 D. C. Case no. 9, 563 (2% increase) TB Annual Update, March 22, 2016 < 2. 98 (provisional national average) > 2. 98 CDC, 3/16/2015
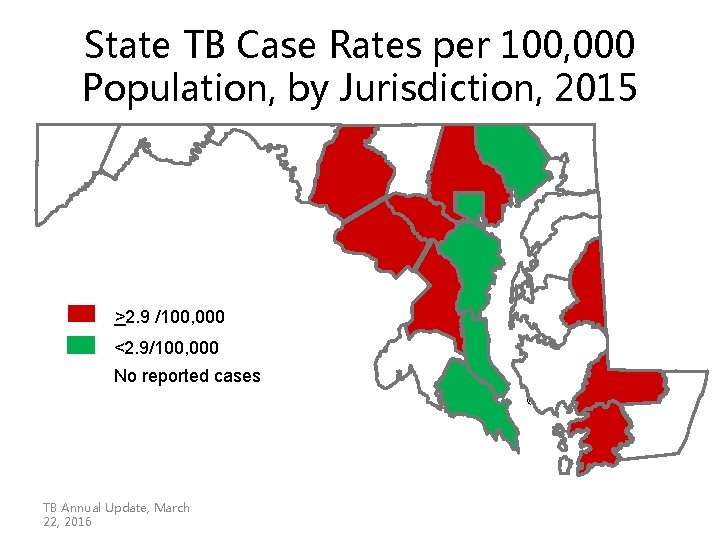
State TB Case Rates per 100, 000 Population, by Jurisdiction, 2015 >2. 9 /100, 000 <2. 9/100, 000 No reported cases TB Annual Update, March 22, 2016
Baltimore City Rate: 2. 2! TB Annual Update, March 22, 2/26/2021 2016
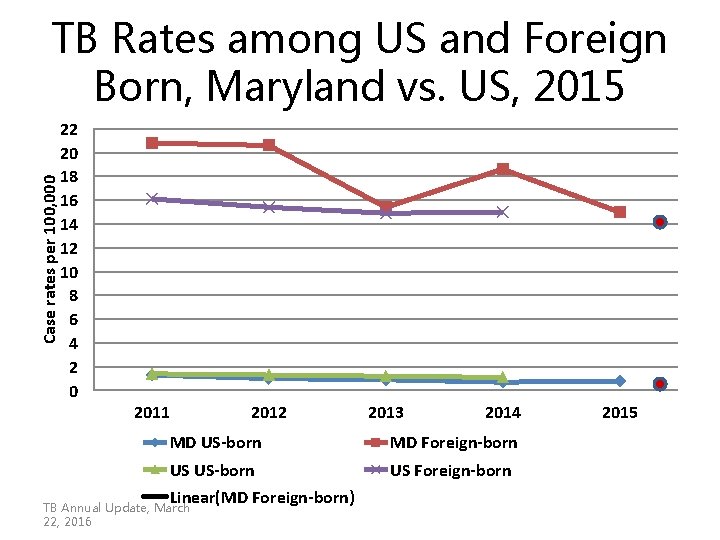
Case rates per 100, 000 TB Rates among US and Foreign Born, Maryland vs. US, 2015 22 20 18 16 14 12 10 8 6 4 2 0 2011 2012 2013 2014 MD US-born MD Foreign-born US US-born US Foreign-born Linear(MD Foreign-born) TB Annual Update, March 22, 2016 2015
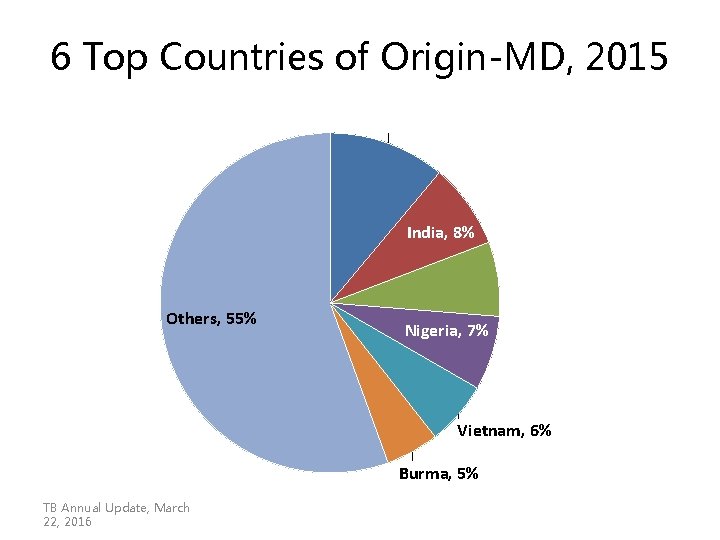
6 Top Countries of Origin-MD, 2015 Ethiopia, 11% India, 8% El Salvador, 7% Others, 55% Nigeria, 7% Vietnam, 6% Burma, 5% TB Annual Update, March 22, 2016
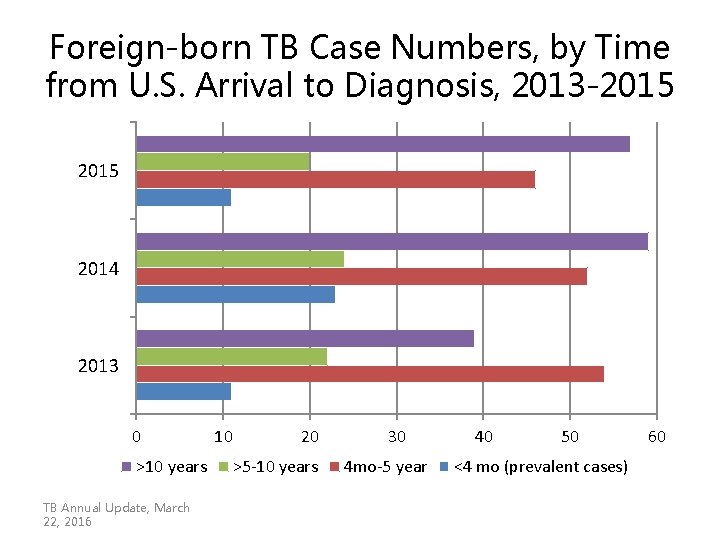
Foreign-born TB Case Numbers, by Time from U. S. Arrival to Diagnosis, 2013 -2015 2014 2013 0 >10 years TB Annual Update, March 22, 2016 10 20 >5 -10 years 30 4 mo-5 year 40 50 <4 mo (prevalent cases) 60
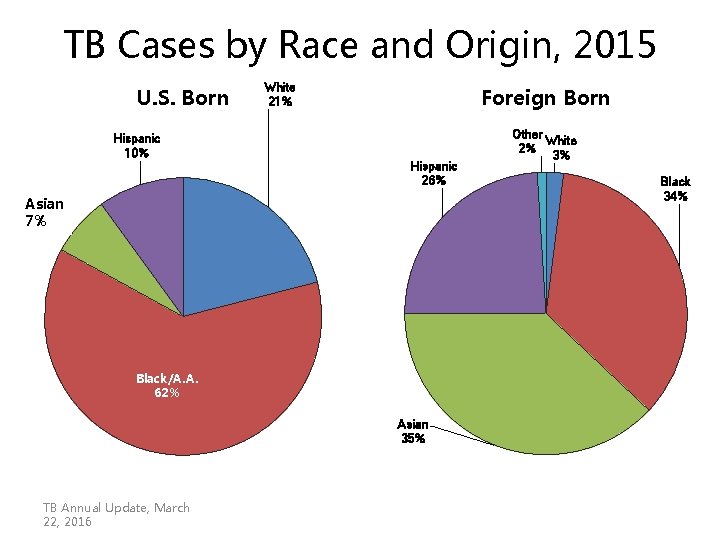
TB Cases by Race and Origin, 2015 U. S. Born Hispanic 10% White 21% Foreign Born Hispanic 26% Asian 7% Black/A. A. 62% Asian 35% TB Annual Update, March 22, 2016 Other White 2% 3% Black 34%
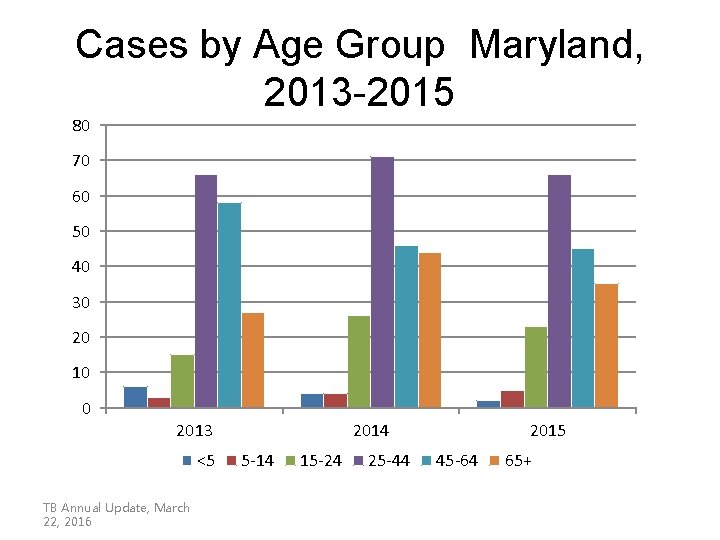
Cases by Age Group Maryland, 2013 -2015 80 70 60 50 40 30 20 10 0 2013 <5 TB Annual Update, March 22, 2016 2014 5 -14 15 -24 25 -44 2015 45 -64 65+
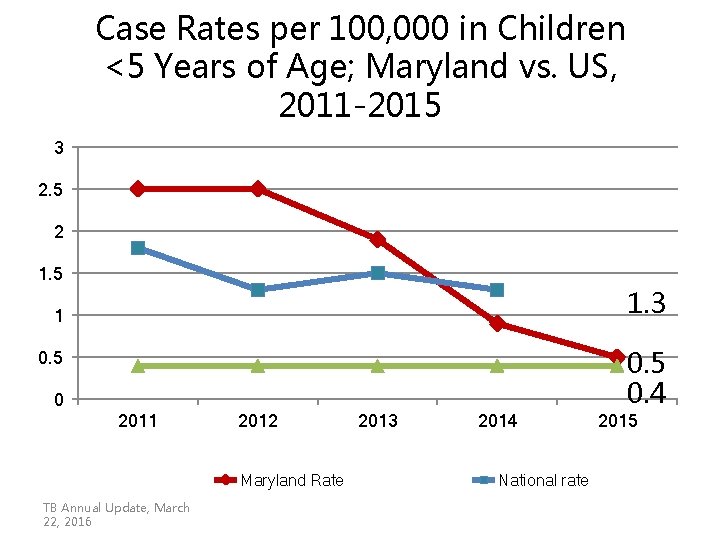
The Canary in the Coal Mine • Children under 5 years old – At high risk for TB meningitis, disseminated TB – Disease can progress quickly – Important to find source case • Stop further transmission – Can represent undiagnosed adult cases TB Annual Update, March 22, 2016
Case Rates per 100, 000 in Children <5 Years of Age; Maryland vs. US, 2011 -2015 3 2. 5 2 1. 5 1. 3 1 0. 5 0. 4 0. 5 0 2011 2012 Maryland Rate TB Annual Update, March 22, 2016 2013 2014 National rate 2015
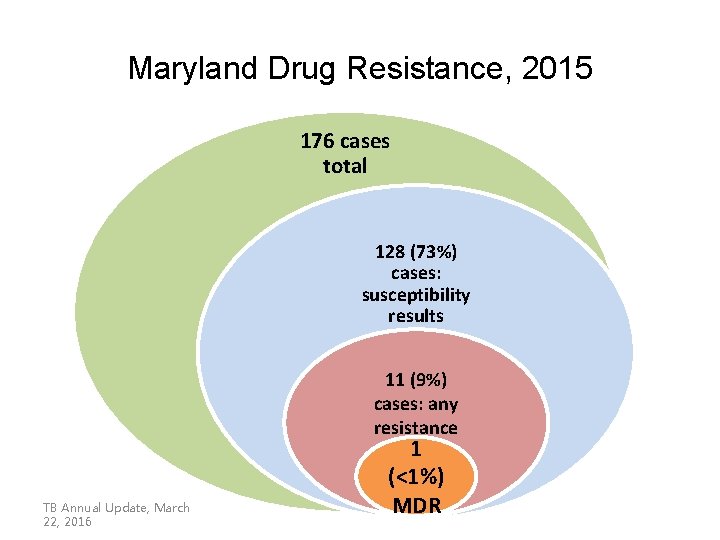
Maryland Drug Resistance, 2015 176 cases total 128 (73%) cases: susceptibility results 11 (9%) cases: any resistance TB Annual Update, March 22, 2016 1 (<1%) MDR
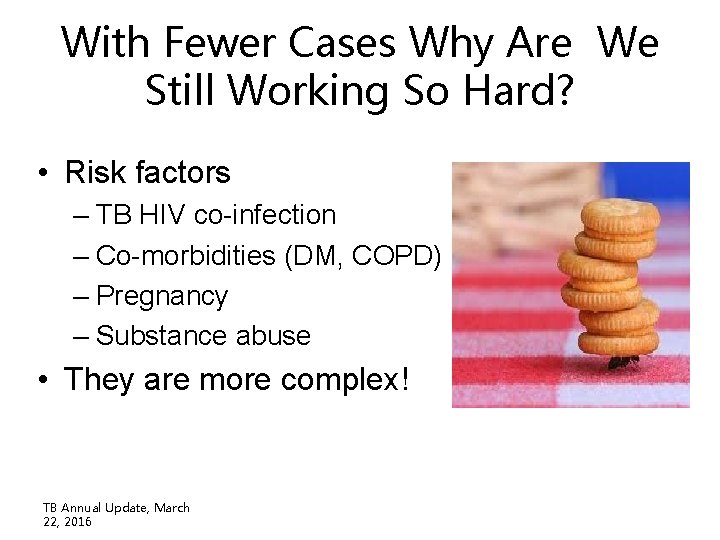
With Fewer Cases Why Are We Still Working So Hard? • Risk factors – TB HIV co-infection – Co-morbidities (DM, COPD) – Pregnancy – Substance abuse • They are more complex! TB Annual Update, March 22, 2016
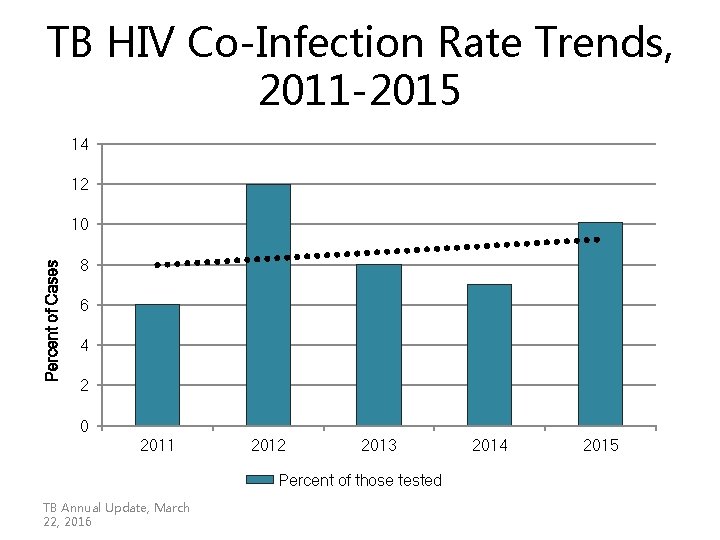
TB HIV Co-Infection Rate Trends, 2011 -2015 14 12 Percent of Cases 10 8 6 4 2 0 2011 2012 2013 Percent of those tested TB Annual Update, March 22, 2016 2014 2015
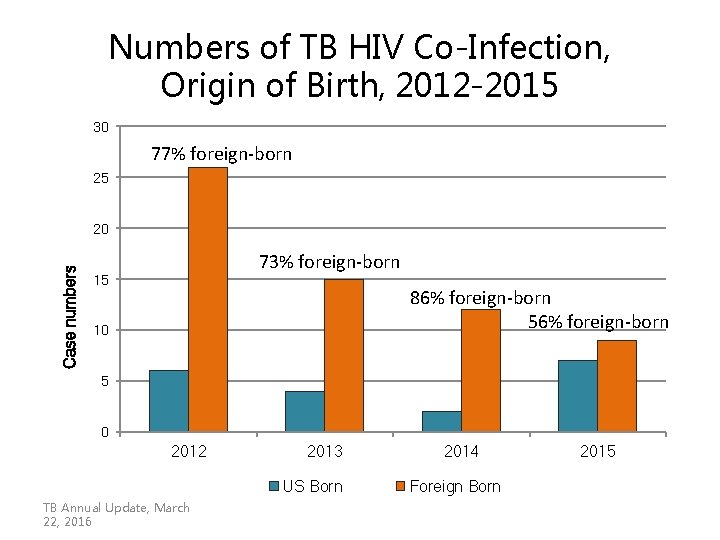
Numbers of TB HIV Co-Infection, Origin of Birth, 2012 -2015 30 77% foreign-born 25 Case numbers 20 73% foreign-born 15 86% foreign-born 56% foreign-born 10 5 0 2012 2013 US Born TB Annual Update, March 22, 2016 2014 Foreign Born 2015
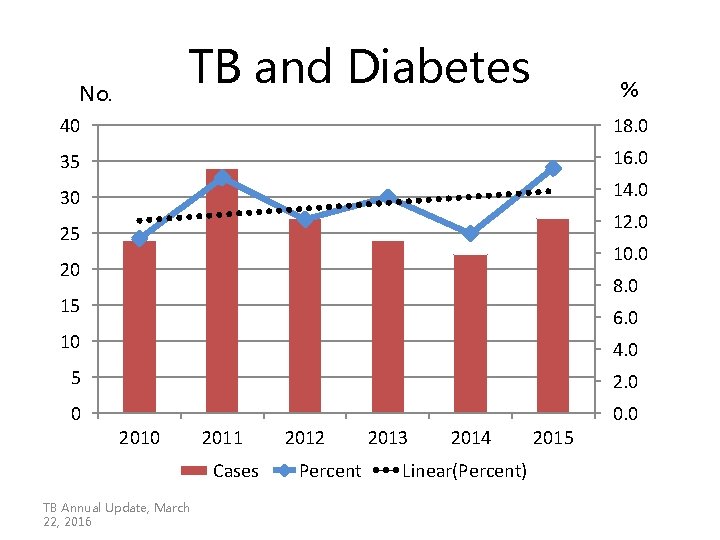
TB and Diabetes No. % 40 18. 0 35 16. 0 30 14. 0 12. 0 25 10. 0 20 8. 0 15 6. 0 10 4. 0 5 2. 0 0 0. 0 2011 Cases TB Annual Update, March 22, 2016 2012 Percent 2013 2014 Linear(Percent) 2015
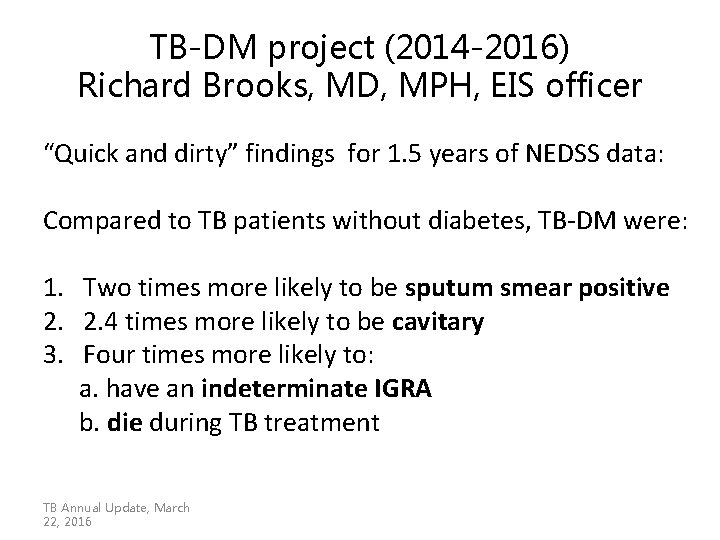
TB-DM project (2014 -2016) Richard Brooks, MD, MPH, EIS officer “Quick and dirty” findings for 1. 5 years of NEDSS data: Compared to TB patients without diabetes, TB-DM were: 1. Two times more likely to be sputum smear positive 2. 2. 4 times more likely to be cavitary 3. Four times more likely to: a. have an indeterminate IGRA b. die during TB treatment TB Annual Update, March 22, 2016
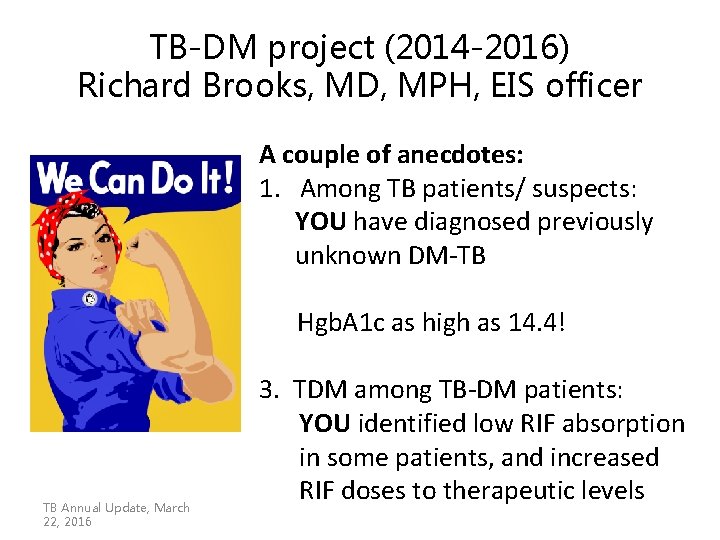
TB-DM project (2014 -2016) Richard Brooks, MD, MPH, EIS officer A couple of anecdotes: 1. Among TB patients/ suspects: YOU have diagnosed previously unknown DM-TB Hgb. A 1 c as high as 14. 4! TB Annual Update, March 22, 2016 3. TDM among TB-DM patients: YOU identified low RIF absorption in some patients, and increased RIF doses to therapeutic levels
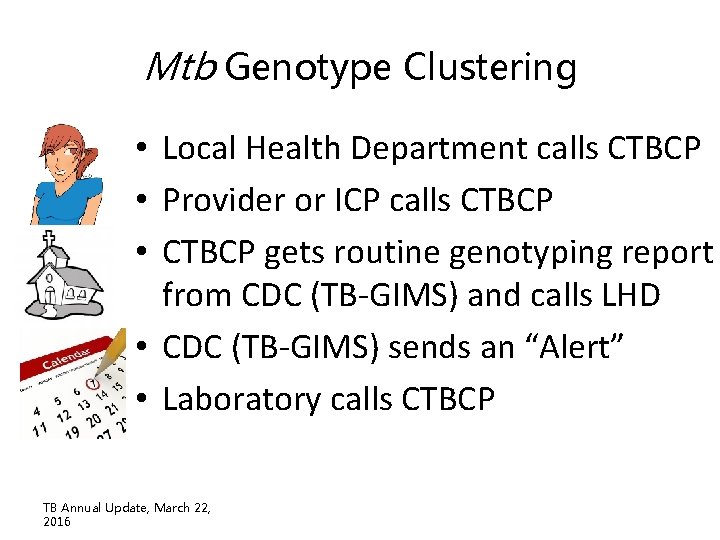
Mtb Genotype Clustering • Local Health Department calls CTBCP • Provider or ICP calls CTBCP • CTBCP gets routine genotyping report from CDC (TB-GIMS) and calls LHD • CDC (TB-GIMS) sends an “Alert” • Laboratory calls CTBCP TB Annual Update, March 22, 2016
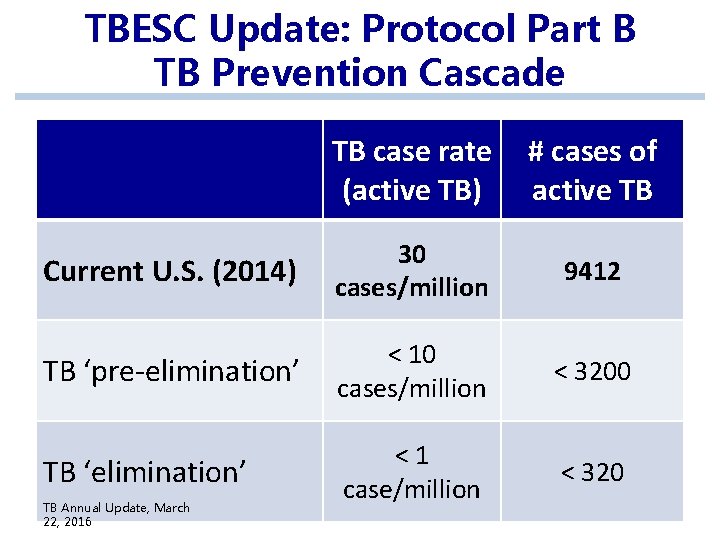
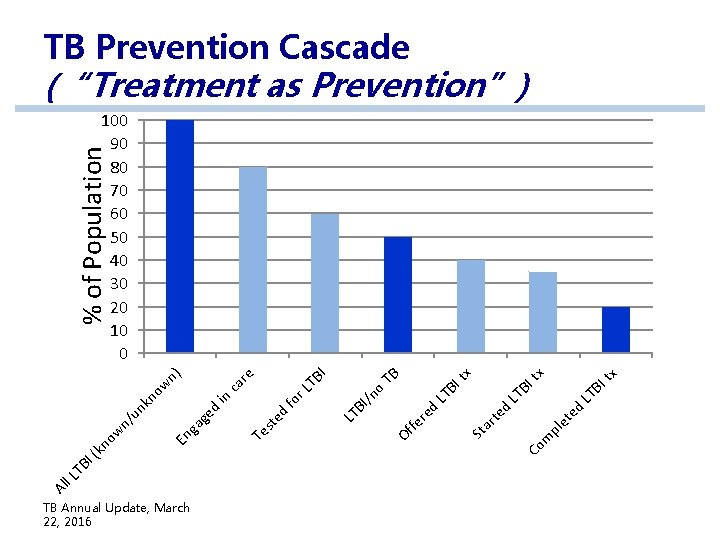
TBESC Update: Protocol Part B TB Prevention Cascade TB case rate (active TB) # cases of active TB Current U. S. (2014) 30 cases/million 9412 TB ‘pre-elimination’ < 10 cases/million < 3200 TB ‘elimination’ <1 case/million < 320 TB Annual Update, March 22, 2016
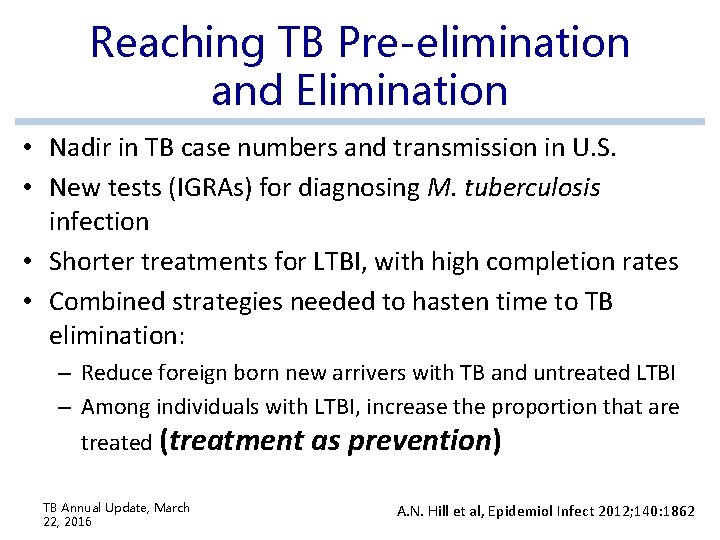
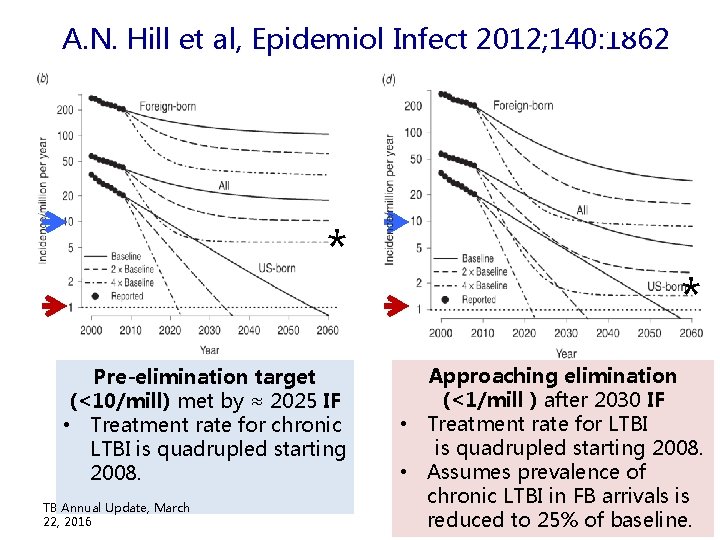
Reaching TB Pre-elimination and Elimination • Nadir in TB case numbers and transmission in U. S. • New tests (IGRAs) for diagnosing M. tuberculosis infection • Shorter treatments for LTBI, with high completion rates • Combined strategies needed to hasten time to TB elimination: – Reduce foreign born new arrivers with TB and untreated LTBI – Among individuals with LTBI, increase the proportion that are treated (treatment as prevention) TB Annual Update, March 22, 2016 A. N. Hill et al, Epidemiol Infect 2012; 140: 1862
A. N. Hill et al, Epidemiol Infect 2012; 140: 1862 * Pre-elimination target (<10/mill) met by ≈ 2025 IF • Treatment rate for chronic LTBI is quadrupled starting 2008. TB Annual Update, March 22, 2016 * Approaching elimination (<1/mill ) after 2030 IF • Treatment rate for LTBI is quadrupled starting 2008. • Assumes prevalence of chronic LTBI in FB arrivals is reduced to 25% of baseline.
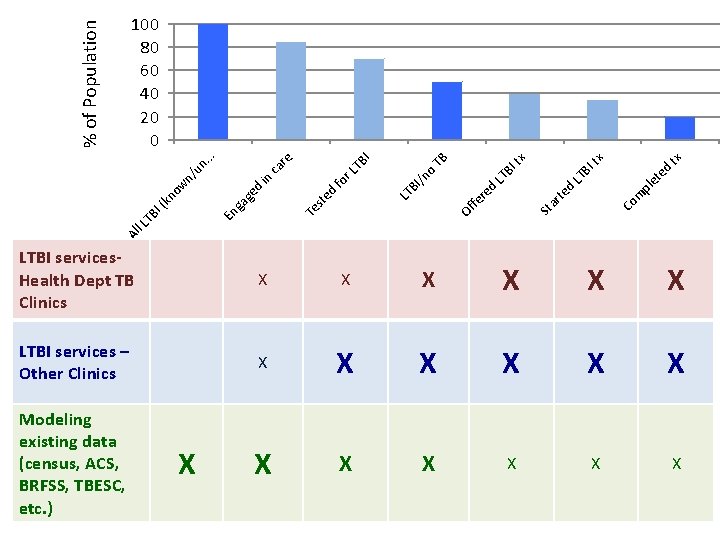
TB Annual Update, March 22, 2016 ed et pl Co m te d ar St d re Of fe LT BI tx x BI t tx TB LT BI LT n) re ca o /n fo r in LT BI ed st Te ge d ga En kn ow un n/ ow kn TB I( l. L Al % of Population TB Prevention Cascade (“Treatment as Prevention”) 100 90 80 70 60 50 40 30 20 10 0
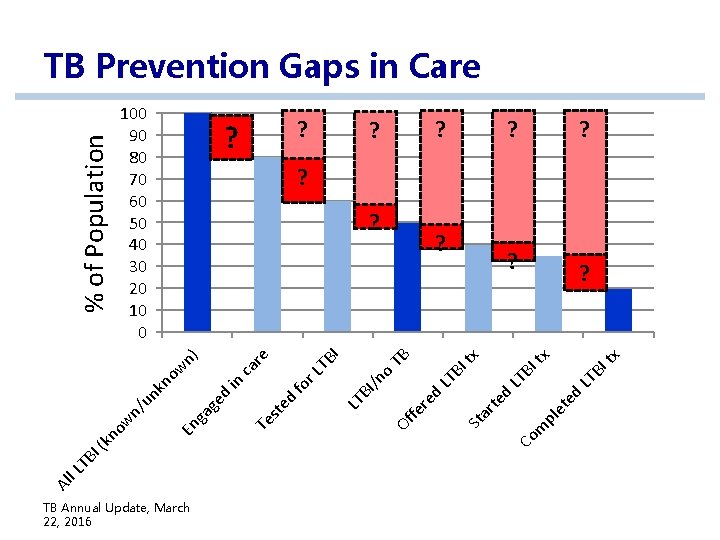
TB Annual Update, March 22, 2016 ed et pl x BI t LT tx ? m LT BI ? Co d te tx ? ar BI LT TB ? St re d fe o ? Of /n I TB r. L fo ca re ? LT BI d te in n) ow % of Population 100 90 80 70 60 50 40 30 20 10 0 Te s ed ag En g kn un n/ w kn o TB I( l. L Al TB Prevention Gaps in Care ? ? ?
Theme for TBESC Part B! TB Annual Update, March 22, 2016
ed pl et LT d d St Co m ar te re fe Of tx x BI t BI LT o LT BI /n fo ed Te st tx TB I TB r. L ca in d ga ge Al l. L TB En I( kn ow n/ un re . . . % of Population 100 80 60 40 20 0 LTBI services. Health Dept TB Clinics X X X LTBI services – Other Clinics X X X Modeling existing data (census, ACS, BRFSS, TBESC, etc. ) X
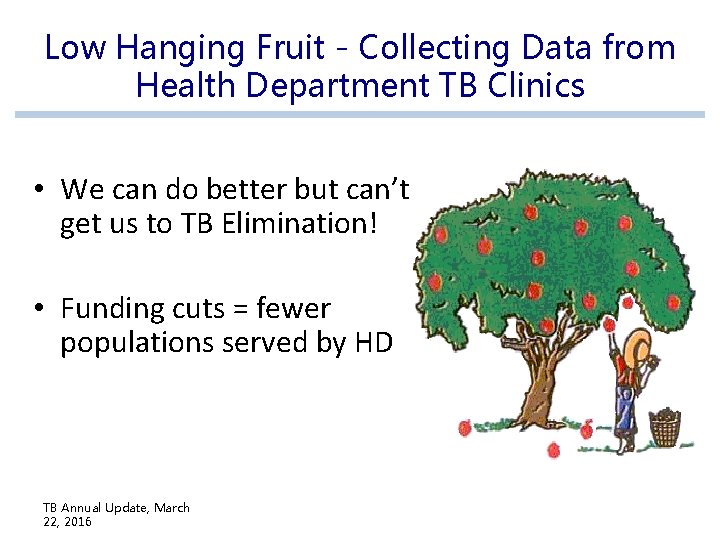
Low Hanging Fruit - Collecting Data from Health Department TB Clinics • We can do better but can’t get us to TB Elimination! • Funding cuts = fewer populations served by HD TB Annual Update, March 22, 2016
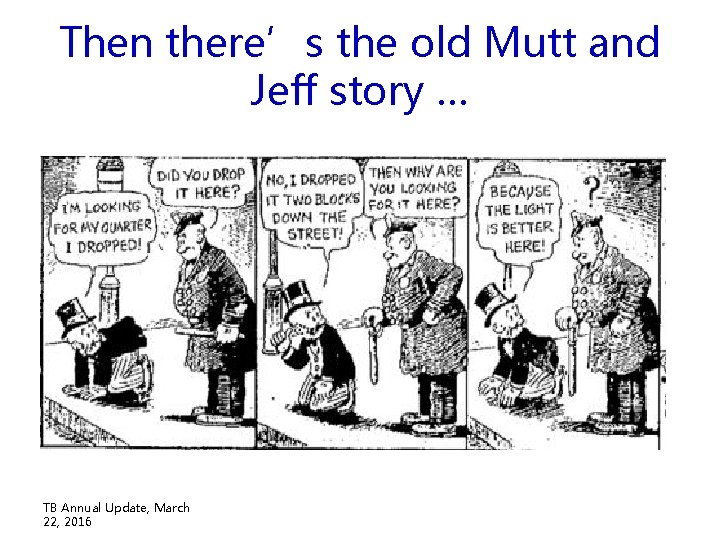
Then there’s the old Mutt and Jeff story … TB Annual Update, March 22, 2016
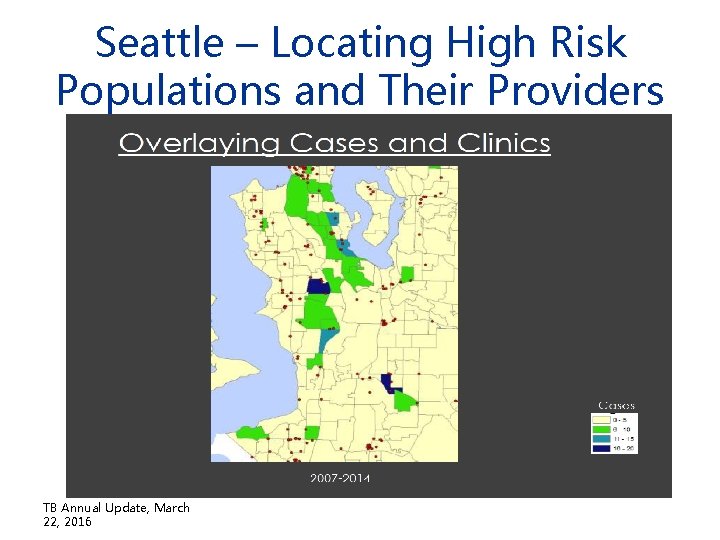
Challenges to TB Elimination • We don’t know much about the ‘at risk’ populations – WHO, WHERE, HOW MANY? • We don’t know who IS and IS NOT, receiving TB services outside the health department • We don’t know WHICH and WHERE FOR nonhealth department providers that serve ‘atrisk’ populations of interest TB Annual Update, March 22, 2016
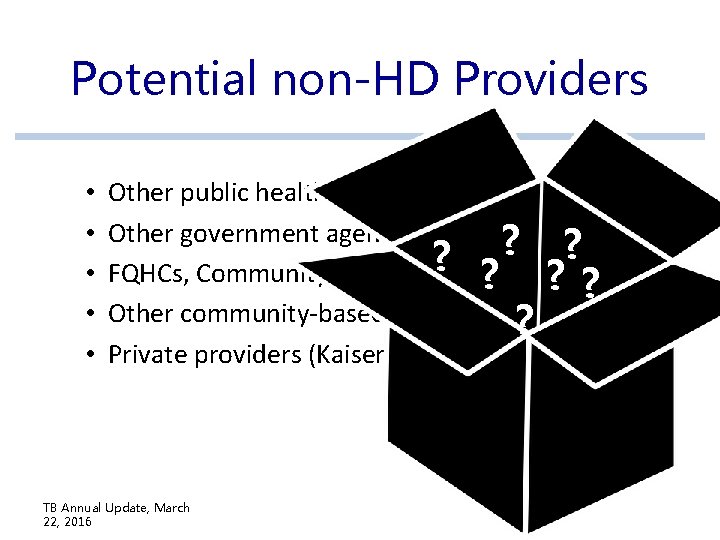
Potential non-HD Providers • • • Other public health clinics Other government agencies (corrections) ? ? ? FQHCs, Community Health Centers ? ? ? Other community-based organizations ? Private providers (Kaiser, universities, etc. ) TB Annual Update, March 22, 2016
Seattle – Locating High Risk Populations and Their Providers TB Annual Update, March 22, 2016
Questions?