Lesson 3 Mia Is Growing Like a Weed


- Slides: 48
Lesson 3: Mia Is Growing Like a Weed
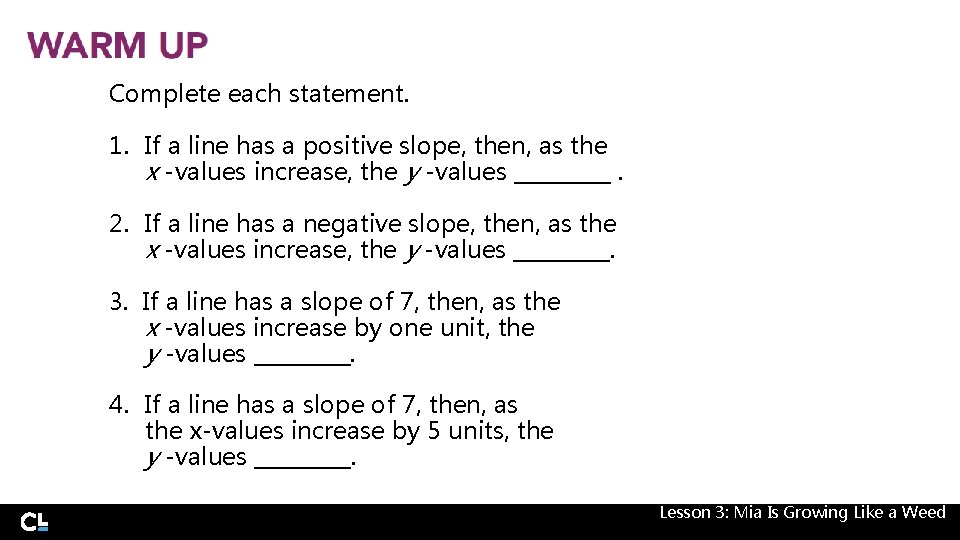
Complete each statement. 1. If a line has a positive slope, then, as the x -values increase, the y -values _____. 2. If a line has a negative slope, then, as the x -values increase, the y -values _____. 3. If a line has a slope of 7, then, as the x -values increase by one unit, the y -values _____. 4. If a line has a slope of 7, then, as the x-values increase by 5 units, the y -values _____. Lesson 3: Mia Is Growing Like a Weed
LEARNING GOALS • Draw a line of best fit. • Write and interpret an equation of a line of best fit. • Use the equation of a line of best fit to make predictions and solve problems in the context of bivariate data, interpreting slope and intercept. • Assess the fit of a linear model. Lesson 3: Mia Is Growing Like a Weed
You have used lines of best fit to make predictions. How can you use interpolation and extrapolation to make predictions over time? Lesson 3: Mia Is Growing Like a Weed
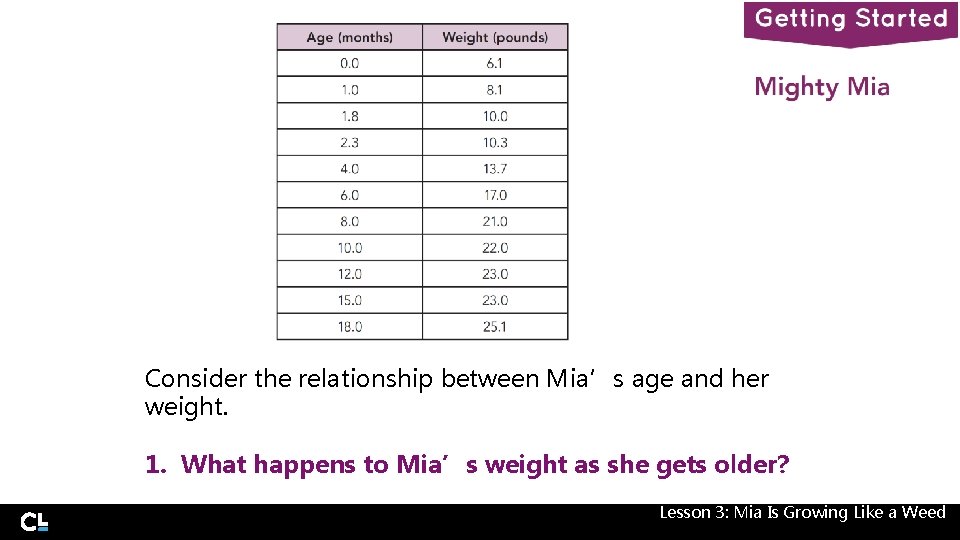
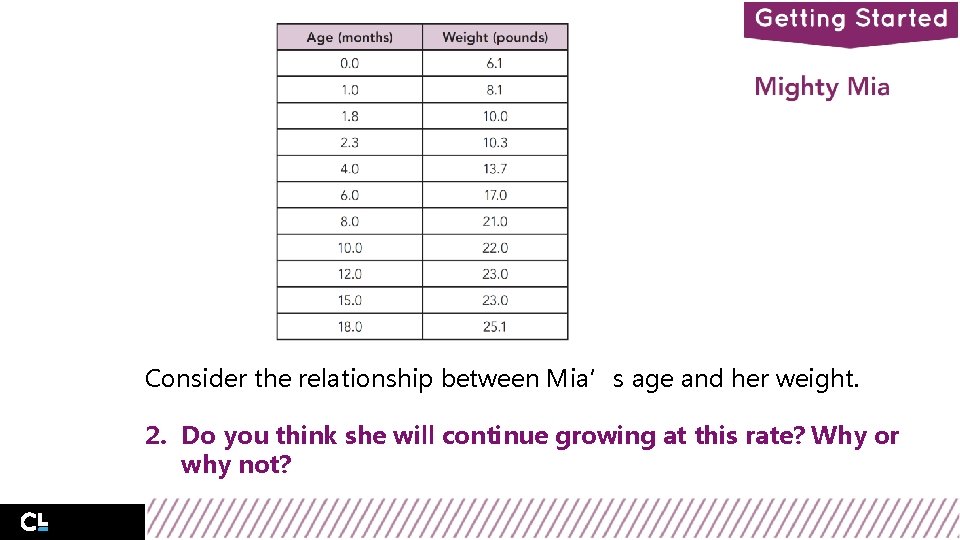
Mia was born a healthy, happy baby girl to the Sanchez family. At each doctor’s visit, Mia’s height and weight were recorded. Her records from birth until she was 18 months old are shown in the table. Lesson 3: Mia Is Growing Like a Weed
Consider the relationship between Mia’s age and her weight. 1. What happens to Mia’s weight as she gets older? Lesson 3: Mia Is Growing Like a Weed
Consider the relationship between Mia’s age and her weight. 2. Do you think she will continue growing at this rate? Why or why not? Lesson 3: Mia Is Growing Like a Weed
Use the information about Mia’s age and weight to answer each question. Lesson 3: Mia Is Growing Like a Weed
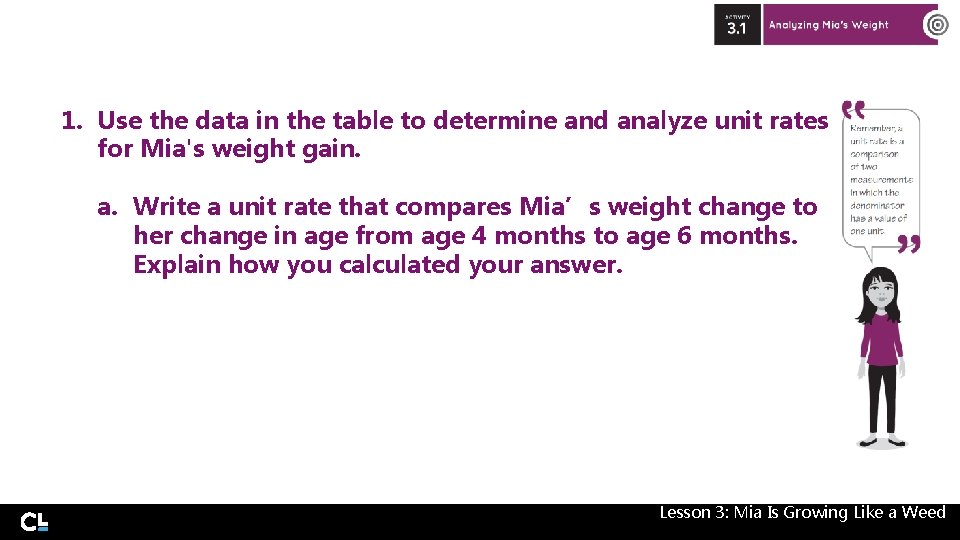
1. Use the data in the table to determine and analyze unit rates for Mia's weight gain. a. Write a unit rate that compares Mia’s weight change to her change in age from age 4 months to age 6 months. Explain how you calculated your answer. Lesson 3: Mia Is Growing Like a Weed
1. Use the data in the table to determine and analyze unit rates for Mia's weight gain. b. Write a unit rate that compares Mia’s weight change to her change in age from 6 months to 8 months. Explain how you calculated your answer. Lesson 3: Mia Is Growing Like a Weed
1. Use the data in the table to determine and analyze unit rates for Mia's weight gain. c. Was Mia gaining weight faster from 4 months to 6 months, or from 6 months to 8 months? Explain your reasoning. Lesson 3: Mia Is Growing Like a Weed
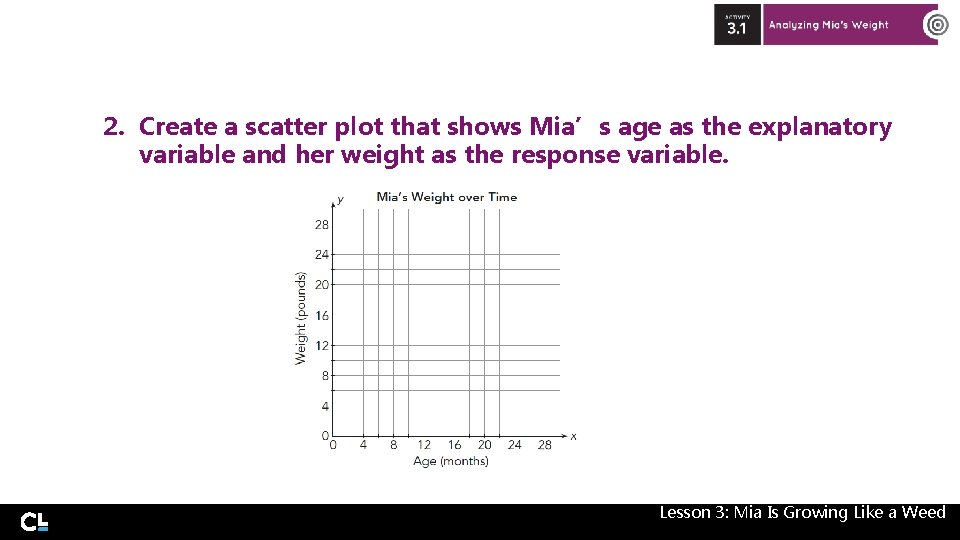
2. Create a scatter plot that shows Mia’s age as the explanatory variable and her weight as the response variable. Lesson 3: Mia Is Growing Like a Weed
3. Do all the points in your scatter plot lie on the same line? What does this tell you about Mia’s weight change as time changes? Explain your reasoning. Lesson 3: Mia Is Growing Like a Weed
4. Use a straightedge to draw the line that best fits the data on the graph. Lesson 3: Mia Is Growing Like a Weed
5. Write the equation of your line. Be sure to define your variables and include the units. Identify the slope and y-intercept of your line. Lesson 3: Mia Is Growing Like a Weed
6. Use the equation of your line to answer each question. Explain how you determined your answers. a. Approximately how many pounds did Mia gain each month from the time she was born until she was 18 months old? Lesson 3: Mia Is Growing Like a Weed
6. Use the equation of your line to answer each question. Explain how you determined your answers. b. Approximately how many pounds did Mia weigh at birth? Lesson 3: Mia Is Growing Like a Weed
7. Predict Mia's weight at each given age if she continues to grow at the same rate. Then analyze your predictions. a. 2 years old Lesson 3: Mia Is Growing Like a Weed
7. Predict Mia's weight at each given age if she continues to grow at the same rate. Then analyze your predictions. b. 5 years old Lesson 3: Mia Is Growing Like a Weed
7. Predict Mia's weight at each given age if she continues to grow at the same rate. Then analyze your predictions. c. 18 years old Lesson 3: Mia Is Growing Like a Weed
7. Predict Mia's weight at each given age if she continues to grow at the same rate. Then analyze your predictions. d. Do all your predictions make sense? Explain your reasoning. Lesson 3: Mia Is Growing Like a Weed
8. What can you conclude about the accuracy of your model? Lesson 3: Mia Is Growing Like a Weed
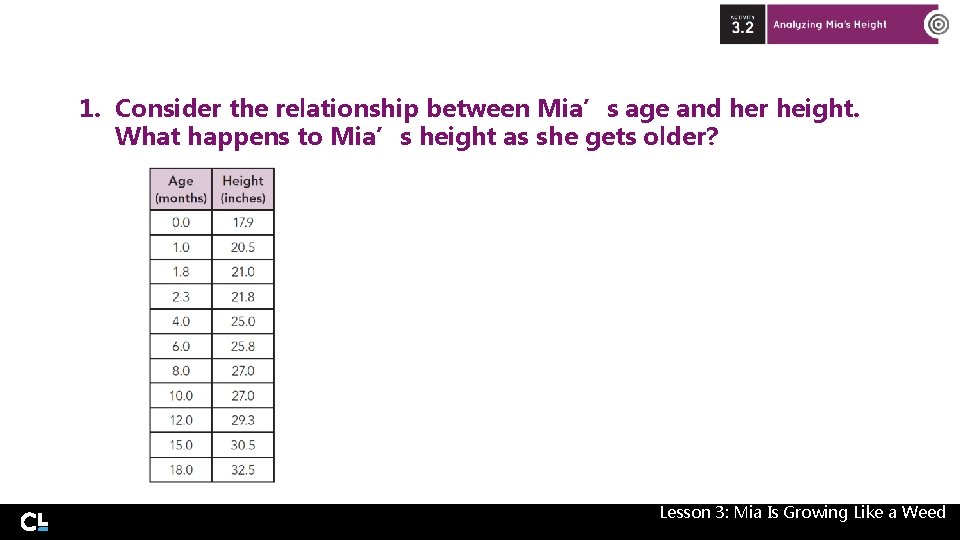
Analyze the table shown with the data of Mia’s age and her height. Lesson 3: Mia Is Growing Like a Weed
1. Consider the relationship between Mia’s age and her height. What happens to Mia’s height as she gets older? Lesson 3: Mia Is Growing Like a Weed
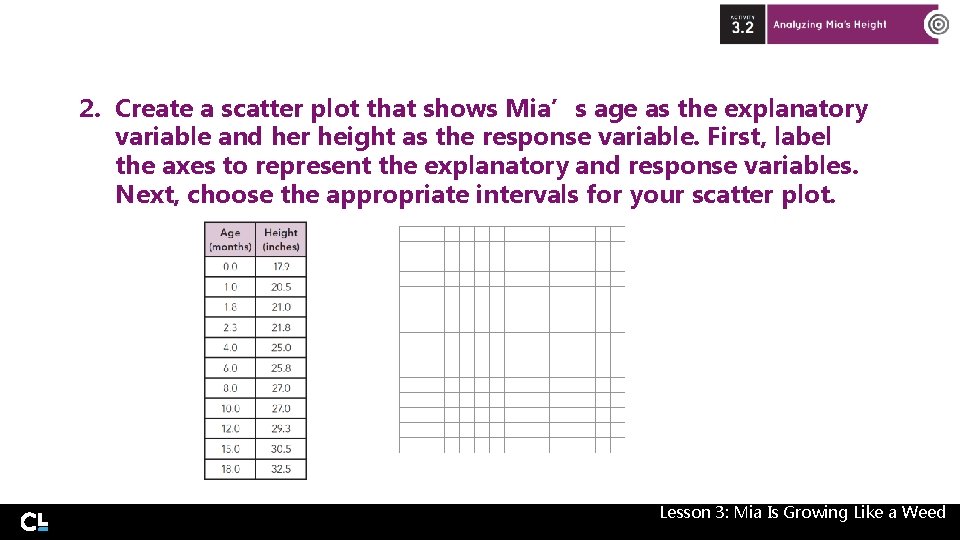
2. Create a scatter plot that shows Mia’s age as the explanatory variable and her height as the response variable. First, label the axes to represent the explanatory and response variables. Next, choose the appropriate intervals for your scatter plot. Lesson 3: Mia Is Growing Like a Weed
3. Can these data be exactly represented by a linear equation? Explain your reasoning. Lesson 3: Mia Is Growing Like a Weed
4. Use a straightedge to draw the line that best fits your data on your graph. Then, write the equation of your line. Be sure to define your variables and include the units. Lesson 3: Mia Is Growing Like a Weed
5. Interpret the slope and y-intercept of your line in terms of Mia’s height. Lesson 3: Mia Is Growing Like a Weed
6. Predict Mia’s height at each given age if she continues to grow at the same rate. Then analyze your predictions. a. 2 years old Lesson 3: Mia Is Growing Like a Weed
6. Predict Mia’s height at each given age if she continues to grow at the same rate. Then analyze your predictions. b. 5 years old Lesson 3: Mia Is Growing Like a Weed
6. Predict Mia’s height at each given age if she continues to grow at the same rate. Then analyze your predictions. c. 18 years old Lesson 3: Mia Is Growing Like a Weed
6. Predict Mia’s height at each given age if she continues to grow at the same rate. Then analyze your predictions. d. Do all of your predictions make sense? Explain your reasoning. Lesson 3: Mia Is Growing Like a Weed
7. What can you conclude about the accuracy of your model? Lesson 3: Mia Is Growing Like a Weed
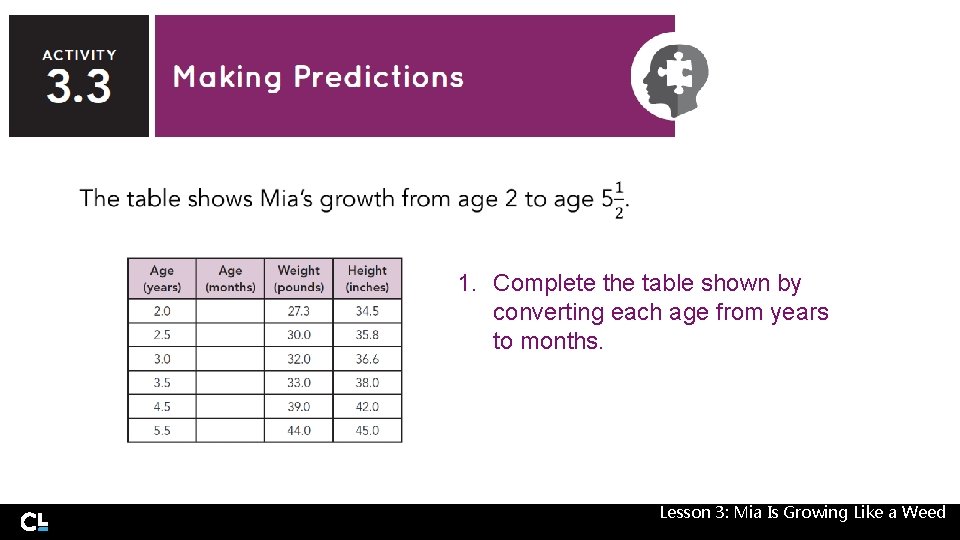
1. Complete the table shown by converting each age from years to months. Lesson 3: Mia Is Growing Like a Weed
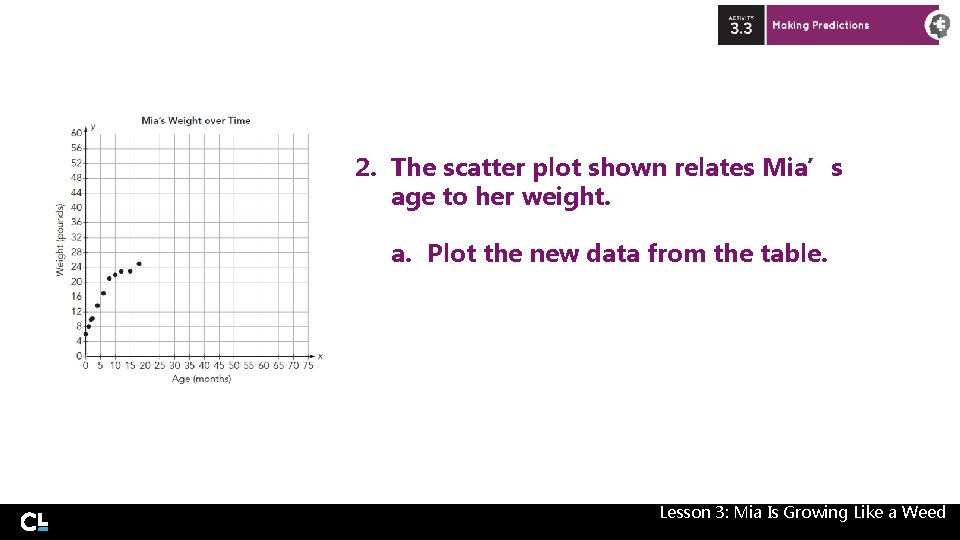
2. The scatter plot shown relates Mia’s age to her weight. a. Plot the new data from the table. Lesson 3: Mia Is Growing Like a Weed
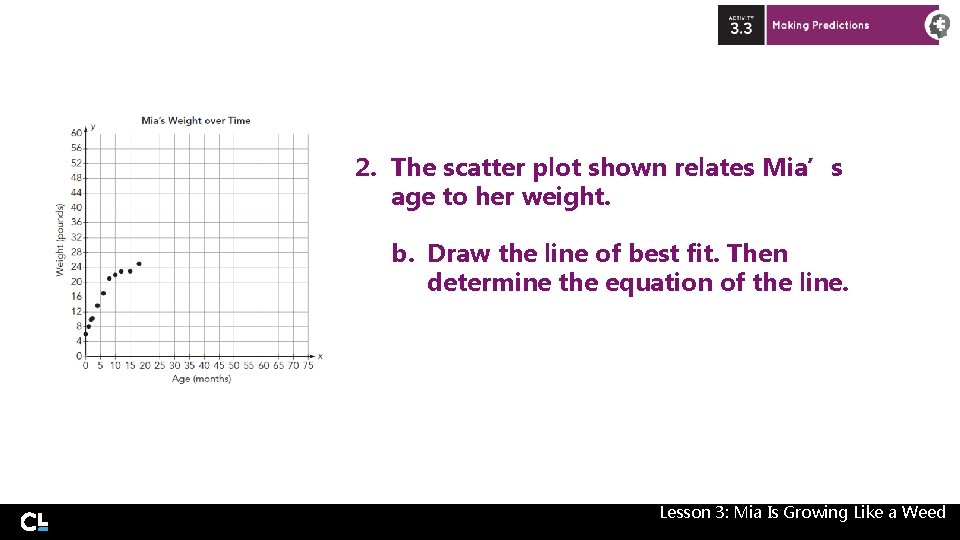
2. The scatter plot shown relates Mia’s age to her weight. b. Draw the line of best fit. Then determine the equation of the line. Lesson 3: Mia Is Growing Like a Weed
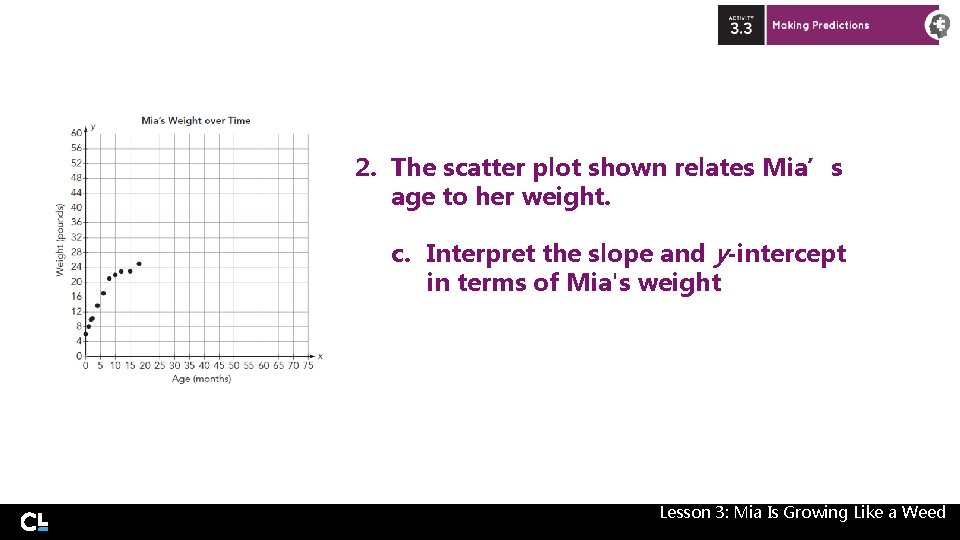
2. The scatter plot shown relates Mia’s age to her weight. c. Interpret the slope and y-intercept in terms of Mia's weight Lesson 3: Mia Is Growing Like a Weed
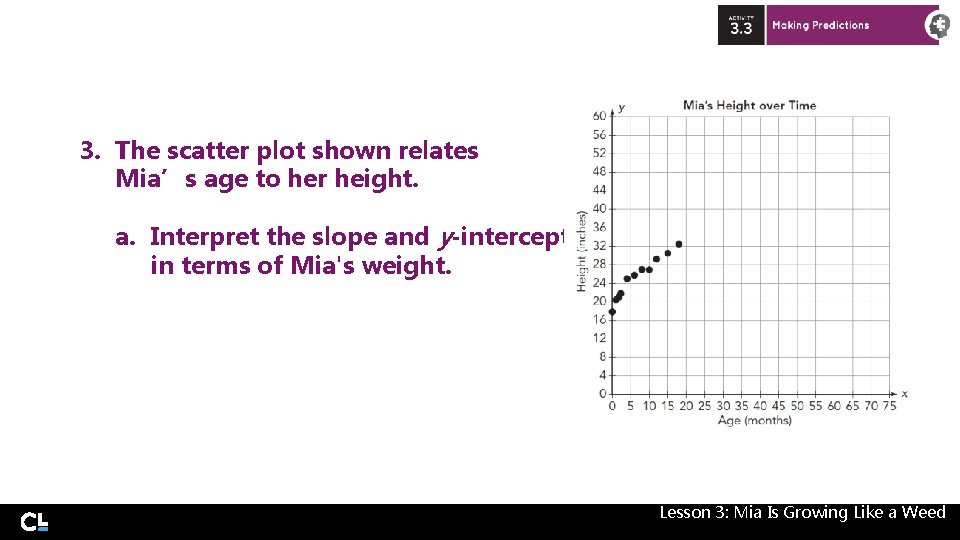
3. The scatter plot shown relates Mia’s age to her height. a. Interpret the slope and y-intercept in terms of Mia's weight. Lesson 3: Mia Is Growing Like a Weed
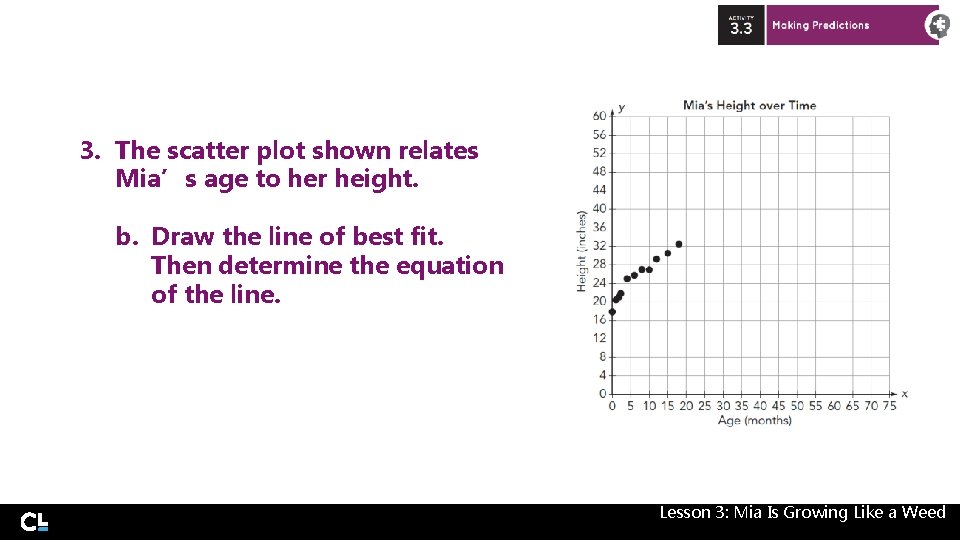
3. The scatter plot shown relates Mia’s age to her height. b. Draw the line of best fit. Then determine the equation of the line. Lesson 3: Mia Is Growing Like a Weed
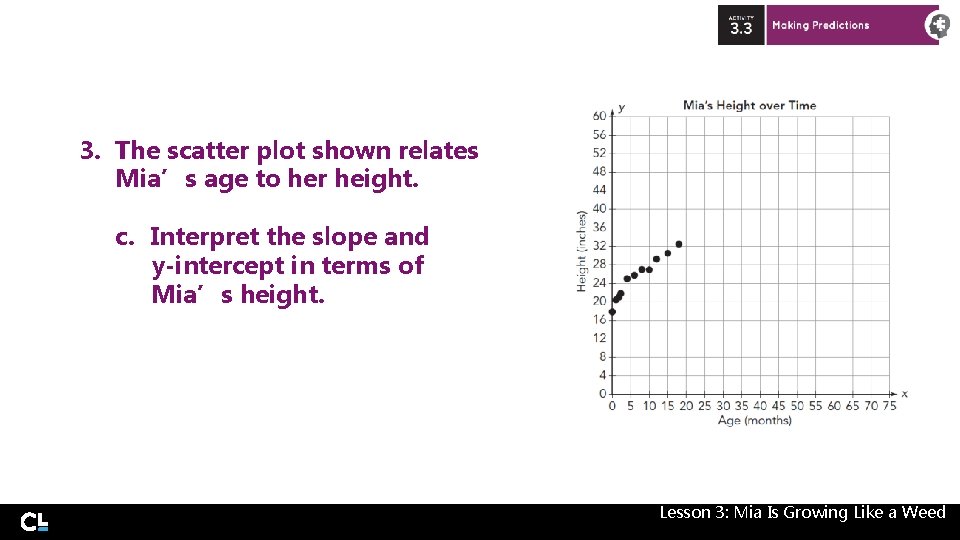
3. The scatter plot shown relates Mia’s age to her height. c. Interpret the slope and y-intercept in terms of Mia’s height. Lesson 3: Mia Is Growing Like a Weed
4. Use your new lines of best fit to determine Mia’s height and weight when she is 18 years old. Lesson 3: Mia Is Growing Like a Weed
5. How do these predictions compare to your previous predictions? Are these predictions reasonable? Explain your reasoning. Lesson 3: Mia Is Growing Like a Weed
6. Do you think that extending the lines of best fit for Mia’s weight and height over time helped to make predictions about her weight and height beyond 6 years? Lesson 3: Mia Is Growing Like a Weed
7. Propose a strategy for developing more accurate models for Mia’s height and weight over time. Lesson 3: Mia Is Growing Like a Weed
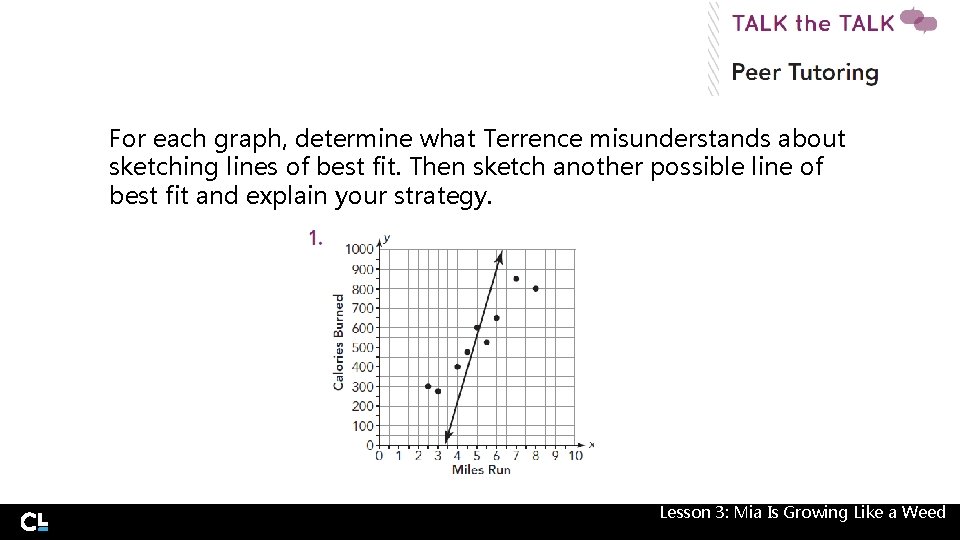
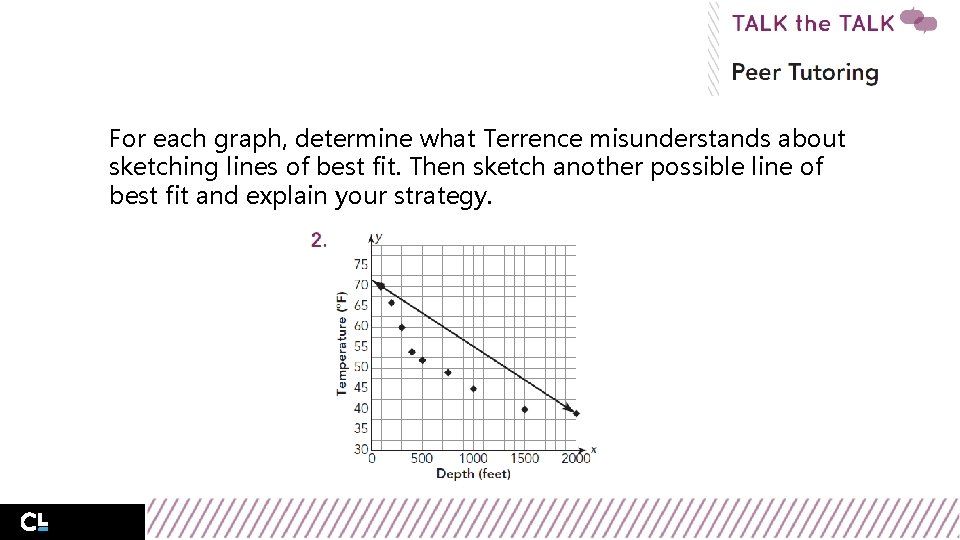
Your classroom partner, Terrence, was absent when you learned about drawing appropriate lines of best fit. After he completed a make-up assignment on sketching lines of best fit, Terrence asked you to double-check his work. Lesson 3: Mia Is Growing Like a Weed
For each graph, determine what Terrence misunderstands about sketching lines of best fit. Then sketch another possible line of best fit and explain your strategy. Lesson 3: Mia Is Growing Like a Weed
For each graph, determine what Terrence misunderstands about sketching lines of best fit. Then sketch another possible line of best fit and explain your strategy. Lesson 3: Mia Is Growing Like a Weed