Lecture Outlines Chapter 8 Human Population WithgottLaposata Fifth


- Slides: 77
Lecture Outlines Chapter 8 Human Population Withgott/Laposata Fifth Edition © 2014 Pearson Education, Inc.
This lecture will help you understand: § Human population growth § Different viewpoints on this growth § Population, affluence, and technology’s effects § Demography § Demographic transition § Factors affecting population growth § The HIV/AIDS epidemic § Population and sustainable development © 2014 Pearson Education, Inc.
© 2014 Pearson Education, Inc.
Central Case Study: China’s One-Child Policy § In 1970, China’s 790 million people were exhausting their resources and faced starvation if growth continued § The government instituted a one-child policy § The growth rate plummeted § The policy is now less strict § The successful program has had unintended consequences § Killing of female infants and an imbalance in male to female ratios § Increasing number of elderly and fewer young people in the workforce © 2014 Pearson Education, Inc.
© 2014 Pearson Education, Inc.
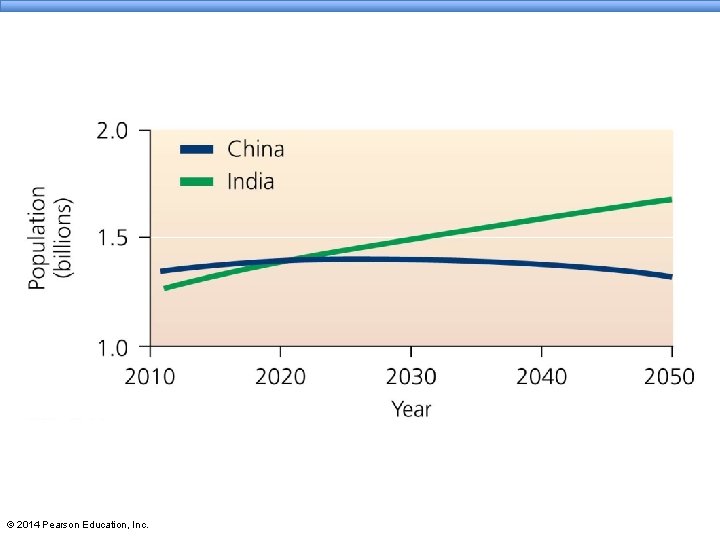
Our World at Seven Billion § Populations continue to rise in most countries, particularly in poverty-stricken developing nations § Growth in poorer nations leads to stresses on society, the environment, and people’s well-being § China’s stringent policies have greatly slowed growth there, but other countries may wish to slow their growth without the measures used by China § India’s growth continues and if not changed will surpass China’s population It would take 30 years, counting once each second, to count to a billion! It would take 210 years to count to 7 billion! © 2014 Pearson Education, Inc.
© 2014 Pearson Education, Inc.
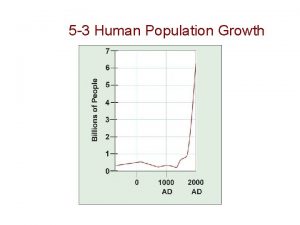
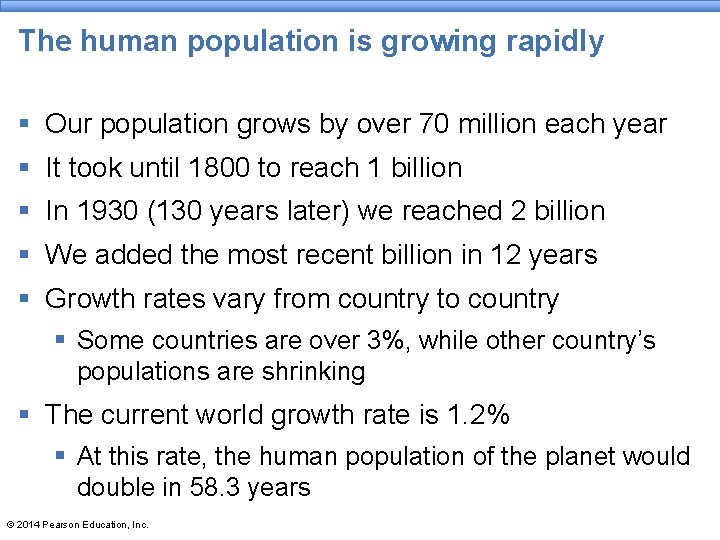
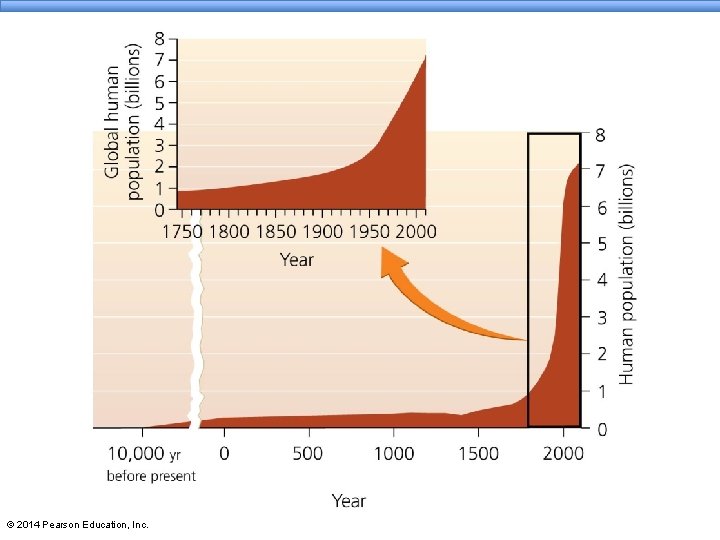
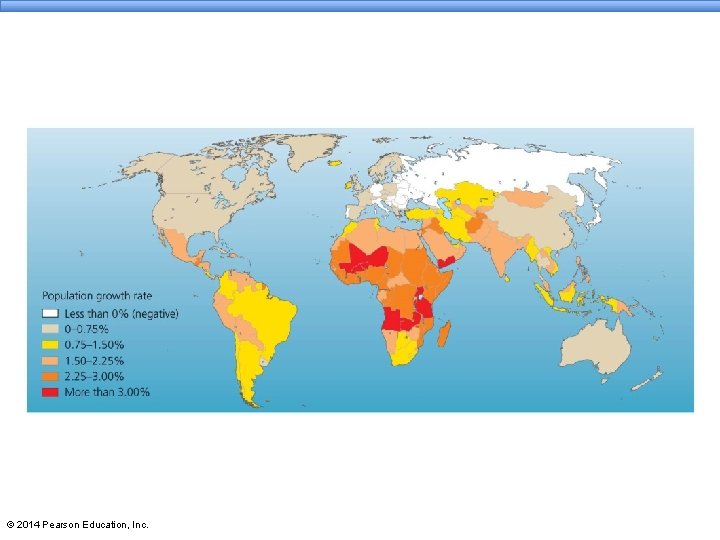
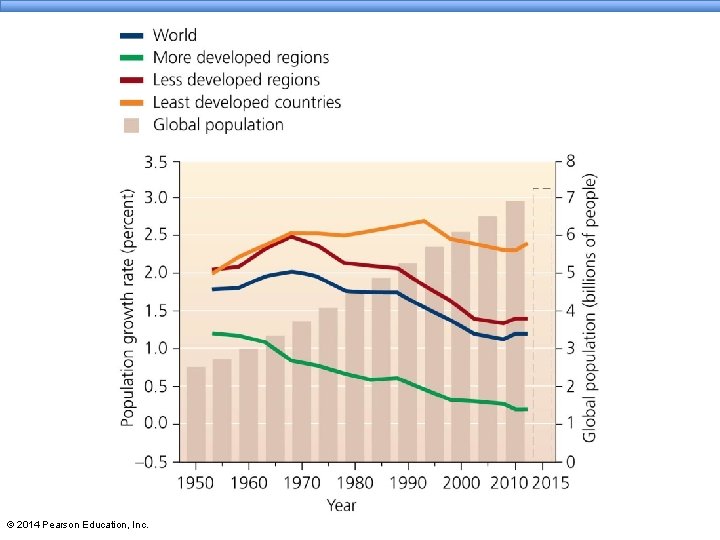
The human population is growing rapidly § Our population grows by over 70 million each year § It took until 1800 to reach 1 billion § In 1930 (130 years later) we reached 2 billion § We added the most recent billion in 12 years § Growth rates vary from country to country § Some countries are over 3%, while other country’s populations are shrinking § The current world growth rate is 1. 2% § At this rate, the human population of the planet would double in 58. 3 years © 2014 Pearson Education, Inc.
© 2014 Pearson Education, Inc.
© 2014 Pearson Education, Inc.
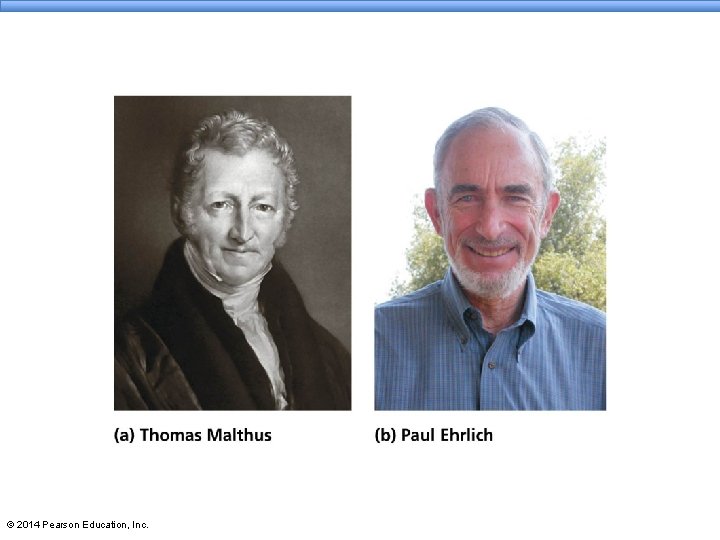
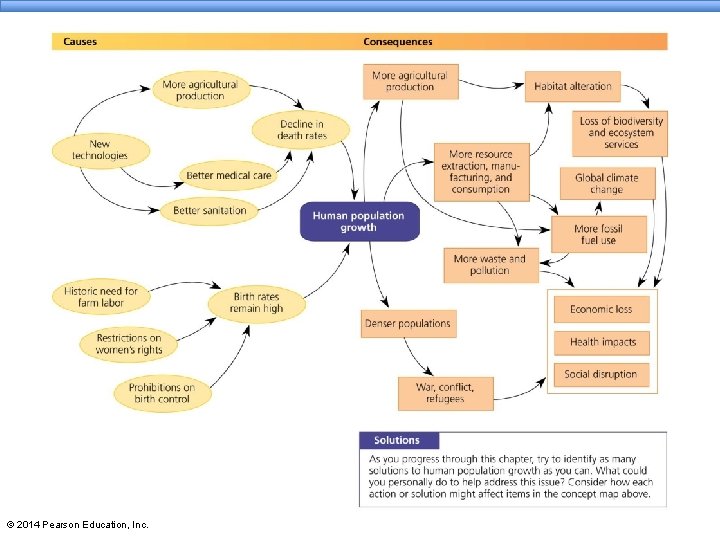
Is population growth a problem? § Better technology, sanitation, medication, and increased food supply have increased growth § Death rates drop, but not birth rates § Infant mortality rate = the death rate in children; has dropped dramatically § Population growth was seen as good § Support for elderly, a larger labor pool § Thomas Malthus’s An Essay on the Principles of Population (1798) § Humans will outstrip food supplies § War, disease, starvation reduce populations © 2014 Pearson Education, Inc.
© 2014 Pearson Education, Inc.
Is population growth a problem? § Neo-Malthusians: population growth will increase faster than food production; cause famine and conflict § Paul Ehrlich’s Population Bomb (1968) predicted that civilization would end by the end of the 20 th century § Intensified food production fed more people § Cornucopians argue that we will continue to find new resources and technology to support people § Environmental scientists argue that there are finite resources § Land is limited, extinct species are gone forever § Quality of life will suffer with unchecked growth § Less space, food, wealth person © 2014 Pearson Education, Inc.
© 2014 Pearson Education, Inc.
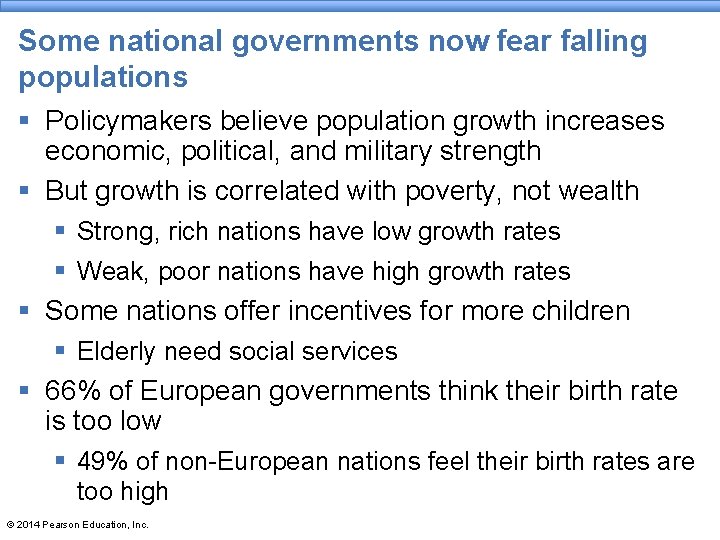
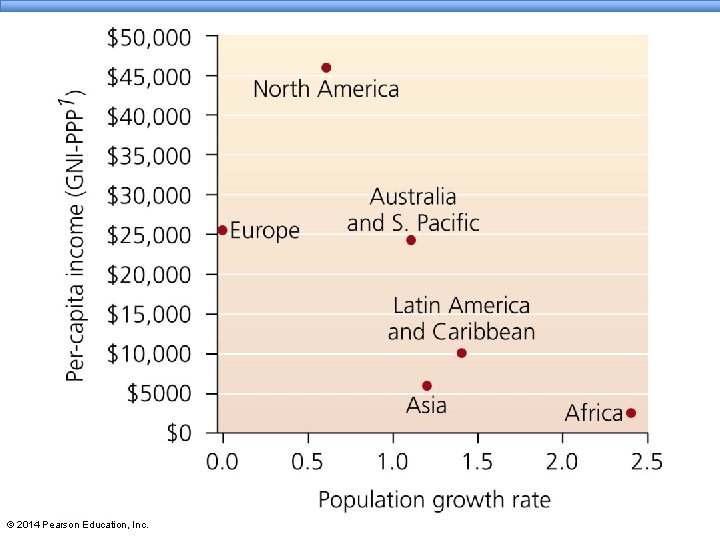
Some national governments now fear falling populations § Policymakers believe population growth increases economic, political, and military strength § But growth is correlated with poverty, not wealth § Strong, rich nations have low growth rates § Weak, poor nations have high growth rates § Some nations offer incentives for more children § Elderly need social services § 66% of European governments think their birth rate is too low § 49% of non-European nations feel their birth rates are too high © 2014 Pearson Education, Inc.
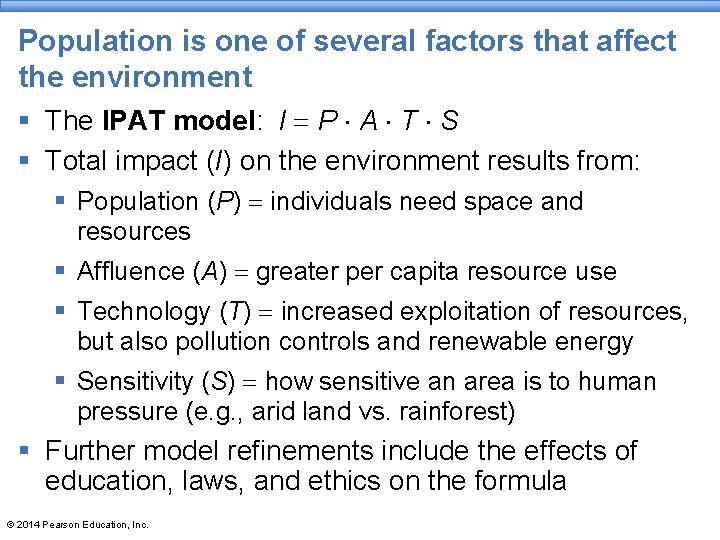
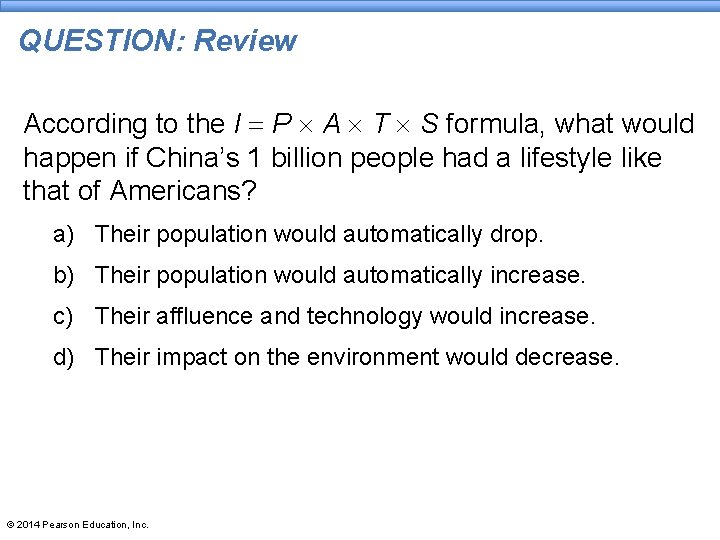
Population is one of several factors that affect the environment § The IPAT model: I = P × A × T × S § Total impact (I) on the environment results from: § Population (P) = individuals need space and resources § Affluence (A) = greater per capita resource use § Technology (T) = increased exploitation of resources, but also pollution controls and renewable energy § Sensitivity (S) = how sensitive an area is to human pressure (e. g. , arid land vs. rainforest) § Further model refinements include the effects of education, laws, and ethics on the formula © 2014 Pearson Education, Inc.
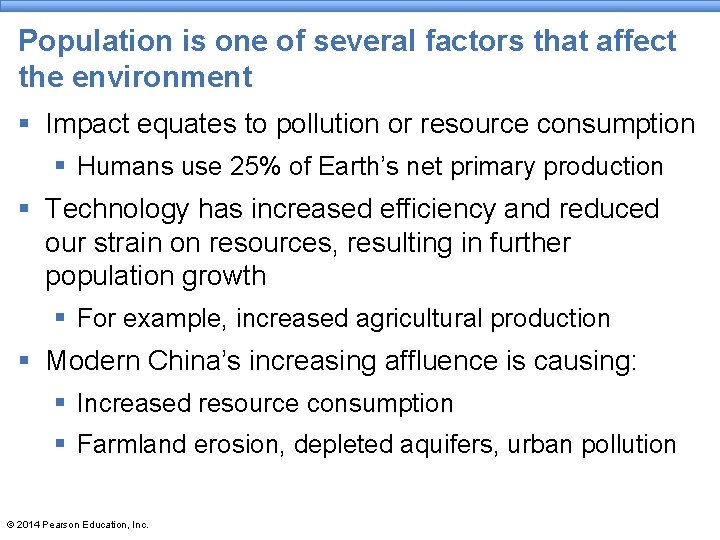
Population is one of several factors that affect the environment § Impact equates to pollution or resource consumption § Humans use 25% of Earth’s net primary production § Technology has increased efficiency and reduced our strain on resources, resulting in further population growth § For example, increased agricultural production § Modern China’s increasing affluence is causing: § Increased resource consumption § Farmland erosion, depleted aquifers, urban pollution © 2014 Pearson Education, Inc.
Modeling Population Growth— Human Population Growth and Regulation 2 Right-click/Select Play © 2014 Pearson Education, Inc.
Modeling Population Growth— Human Population Growth and Regulation 1 Right-click/Select Play © 2014 Pearson Education, Inc.
Demography § Demography = the application of population ecology to the study of change in human populations § All population principles apply to humans § Environmental factors limit population growth § There is a carrying capacity for all species, including humans § Humans raise the environment’s carrying capacity through technology § How many humans can the world sustain? § 1 billion to 33 billion: prosperity to abject poverty § Population growth can’t continue forever © 2014 Pearson Education, Inc.
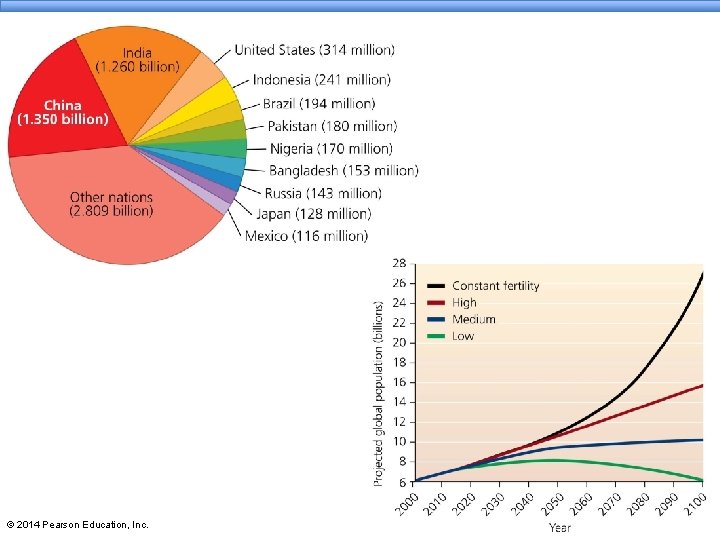
Demography is the study of human population § Demographers study: § Population size § Density and distribution § Age structure § Sex ratio § Birth, death, immigration, and emigration rates § Population size § Current world population is just over 7 billion § Estimated to grow to over 9 billion by 2015 © 2014 Pearson Education, Inc.
© 2014 Pearson Education, Inc.
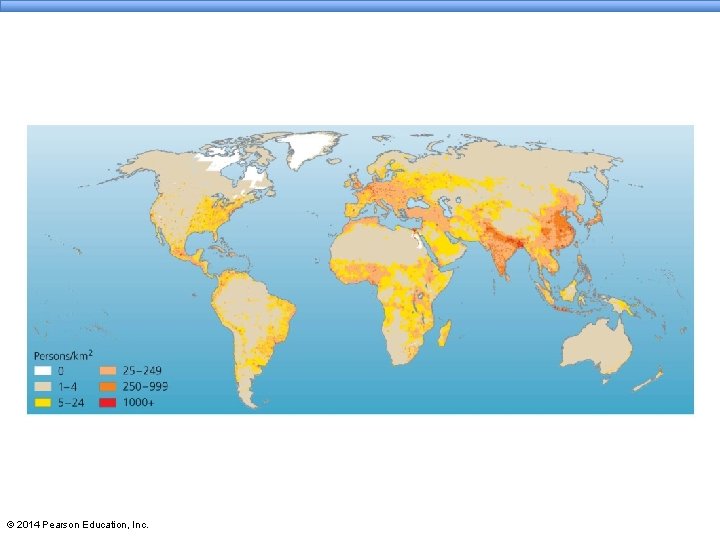
Population density and distribution § Population size alone does not tell whole story § People are not distributed equally over the planet (clumped distribution) § Highest density: temperate, subtropical, tropical biomes and close to water § Cities are local high-density areas § Lowest density: away from water, extreme environments § Increased density impacts the environment © 2014 Pearson Education, Inc.
© 2014 Pearson Education, Inc.
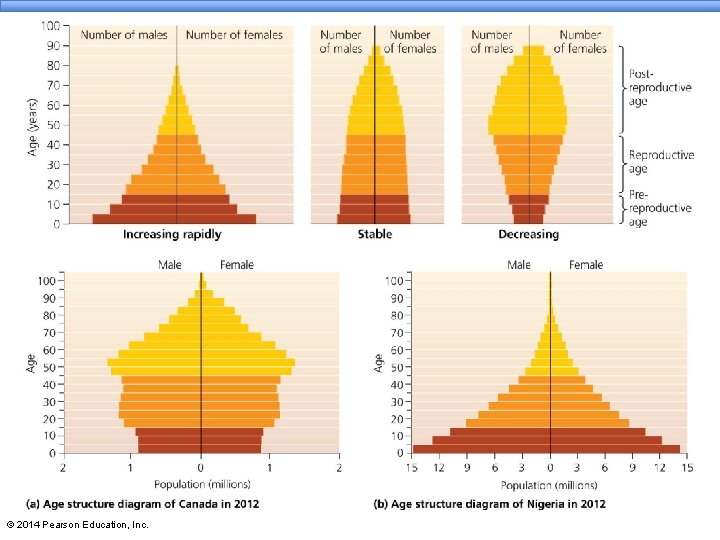
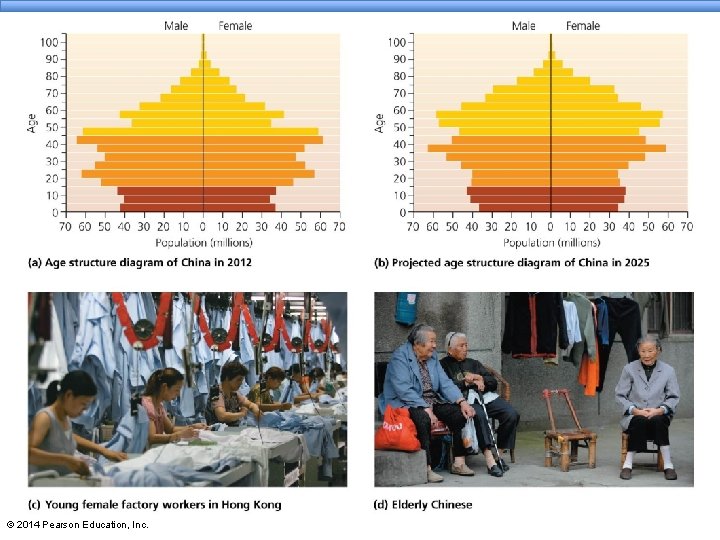
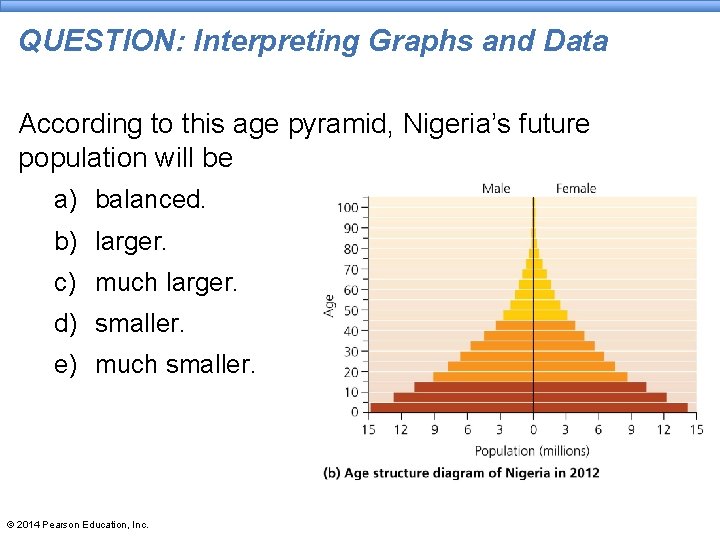
Age structure § Age structure describes the relative numbers in each age class within a population § Age structure diagrams (population pyramids) show age structure § Wide base denotes many young § High reproduction, rapid population growth § Even age distribution: remains stable as births keep pace with deaths § Narrow base denotes fewer young than old § Population will likely decline over time © 2014 Pearson Education, Inc.
© 2014 Pearson Education, Inc.
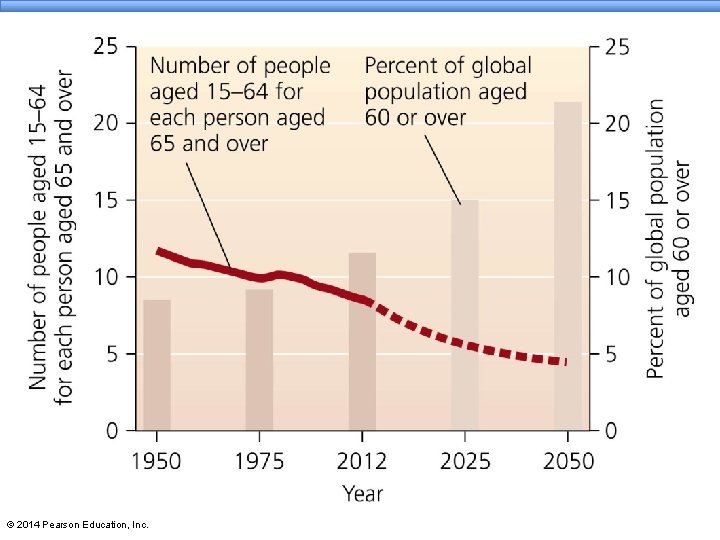
Age structure § Many populations are getting older § Median global age today is 28, but it will be 38 by 2050 § The elderly will need care and financial assistance § Taxes will increase for Social Security and Medicare § But fewer dependent children may mean lower crime rates, and the elderly can remain productive © 2014 Pearson Education, Inc.
Age structure § China’s age structure is changing § In 1970, the median age was 20; by 2050 it will be 45 § By 2050, over 300 million will be over 65 § Fewer people will be working to support social programs to assist the elderly © 2014 Pearson Education, Inc.
© 2014 Pearson Education, Inc.
© 2014 Pearson Education, Inc.
Sex ratios § Unequal sex ratios can impact population growth § Human sex ratios at birth slightly favor males § For every 100 females born, 106 males are born § In China, 120 boys were reported for 100 girls § Culture values males over females § The government’s one-child policy § Females have been selectively aborted § The undesirable social consequences? § Many single Chinese men § Increased risk of HIV § Teenage girls are kidnapped and sold as brides © 2014 Pearson Education, Inc.
Population change results from birth, death, immigration, and emigration § Whether a population grows, shrinks, or remains stable depends on rates of birth, death, and migration § Birth and immigration add individuals § Death and emigration remove individuals § Technological advances caused decreased deaths § The increased gap between birth and death rates resulted in population expansion © 2014 Pearson Education, Inc.
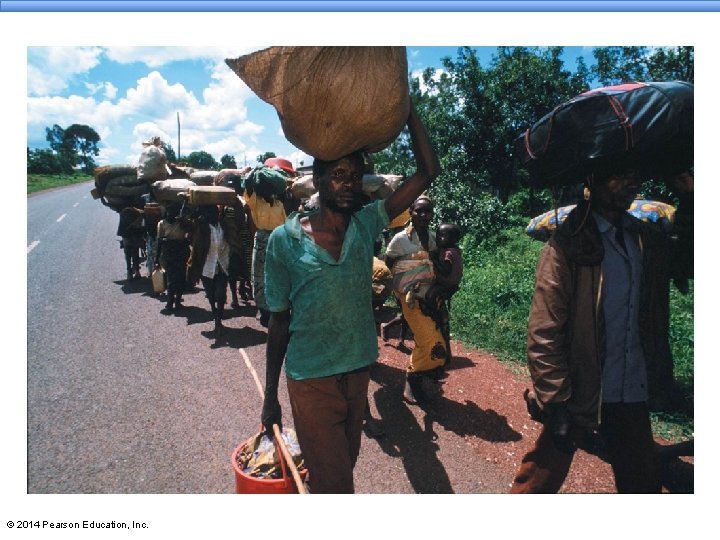
Population change results from birth, death, immigration, and emigration § Immigration/emigration have become more important § War, civil strife, and environmental degradation cause people to flee their homes § Each year, 25 million refugees escape poor environmental conditions § This movement causes environmental problems § No incentives to conserve resources § Overall global growth rate has declined in recent years § But world population continues to grow © 2014 Pearson Education, Inc.
© 2014 Pearson Education, Inc.
© 2014 Pearson Education, Inc.
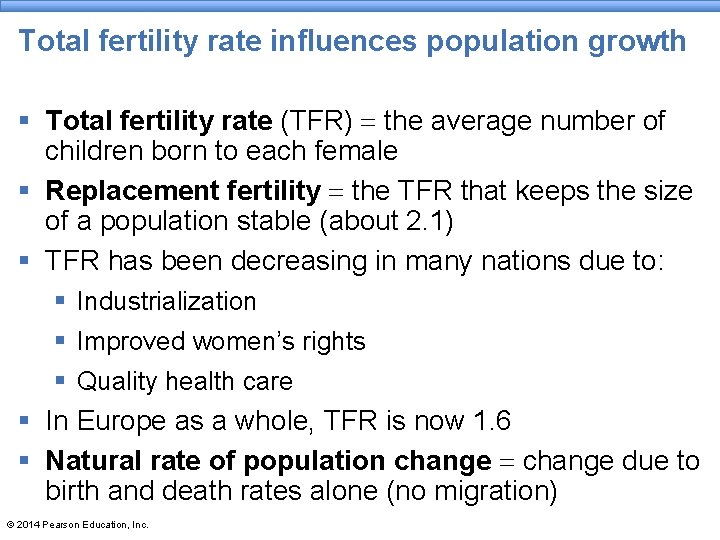
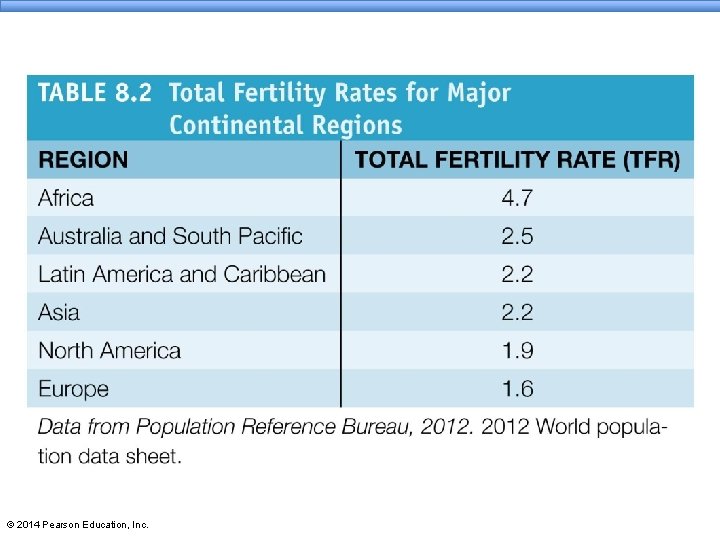
Total fertility rate influences population growth § Total fertility rate (TFR) = the average number of children born to each female § Replacement fertility = the TFR that keeps the size of a population stable (about 2. 1) § TFR has been decreasing in many nations due to: § Industrialization § Improved women’s rights § Quality health care § In Europe as a whole, TFR is now 1. 6 § Natural rate of population change = change due to birth and death rates alone (no migration) © 2014 Pearson Education, Inc.
© 2014 Pearson Education, Inc.
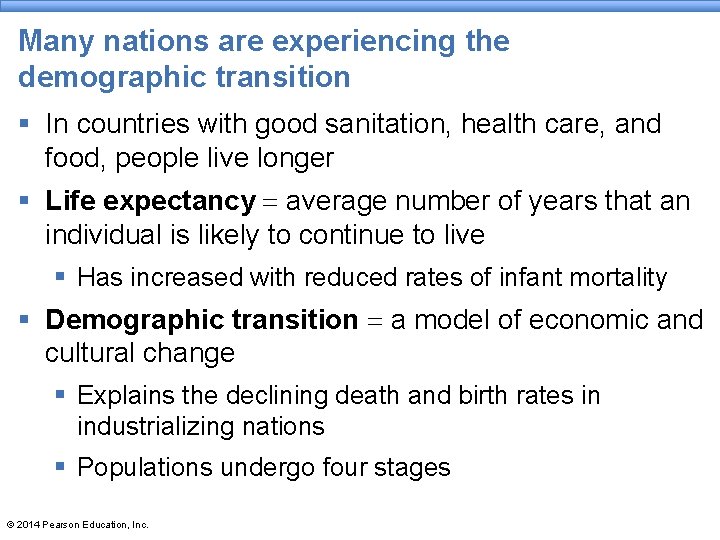
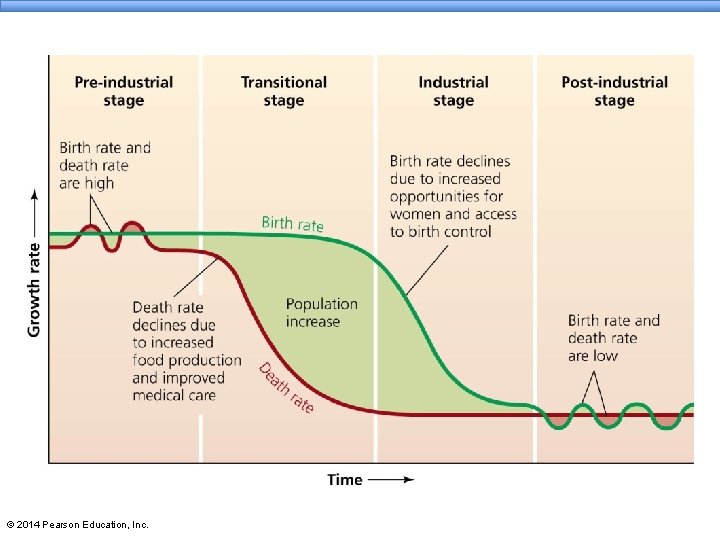
Many nations are experiencing the demographic transition § In countries with good sanitation, health care, and food, people live longer § Life expectancy = average number of years that an individual is likely to continue to live § Has increased with reduced rates of infant mortality § Demographic transition = a model of economic and cultural change § Explains the declining death and birth rates in industrializing nations § Populations undergo four stages © 2014 Pearson Education, Inc.
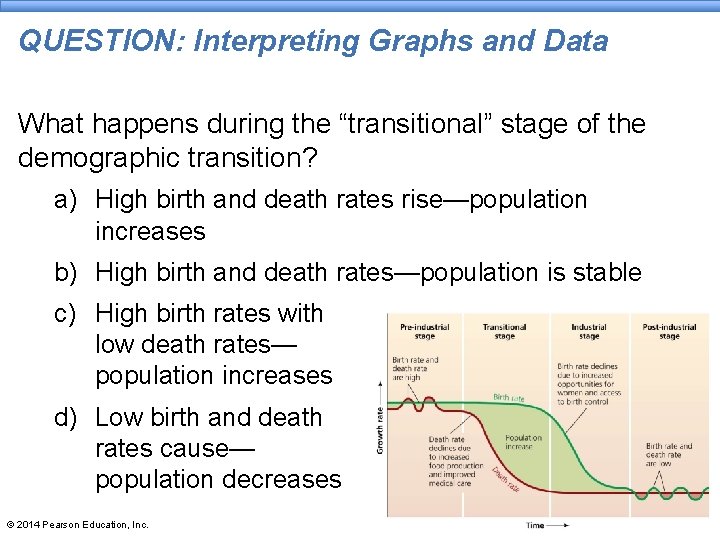
Many nations are experiencing the demographic transition § Pre-industrial stage = in pre-industrial societies, both birth and death rates are high § High birth rate to compensate for high infant mortality § Population growth is slow § Transitional stage = declining death rates due to increased food production and medical care § Birth rates remain high since people are not used to the low infant mortality rates § Population grows quickly © 2014 Pearson Education, Inc.
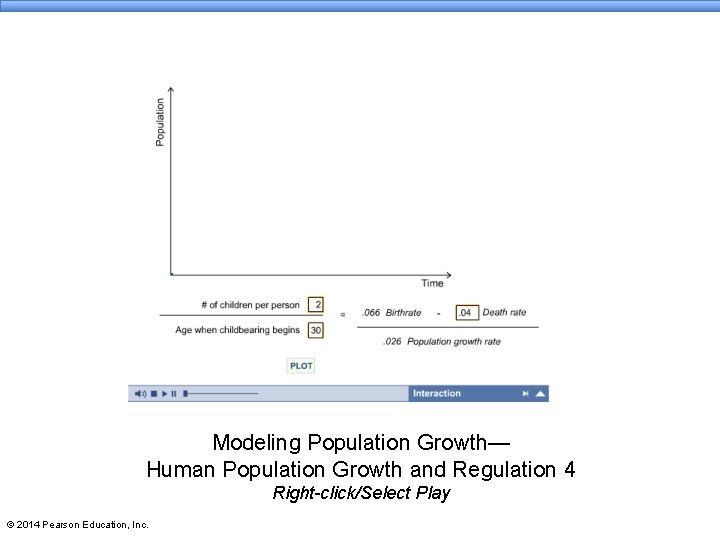
Modeling Population Growth— Human Population Growth and Regulation 4 Right-click/Select Play © 2014 Pearson Education, Inc.
Many nations are experiencing the demographic transition § Industrial stage = birth rates fall as jobs provide opportunities for women outside the home and children are not needed in the workforce § Difference between birth and death rates shrinks § Population growth slows § Post-industrial stage = birth and death rates are low and stable § Population stabilizes or even shrinks © 2014 Pearson Education, Inc.
© 2014 Pearson Education, Inc.
Is the demographic transition a universal process? § It has occurred in Europe, the U. S. , Canada, Japan, and other nations over the past 200– 300 years § But it may or may not apply to developing nations § The transition could fail in cultures that: § Place greater value on childbirth § Grant women fewer freedoms For people to attain the material standard of living of North Americans, we would need the natural resources of four and a half more Earths © 2014 Pearson Education, Inc.
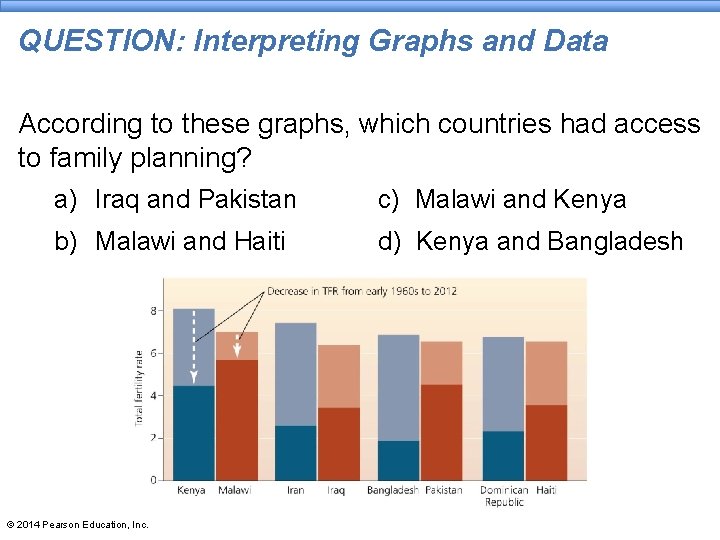
Population and Society § Many factors affect fertility in a given society: § Access to family planning § Rates of infant mortality § Levels of women’s rights § Level of affluence § Importance of child labor § Government support for retirees © 2014 Pearson Education, Inc.
Family planning is a key approach for controlling growth § Family planning = efforts to control the number and spacing of children; the greatest single factor slowing population growth § Clinics offer advice, information, and contraceptives § Birth control = effort to control the number of children born by reducing the frequency of pregnancy § Contraception = deliberate prevention of pregnancy through a variety of methods § Rates range from less than 10% (14 countries in Africa) to 84% (China) © 2014 Pearson Education, Inc.
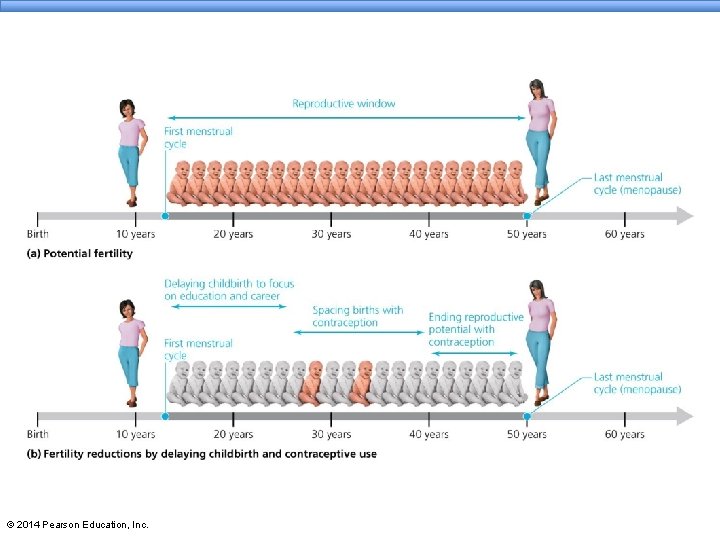
Family planning is a key approach for controlling growth § Low use of family planning may have different causes § Rural areas may have limited availability § Religious doctrines or cultural influences may reject family planning § Family planning gives women control over their reproductive window = time frame where a woman can become pregnant § Potential to produce 25 children during the window § Family planning may delay first reproduction, space births, or “close” the window when desired family size is achieved © 2014 Pearson Education, Inc.
© 2014 Pearson Education, Inc.
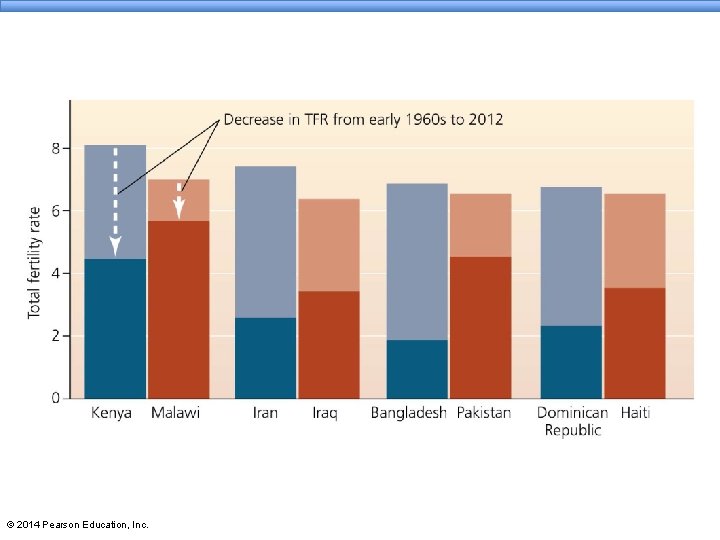
Family-planning programs are working around the world § Funding and policies that encourage family planning lower population growth rates in all nations, regardless of level of industrialization § Thailand’s educational-based approach to family planning reduced its growth rate from 2. 3% to 0. 5% § Brazil, Mexico, Iran, Cuba, and other developing countries have active programs § These entail setting targets and providing incentives, education, contraception, and reproductive health care © 2014 Pearson Education, Inc.
© 2014 Pearson Education, Inc.
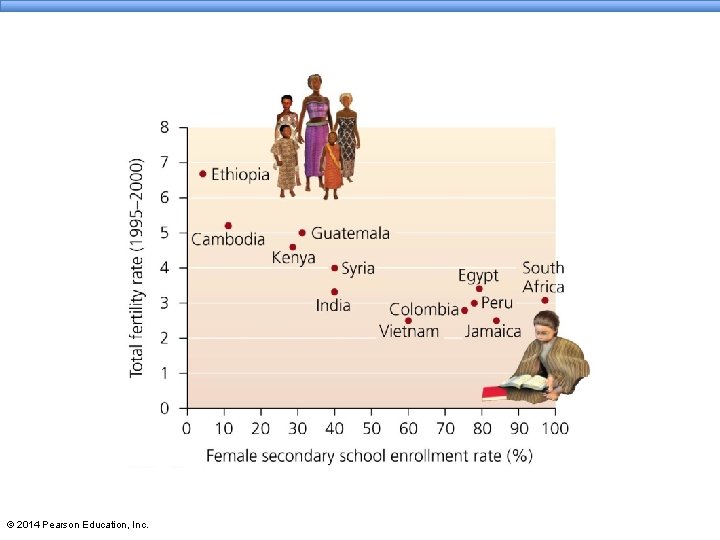
Empowering women reduces fertility rates § Where women are freer to decide whether and when to have children, fertility rates fall, and children are better cared for, healthier, and better educated. § Fertility rates drop most noticeably when women gain access to contraceptives and family-planning programs § As women receive educational opportunities, fertility rates decline § Two-thirds of the world’s illiterate are women § Education leads to delayed childbirth as women pursue careers © 2014 Pearson Education, Inc.
© 2014 Pearson Education, Inc.
Modeling Population Growth— Human Population Growth and Regulation 3 Right-click/Select Play © 2014 Pearson Education, Inc.
Modeling Population Growth— Human Population Growth and Regulation 5 Right-click/Select Play © 2014 Pearson Education, Inc.
Increasing affluence lowers fertility § Poorer societies have higher population growth rates § Consistent with the demographic transition theory § High fertility to ensure some children would survive and be able to contribute to farm labor § More affluent societies can provide: § Better medical care, reducing infant mortality § Education for children (removing them from the workforce and making them an economic liability) § Social security for the elderly § Educational opportunities for women © 2014 Pearson Education, Inc.
© 2014 Pearson Education, Inc.
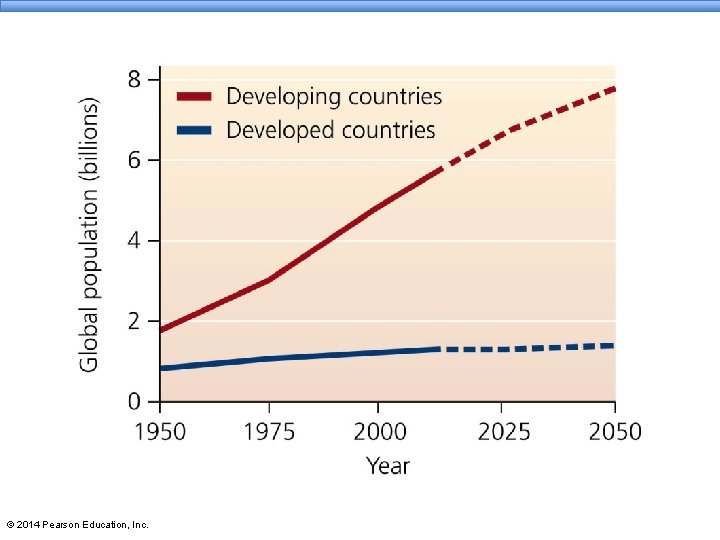
Increasing affluence lowers fertility § Poverty exacerbates population growth; population growth exacerbates poverty § In 1960, 70% of all people lived in developing nations § As of 2010, 82% live in these nations § 99% of the next billion will be born in these nations § Population growth in poor nations increases environmental degradation § Farming degrades soil in arid areas (Africa, China) § Poor people cut forests, deplete biodiversity, and hunt endangered species (e. g. , great apes) © 2014 Pearson Education, Inc.
© 2014 Pearson Education, Inc.
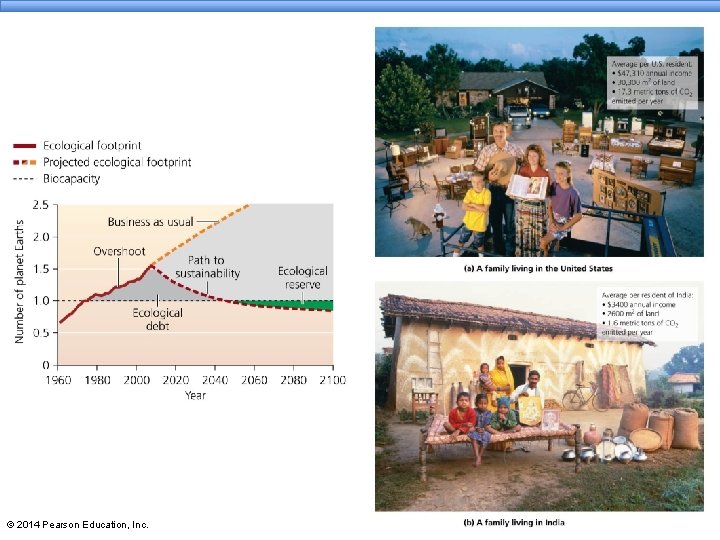
Expanding wealth can increase the environmental impact person § Affluent societies have enormous resource consumption and waste production § People use resources from other areas, as well as from their own § Ecological footprints are huge § People in affluent societies have larger ecological footprints § One American has as much environmental impact as 3. 8 Chinese or 8 Indians or 14 Afghans § Not only is the world population increasing, but the consumption person is also rising © 2014 Pearson Education, Inc.
Expanding wealth can increase the environmental impact person § Biocapacity = the amount of biologically productive land sea available to us § Ecological deficit = ecological footprint > biocapacity § Ecological reserve = ecological footprint < biocapacity § We are running a global ecological deficit § Humanity’s global ecological footprint exceeds biocapacity by 50% § The richest 20% of the world’s population uses 86% of the world’s resources © 2014 Pearson Education, Inc.
© 2014 Pearson Education, Inc.
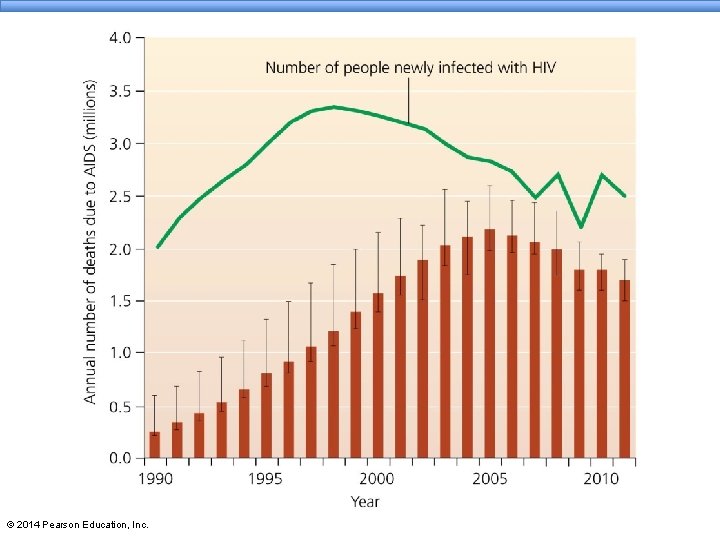
HIV/AIDS is exerting major impacts on African populations § The AIDS epidemic is having the greatest impact since the Black Death in the 14 th century § Of 34 million infected, two-thirds live in sub-Saharan Africa; 3800 die/day § Low rates of contraceptive use spread the disease § Infant mortality is 14 times that of the developed world § Life expectancy has dropped from 60 years in the 1990 s to 40– 50 years today § HIV is also well established in the Caribbean and in Southeast Asia, and it is spreading in eastern Europe and central Asia © 2014 Pearson Education, Inc.
© 2014 Pearson Education, Inc.
Demographic change has social and economic repercussions § AIDS undermines the ability of poor nations to develop § Removes productive members of society § Cost of medical treatment is a huge burden § Millions of orphans require government services © 2014 Pearson Education, Inc.
Demographic change has social and economic repercussions § Demographic fatigue = occurs when governments face overwhelming challenges related to population growth § With the added stress of HIV/AIDS, governments are stretched beyond their capabilities § Problems grow worse and citizens lose faith § Good news: HIV transmission has slowed recently © 2014 Pearson Education, Inc.
Population goals support sustainable development § 1994 UN conference on population and development § Rejected top-down, command-control approaches that pushed contraceptives and preset targets § Urged education and health care § Urged addressing social needs (like poverty, sexism) from the bottom up § To generate a high quality of life for all people, developing nations must slow population growth § Developed nations must reduce resource consumption © 2014 Pearson Education, Inc.
Conclusion § The human population is larger than at any other time § Rates are decreasing but populations are still rising § Most developed nations have passed through the demographic transition § Expanding women’s rights slows population growth § How will the population stop rising? § The demographic transition, governmental intervention, or disease and social conflict? § Sustainability requires a stabilized population to avoid destroying natural systems and leave a quality world © 2014 Pearson Education, Inc.
QUESTION: Review What has accounted for most of the world’s population growth in recent years? a) Women are having more babies. b) Technology, medicine, and food have decreased death rates. c) Fewer women are using contraceptives. d) Nothing; the population has dropped in recent years. © 2014 Pearson Education, Inc.
QUESTION: Review According to the I = P A T S formula, what would happen if China’s 1 billion people had a lifestyle like that of Americans? a) Their population would automatically drop. b) Their population would automatically increase. c) Their affluence and technology would increase. d) Their impact on the environment would decrease. © 2014 Pearson Education, Inc.
QUESTION: Review Where is the highest density of people found? a) In the colder climates (e. g. , Siberia) b) In temperate or tropical biomes c) In rural areas d) In drier areas © 2014 Pearson Education, Inc.
QUESTION: Review An age structure diagram shaped like a pyramid with a wide base shows a/an ____ population. a) increasing b) decreasing c) stable d) older © 2014 Pearson Education, Inc.
QUESTION: Review Describe the relationship between population growth rates and population size. a) Falling growth rates automatically mean a smaller population. b) Falling growth rates automatically mean a larger population. c) Falling growth rates mean we no longer have a population problem. d) Falling growth rates do not mean a smaller population, but that rates of increase are slowing. © 2014 Pearson Education, Inc.
QUESTION: Review Pre-industrial societies tend to have higher growth rates because a) good medical care prevents infant mortality. b) there is little opportunity for women to get an education or employment. c) governments provide social support networks for the elderly. d) children are required to attend school. © 2014 Pearson Education, Inc.
QUESTION: Weighing the Issues Should the United States fund international familyplanning efforts? a) Yes, absolutely. b) Yes, but only in nations that follow U. S. -approved programs. c) Only if it can influence the nations’ policies. d) Never under any circumstances; it’s not our job. © 2014 Pearson Education, Inc.
QUESTION: Weighing the Issues Would you rather live in a country with a larger population or smaller population? a) Small population, so there will be more resources for me b) Small population, so there will be more resources for others, including wildlife c) Large population, so I can find a date d) Large population, because people are our biggest resource © 2014 Pearson Education, Inc.
QUESTION: Interpreting Graphs and Data What happens during the “transitional” stage of the demographic transition? a) High birth and death rates rise—population increases b) High birth and death rates—population is stable c) High birth rates with low death rates— population increases d) Low birth and death rates cause— population decreases © 2014 Pearson Education, Inc.
QUESTION: Interpreting Graphs and Data According to this age pyramid, Nigeria’s future population will be a) balanced. b) larger. c) much larger. d) smaller. e) much smaller. © 2014 Pearson Education, Inc.
QUESTION: Interpreting Graphs and Data According to these graphs, which countries had access to family planning? a) Iraq and Pakistan c) Malawi and Kenya b) Malawi and Haiti d) Kenya and Bangladesh © 2014 Pearson Education, Inc.