
THE HUMAN POPULATION 2006 Population Reference Bureau Projecting
THE HUMAN POPULATION © 2006 Population Reference Bureau
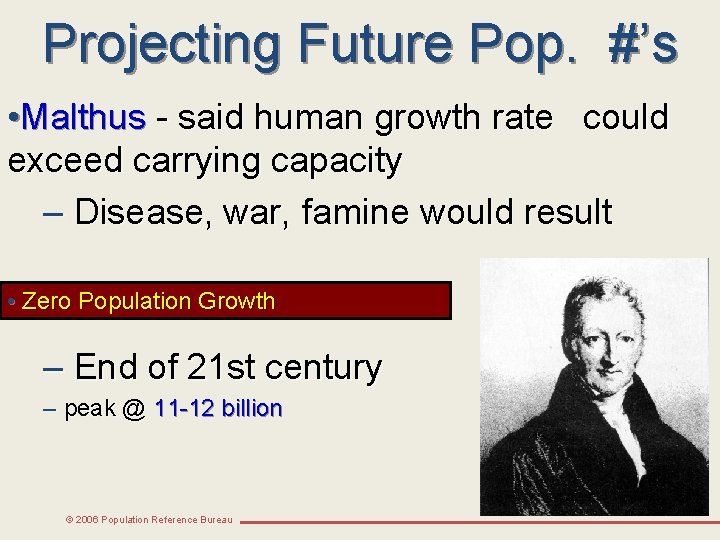
Projecting Future Pop. #’s • Malthus - said human growth rate could exceed carrying capacity – Disease, war, famine would result • Zero Population Growth – End of 21 st century – peak @ 11 -12 billion © 2006 Population Reference Bureau
Over the last 150 years, fossil fuel use has allowed the human population to soar © 2006 Population Reference Bureau
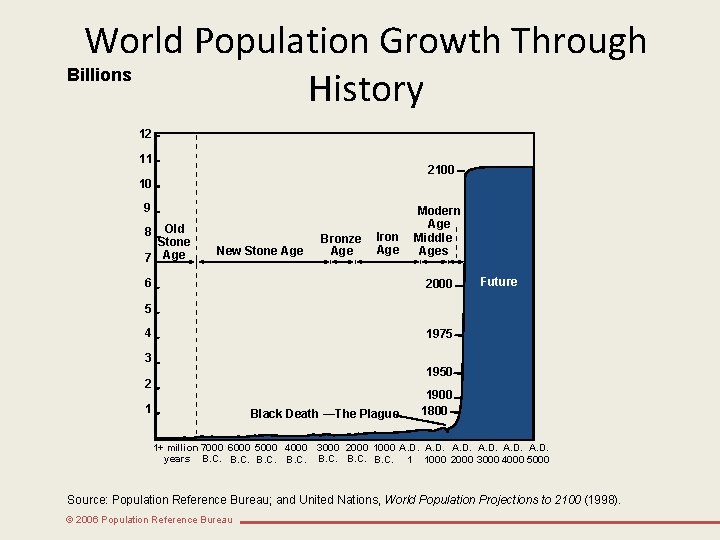
World Population Growth Through Billions History 12 11 2100 10 9 Old Stone 7 Age 8 New Stone Age Bronze Age Iron Age 6 Modern Age Middle Ages 2000 Future 5 4 1975 3 1950 2 1 Black Death —The Plague 1900 1800 1+ million 7000 6000 5000 4000 3000 2000 1000 A. D. years B. C. 1 1000 2000 3000 4000 5000 Source: Population Reference Bureau; and United Nations, World Population Projections to 2100 (1998). © 2006 Population Reference Bureau
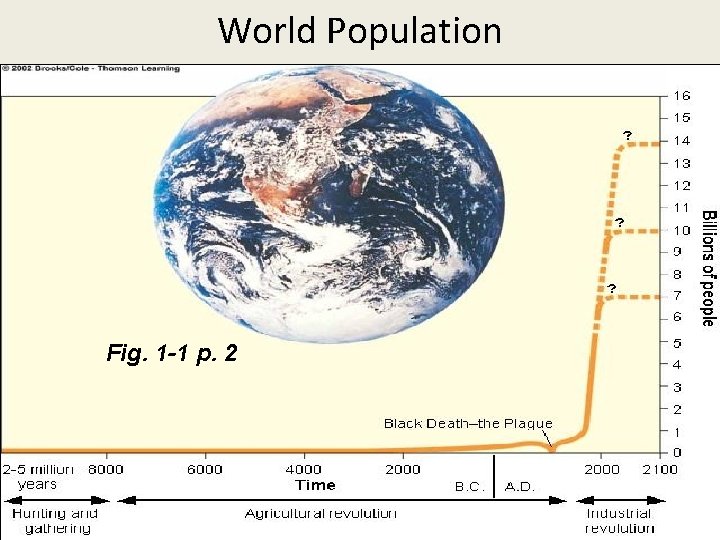
World Population Fig. 1 -1 p. 2 3/1/2021 © 2006 Population Reference Bureau 5
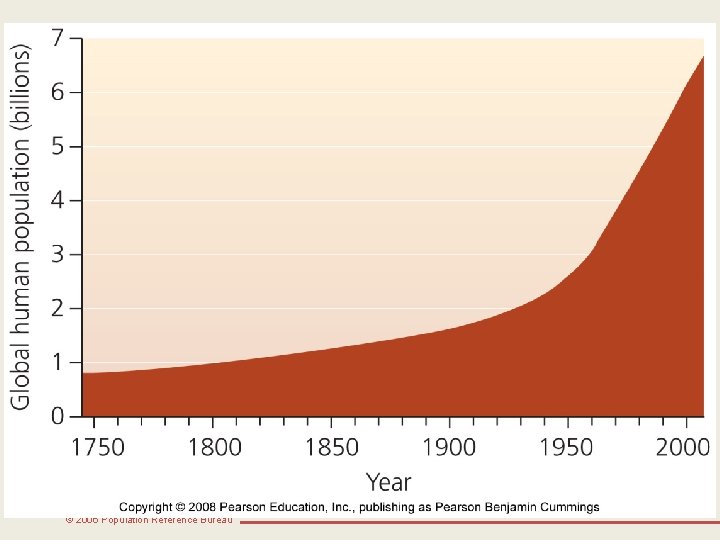
08_02. JPG © 2006 Population Reference Bureau
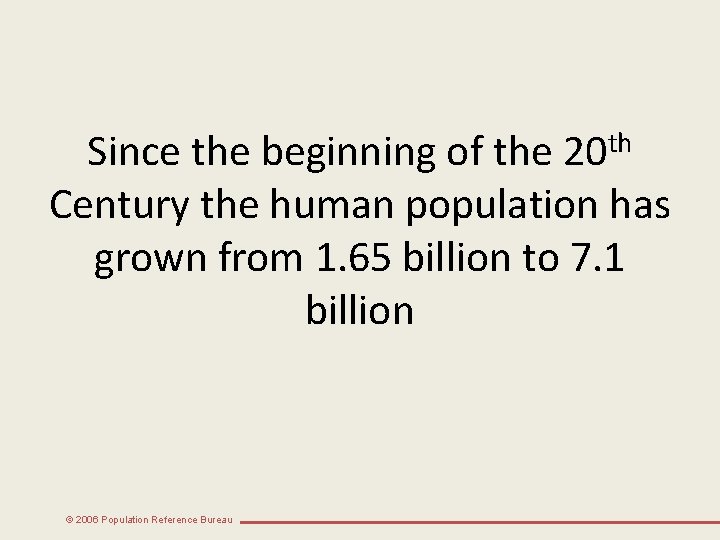
Since the beginning of the 20 th Century the human population has grown from 1. 65 billion to 7. 1 billion © 2006 Population Reference Bureau
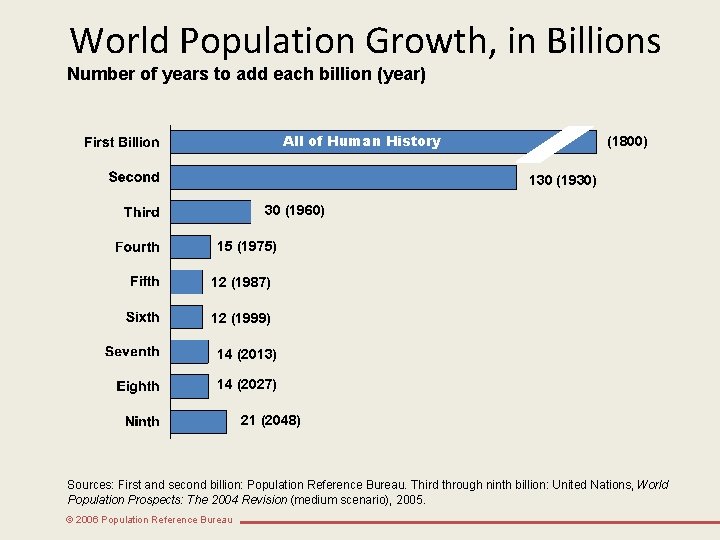
World Population Growth, in Billions Number of years to add each billion (year) All of Human History (1800) 130 (1930) 30 (1960) 15 (1975) 12 (1987) 12 (1999) 14 (2013) 14 (2027) 21 (2048) Sources: First and second billion: Population Reference Bureau. Third through ninth billion: United Nations, World Population Prospects: The 2004 Revision (medium scenario), 2005. © 2006 Population Reference Bureau
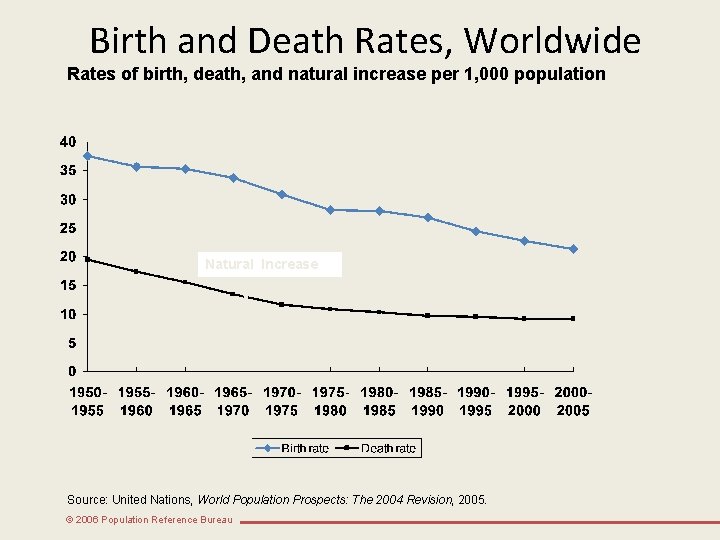
Birth and Death Rates, Worldwide Rates of birth, death, and natural increase per 1, 000 population Natural Increase Source: United Nations, World Population Prospects: The 2004 Revision, 2005. © 2006 Population Reference Bureau
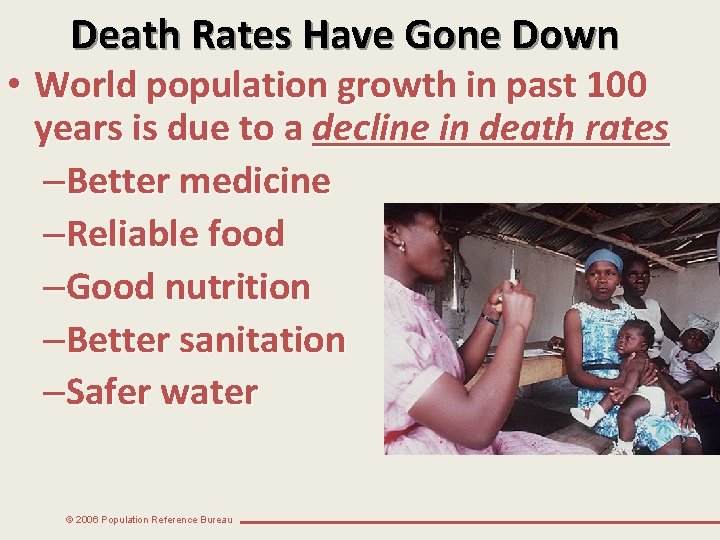
Death Rates Have Gone Down • World population growth in past 100 years is due to a decline in death rates –Better medicine –Reliable food –Good nutrition –Better sanitation –Safer water © 2006 Population Reference Bureau
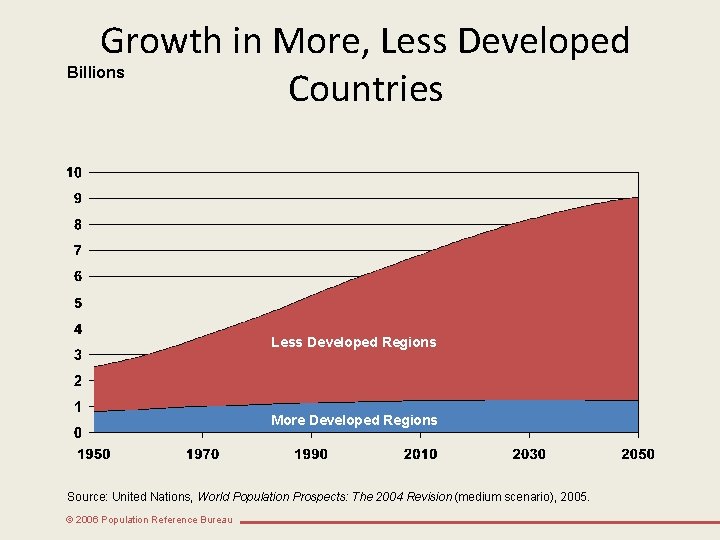
Growth in More, Less Developed Countries Billions Less Developed Regions More Developed Regions Source: United Nations, World Population Prospects: The 2004 Revision (medium scenario), 2005. © 2006 Population Reference Bureau
95% of all population growth is taking place in Developing Countries © 2006 Population Reference Bureau
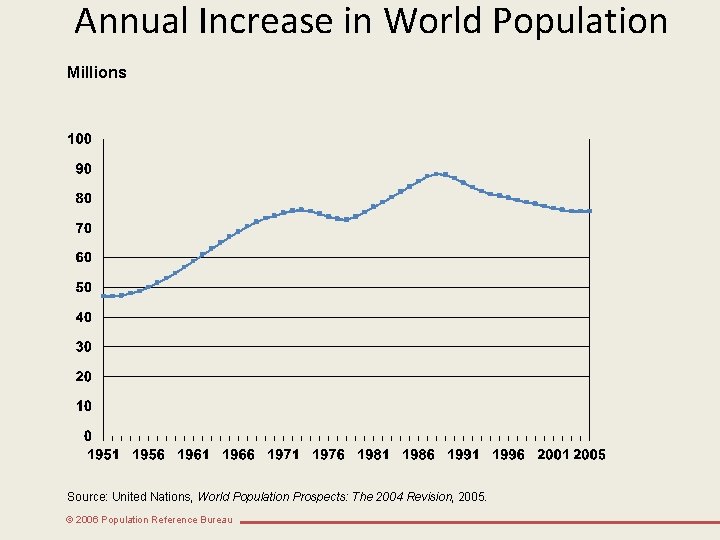
Annual Increase in World Population Millions Source: United Nations, World Population Prospects: The 2004 Revision, 2005. © 2006 Population Reference Bureau
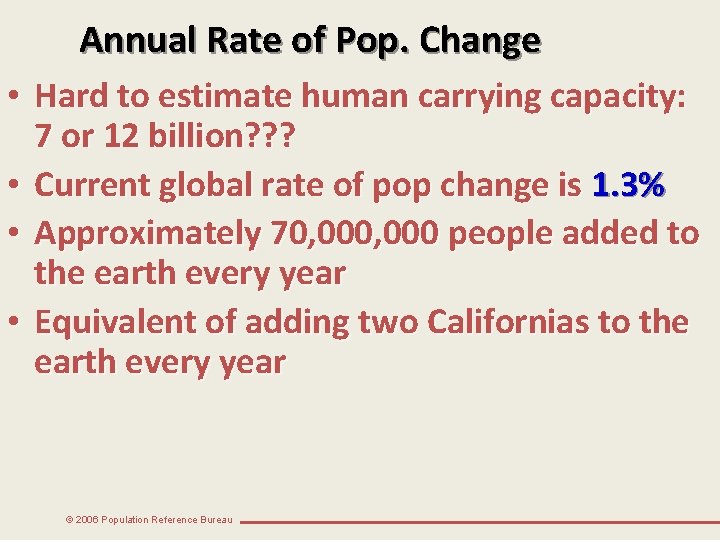
Annual Rate of Pop. Change • Hard to estimate human carrying capacity: 7 or 12 billion? ? ? • Current global rate of pop change is 1. 3% • Approximately 70, 000 people added to the earth every year • Equivalent of adding two Californias to the earth every year © 2006 Population Reference Bureau
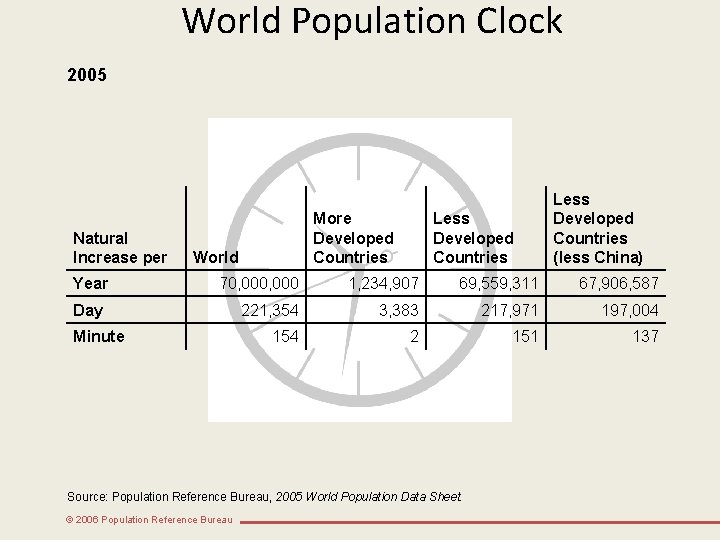
World Population Clock 2005 Natural Increase per Year More Developed Countries World Less Developed Countries (less China) 70, 000 1, 234, 907 69, 559, 311 67, 906, 587 221, 354 3, 383 217, 971 197, 004 154 2 151 137 Day Minute Source: Population Reference Bureau, 2005 World Population Data Sheet. © 2006 Population Reference Bureau
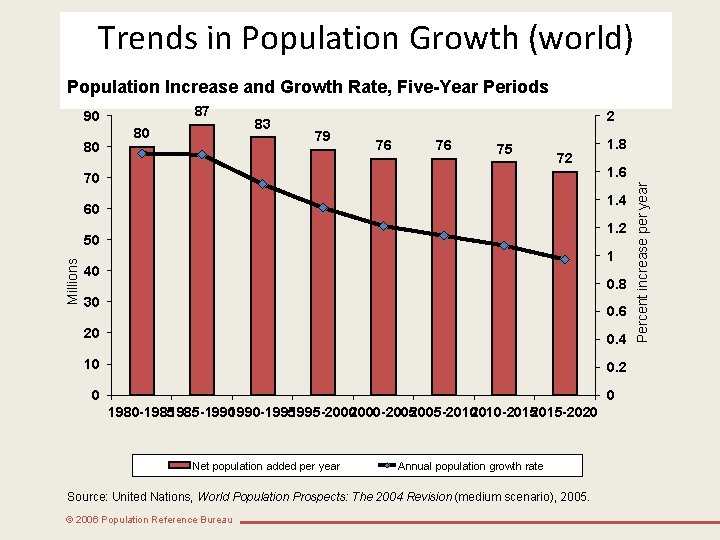
Trends in Population Growth (world) Population Increase and Growth Rate, Five-Year Periods 80 80 83 2 79 76 76 75 72 70 1. 6 1. 4 60 1. 2 50 Millions 1. 8 1 40 0. 8 30 0. 6 20 0. 4 10 0. 2 0 0 1980 -1985 -1990 -1995 -2000 -2005 -2010 -2015 -2020 Net population added per year Annual population growth rate Source: United Nations, World Population Prospects: The 2004 Revision (medium scenario), 2005. © 2006 Population Reference Bureau Percent increase per year 87 90
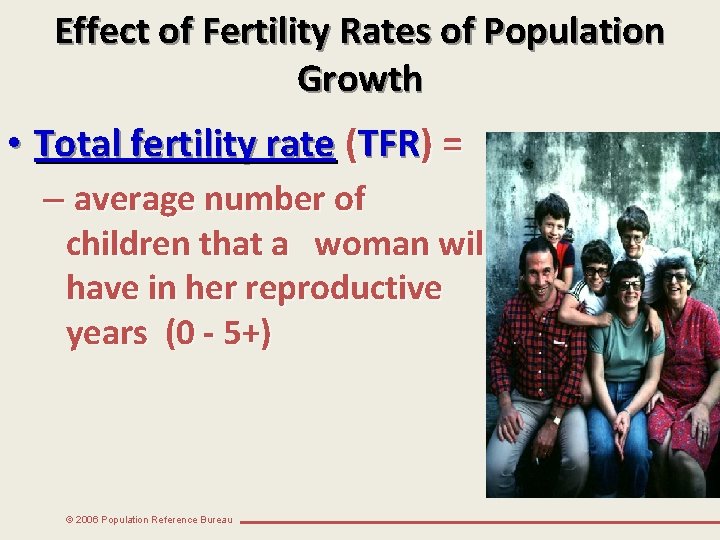
Effect of Fertility Rates of Population Growth • Total fertility rate (TFR) = – average number of children that a woman will have in her reproductive years (0 - 5+) © 2006 Population Reference Bureau
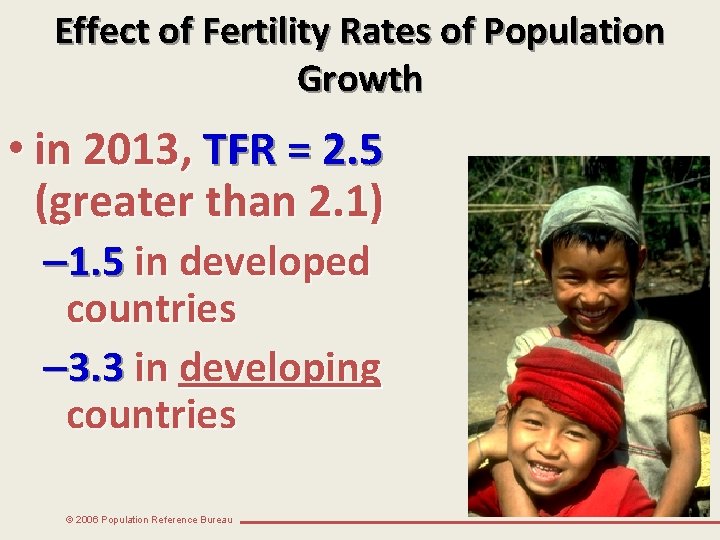
Effect of Fertility Rates of Population Growth • in 2013, TFR = 2. 5 (greater than 2. 1) – 1. 5 in developed countries – 3. 3 in developing countries © 2006 Population Reference Bureau
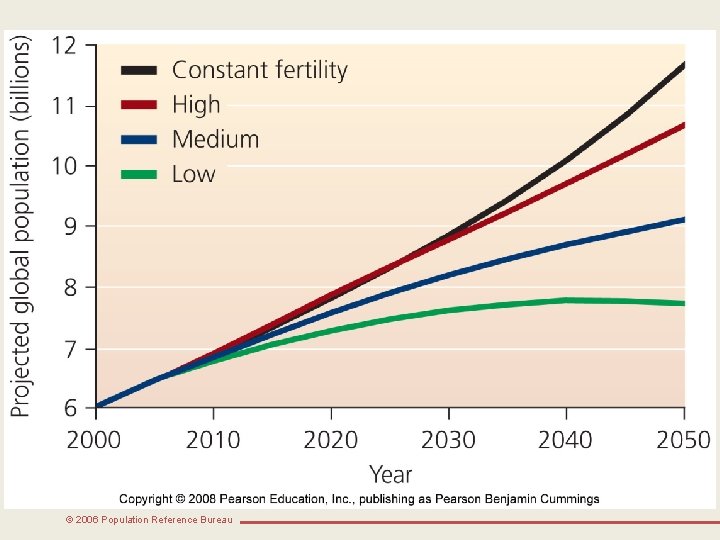
08_08. JPG © 2006 Population Reference Bureau
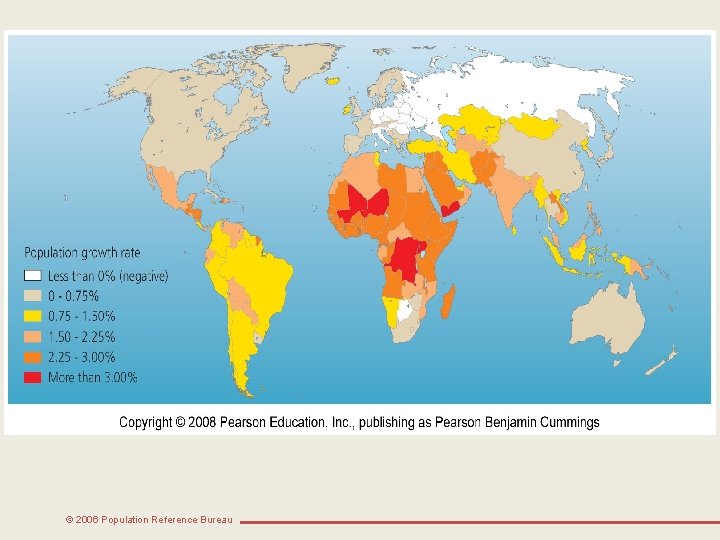
08_03. JPG © 2006 Population Reference Bureau
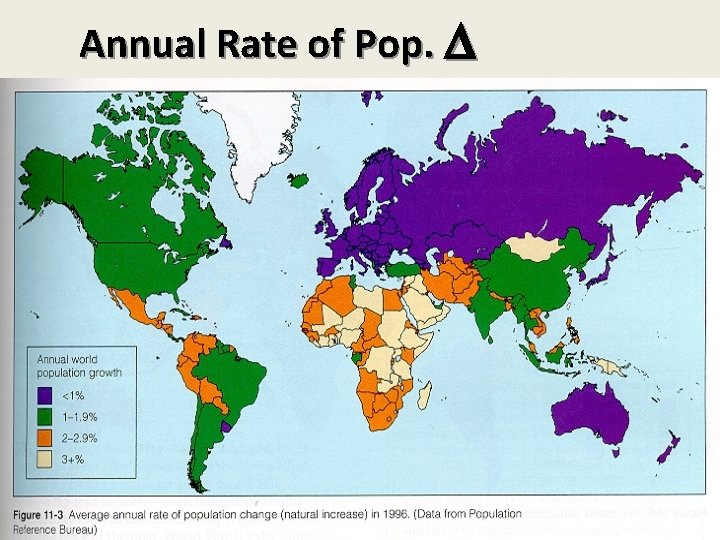
Annual Rate of Pop. © 2006 Population Reference Bureau
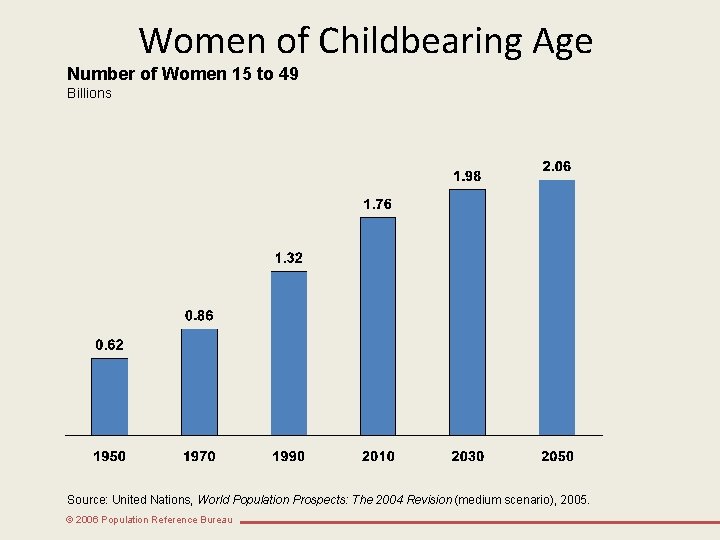
Women of Childbearing Age Number of Women 15 to 49 Billions Source: United Nations, World Population Prospects: The 2004 Revision (medium scenario), 2005. © 2006 Population Reference Bureau
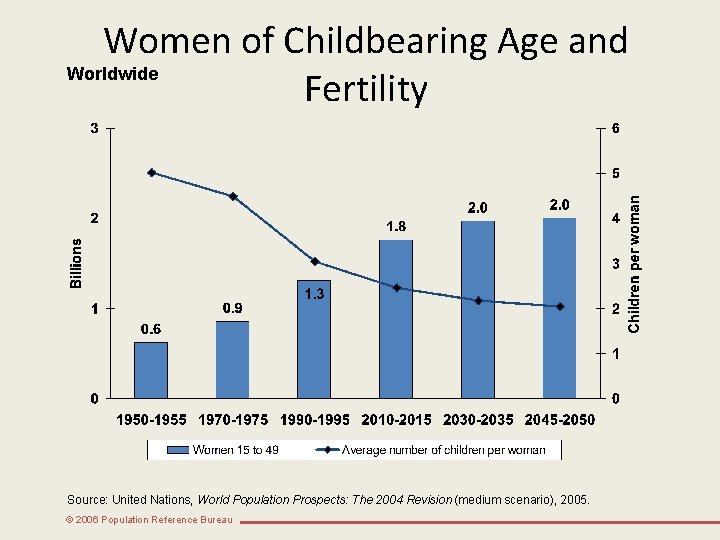
Women of Childbearing Age and Worldwide Fertility Source: United Nations, World Population Prospects: The 2004 Revision (medium scenario), 2005. © 2006 Population Reference Bureau
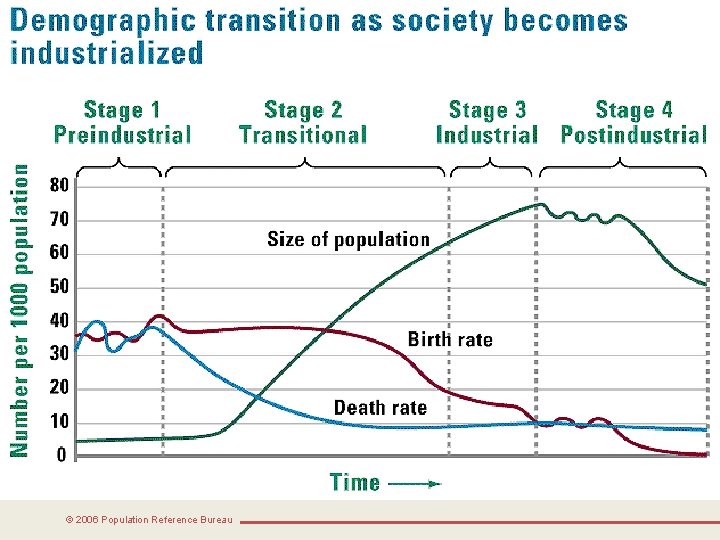
How Does Industrialization Affect Population Size? The Demographic Transition © 2006 Population Reference Bureau
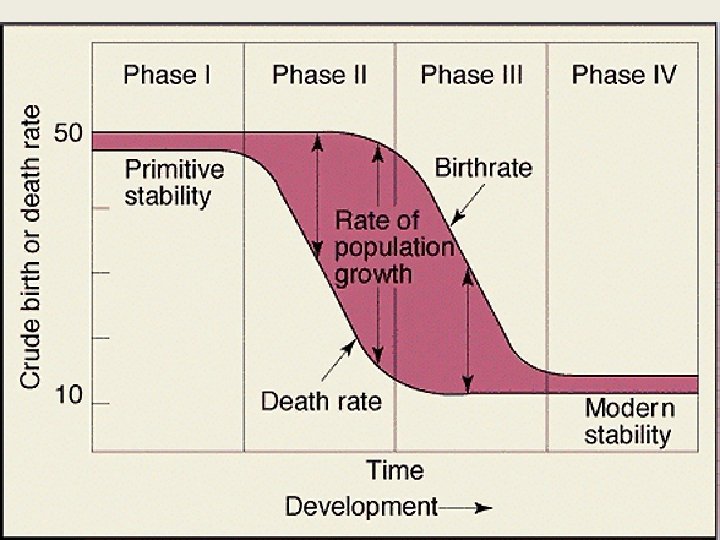
The Demographic Transition model shows us what happens to the population in a country as it becomes more developed © 2006 Population Reference Bureau
© 2006 Population Reference Bureau
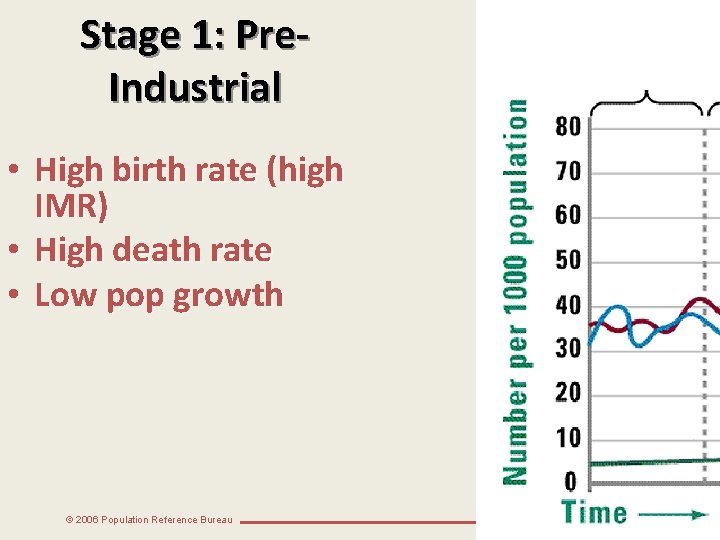
Stage 1: Pre. Industrial • High birth rate (high IMR) • High death rate • Low pop growth © 2006 Population Reference Bureau
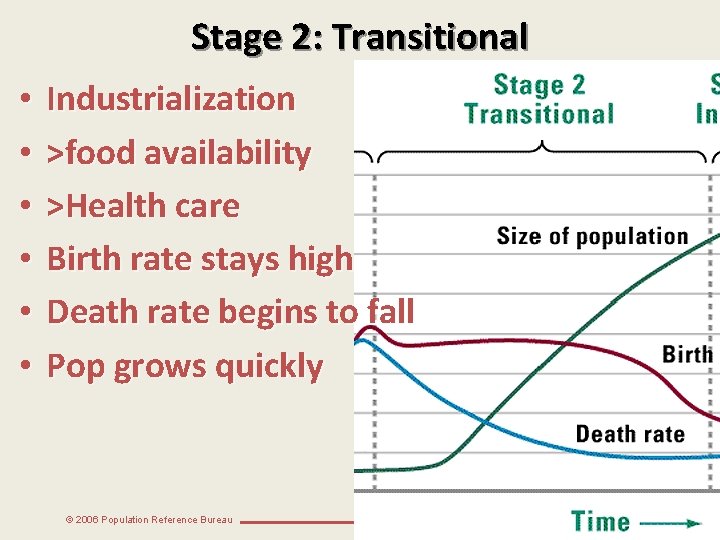
Stage 2: Transitional • • • Industrialization >food availability >Health care Birth rate stays high Death rate begins to fall Pop grows quickly © 2006 Population Reference Bureau
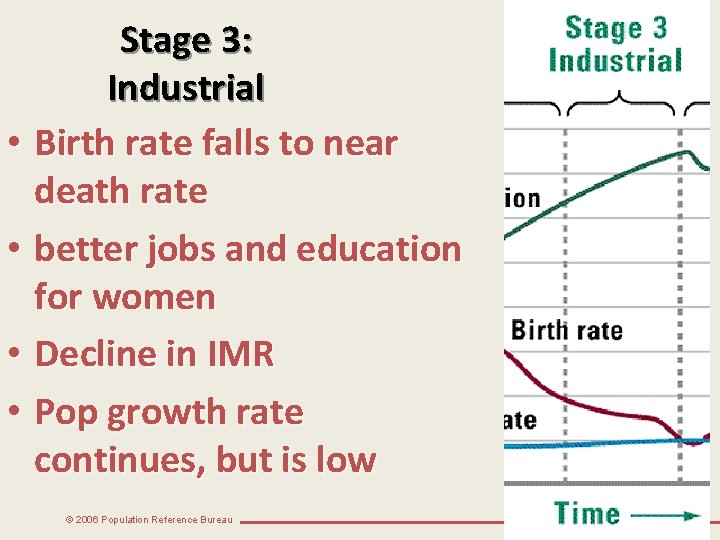
Stage 3: Industrial • Birth rate falls to near death rate • better jobs and education for women • Decline in IMR • Pop growth rate continues, but is low © 2006 Population Reference Bureau
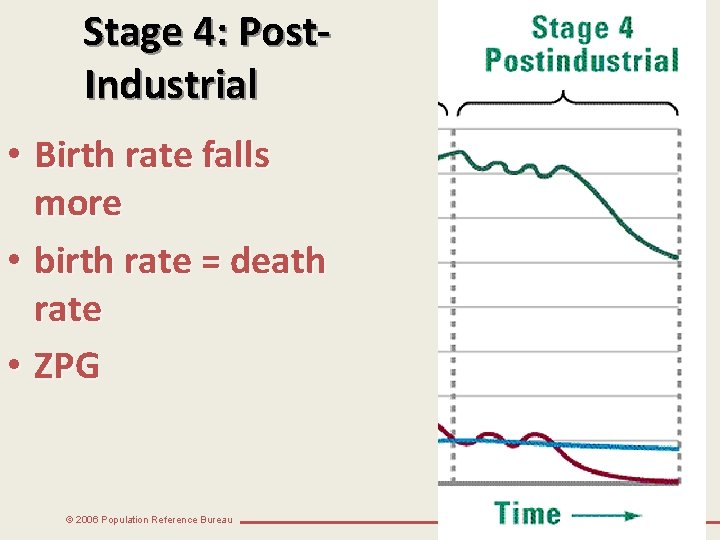
Stage 4: Post. Industrial • Birth rate falls more • birth rate = death rate • ZPG © 2006 Population Reference Bureau
Stage 4: Post-Industrial • Then, birth rate declines more; less than death rate, negative pop growth • Unsustainability to sustainability • Very few countries have made it here © 2006 Population Reference Bureau
© 2006 Population Reference Bureau
The End © 2006 Population Reference Bureau
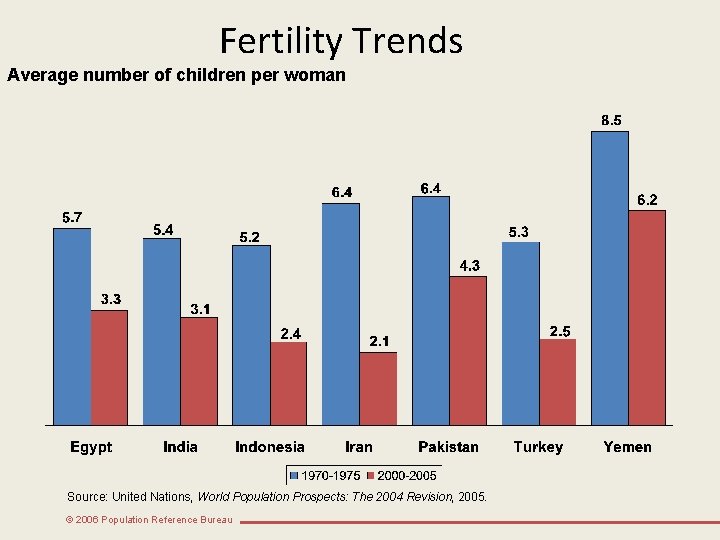
Fertility Trends Average number of children per woman Source: United Nations, World Population Prospects: The 2004 Revision, 2005. © 2006 Population Reference Bureau
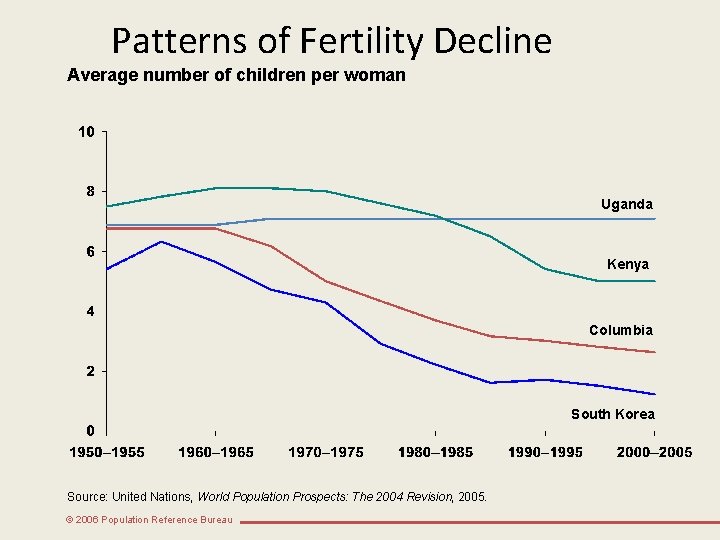
Patterns of Fertility Decline Average number of children per woman Uganda Kenya Columbia South Korea Source: United Nations, World Population Prospects: The 2004 Revision, 2005. © 2006 Population Reference Bureau
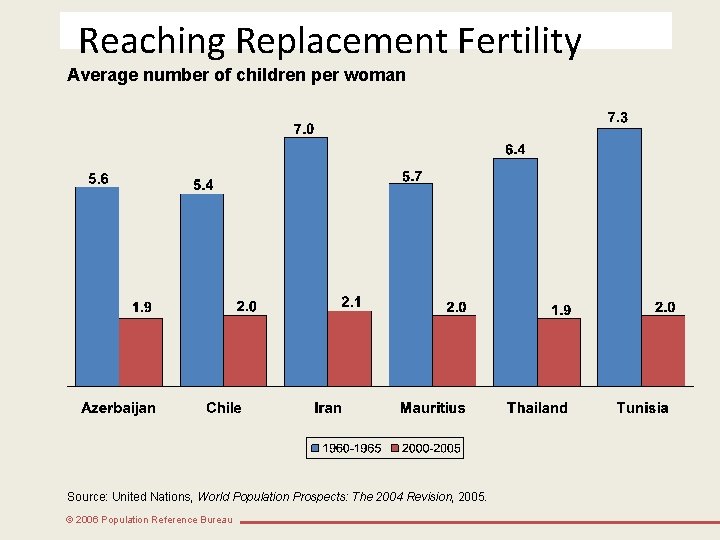
Reaching Replacement Fertility Average number of children per woman Source: United Nations, World Population Prospects: The 2004 Revision, 2005. © 2006 Population Reference Bureau
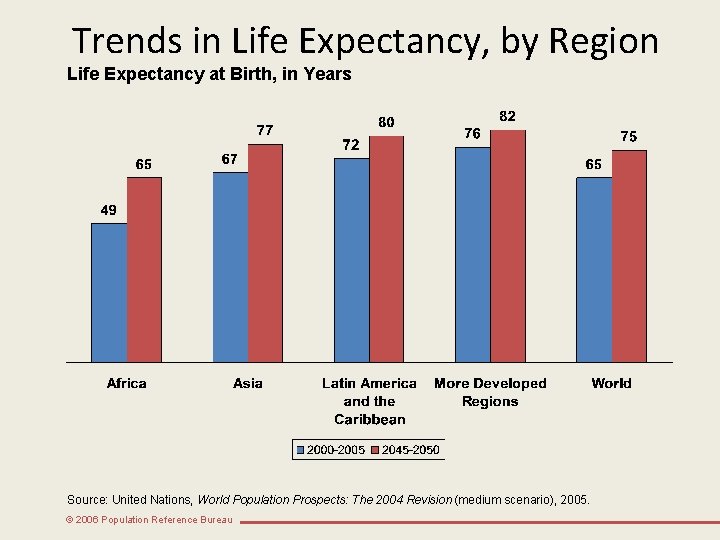
Trends in Life Expectancy, by Region Life Expectancy at Birth, in Years Source: United Nations, World Population Prospects: The 2004 Revision (medium scenario), 2005. © 2006 Population Reference Bureau
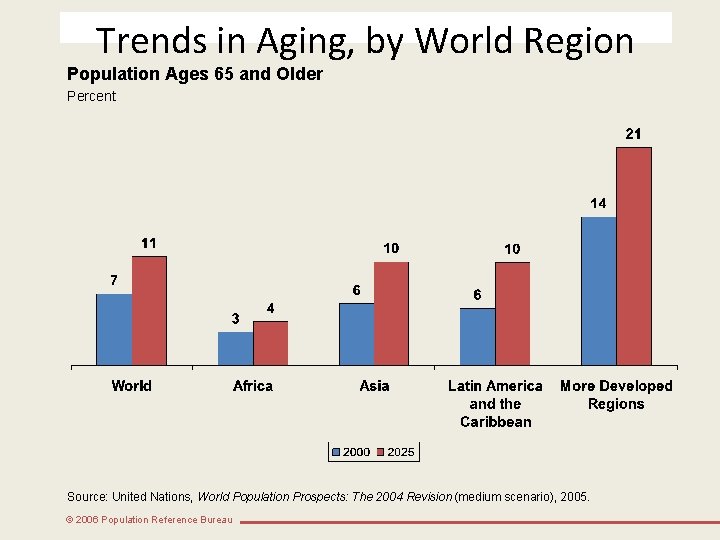
Trends in Aging, by World Region Population Ages 65 and Older Percent Source: United Nations, World Population Prospects: The 2004 Revision (medium scenario), 2005. © 2006 Population Reference Bureau
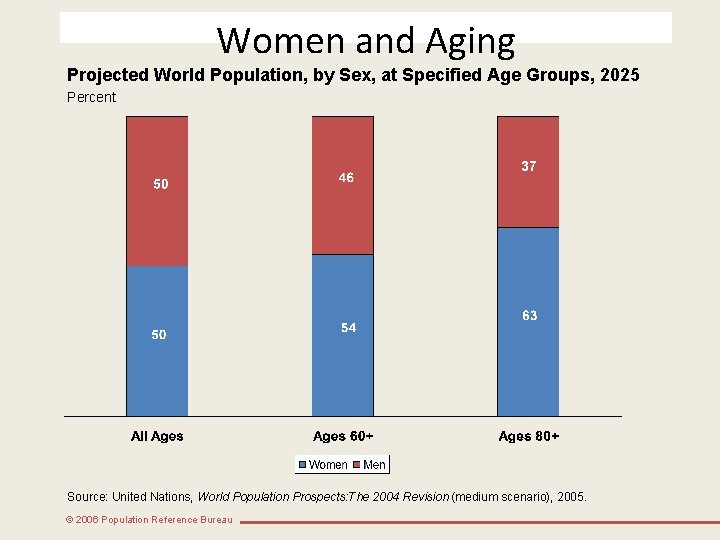
Women and Aging Projected World Population, by Sex, at Specified Age Groups, 2025 Percent Source: United Nations, World Population Prospects: The 2004 Revision (medium scenario), 2005. © 2006 Population Reference Bureau
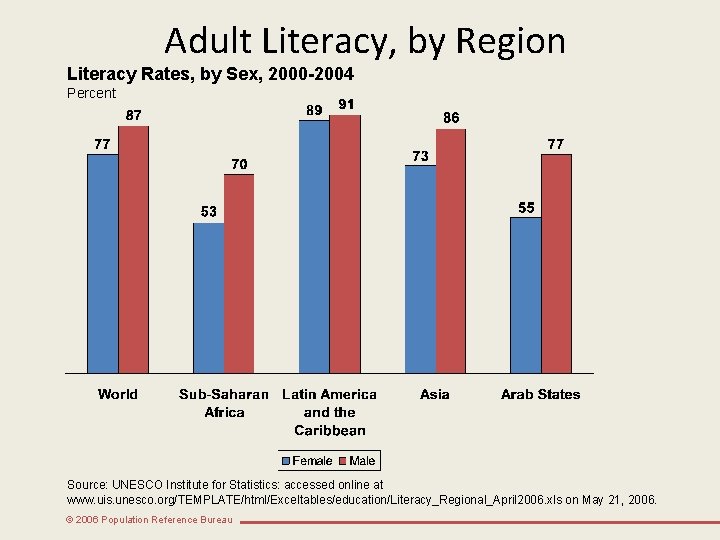
Adult Literacy, by Region Literacy Rates, by Sex, 2000 -2004 Percent Source: UNESCO Institute for Statistics: accessed online at www. uis. unesco. org/TEMPLATE/html/Exceltables/education/Literacy_Regional_April 2006. xls on May 21, 2006. © 2006 Population Reference Bureau
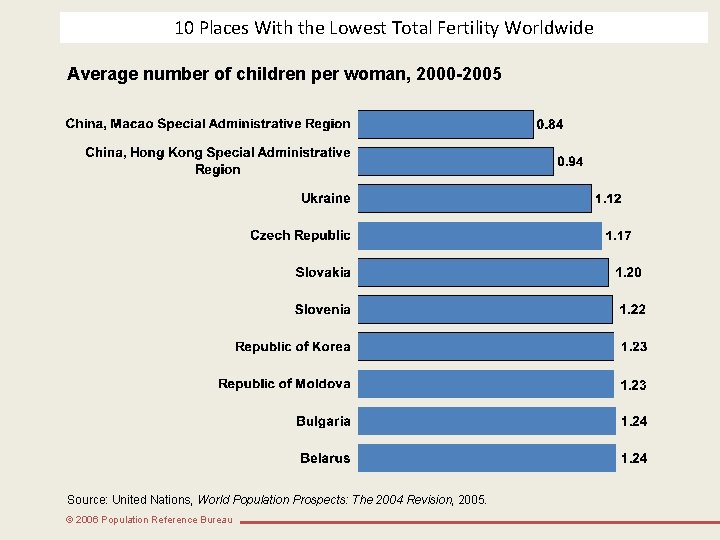
10 Places With the Lowest Total Fertility Worldwide Average number of children per woman, 2000 -2005 Source: United Nations, World Population Prospects: The 2004 Revision, 2005. © 2006 Population Reference Bureau
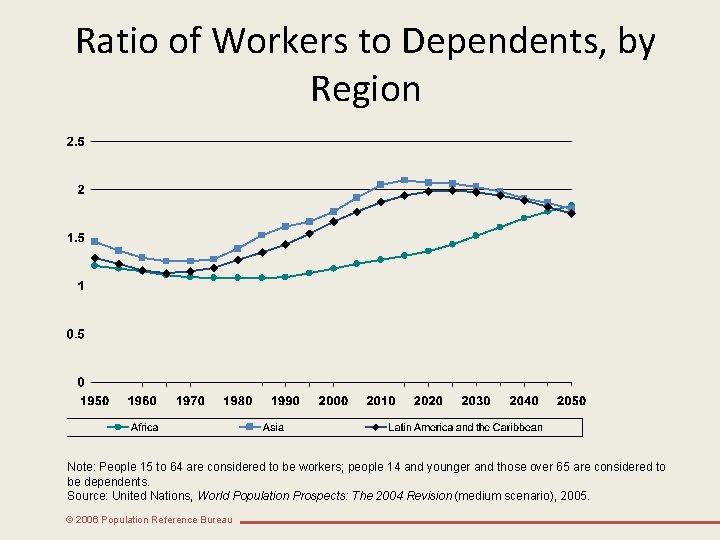
Ratio of Workers to Dependents, by Region Note: People 15 to 64 are considered to be workers; people 14 and younger and those over 65 are considered to be dependents. Source: United Nations, World Population Prospects: The 2004 Revision (medium scenario), 2005. © 2006 Population Reference Bureau
- Slides: 42