Karen H Pearce Senior Legislative Policy Analyst Office


 R&RA")


 1 st Trillion • 1987 -2002")


 $1. 7 $77. 5 $11. 0")


 $ 242 $ 1. 340 $")

 2021 Proposed Outlays ($5.")


- Slides: 30
Karen H. Pearce Senior Legislative Policy Analyst Office of Legislative and Public Affairs
NSF and Congress
NSF’s Congressional Players Authorization Subcommittee on Commerce, Justice, Science, and Related Agencies Senate Appropriations Authorization Committee on Science, Space & Technology Subcommittee on Research and Science Education Appropriations House Health, Education, Labor and Pensions Commerce, Science and Transportation Comm. Subcommittee on Science and Space Subcommittee on Commerce, Justice, Science, and Related Agencies
Authorization versus Appropriation Committees Role of authorization committees • Authorize funding • Develop legislation to set program priorities, and to establish, continue, modify, or alter programs and program operations • Oversight functions Role of appropriation committees • Hold “power of the purse” • Set specific expenditures of money by U. S. government, e. g. , allocates funds to numerous government agencies, departments, and organizations • Disperse spending allocations to Appropriations Subcommittees • Responsible for supplemental spending bills
The NSF Budget
NATIONAL SCIENCE FOUNDATION FY 2012 House CJS Mark BY ACCOUNT (Dollars in Millions) R&RA EHR MREFC AOAM OIG NSB TOTAL, NSF FY 2011 Enacted $5, 563. 870 FY 2012 Request $6, 253. 54 $861. 034 $117. 060 $299. 400 $13. 972 $911. 20 $224. 68 $357. 74 $15. 00 $4. 531 $6, 859. 870 $4. 84 $7, 767. 00 FY 12 House Mark vs FY 12 Request House Mark Percent FY 2012 Amount $5, 606. 96 -$646. 58 -10. 3% -76. 20 -8. 4% $835. 00 -124. 68 -55. 5% $100. 00 -58. 34 -16. 3% $299. 40 -1. 03 -6. 9% $13. 97 $4. 53 $6, 859. 87 -0. 31 -6. 4% -$907. 13 -11. 7% FY 12 House Mark vs FY 11 Enacted Amount Percent $43. 09 0. 8% -26. 03 -3. 0% -17. 06 -14. 6% 0. 00 0. 0% -0. 00 Totals may not add due to rounding. NATIONAL SCIENCE FOUNDATION FY 2012 Senate CJS Mark BY ACCOUNT (Dollars in Millions) R&RA EHR MREFC AOAM OIG NSB TOTAL, NSF FY 2011 Enacted FY 2012 Request Senate Mark FY 2012 $5, 563. 870 $6, 253. 54 $861. 034 $117. 060 $299. 400 $13. 972 $4. 531 $6, 859. 870 Totals may not add due to rounding. FY 12 Sen. Mark vs FY 12 Request FY 12 Sen. Mark vs FY 11 Enacted Amount Percent $5, 443. 00 -$810. 54 -13. 0% $911. 20 $224. 68 $357. 74 $15. 00 $829. 00 $117. 06 $290. 40 $14. 20 -82. 20 -107. 63 -67. 34 -9. 0% -47. 9% -18. 8% -0. 80 -5. 3% $4. 84 $7, 767. 00 $4. 40 $6, 698. 10 -0. 44 -9. 1% Amount $120. 87 -32. 03 0. 00 -9. 00 0. 23 -0. 13 -13. 8% -161. 78 -$1, 068. 91 Percent -2. 2% -3. 7% 0. 0% -3. 0% 1. 6% -2. 9% -2. 4%
NATIONAL SCIENCE FOUNDATION FY 2012 House vs Senate CJS Mark BY ACCOUNT (Dollars in Millions) House vs Senate FY 2011 Enacted FY 2012 Request House Mark FY 2012 Senate Mark FY 2012 Amount $5, 563. 870 $6, 253. 54 $5, 606. 96 $5, 443. 00 -$163. 96 EHR $861. 034 $911. 20 $835. 00 $829. 00 -6. 00 MREFC $117. 060 $224. 68 $100. 00 $117. 06 AOAM $299. 400 $357. 74 $299. 40 $290. 40 OIG $13. 972 $15. 00 $13. 97 $14. 20 0. 23 NSB $4. 531 $4. 84 $4. 53 $4. 40 -0. 13 $6, 859. 870 $7, 767. 00 $6, 859. 87 $6, 698. 10 -$161. 77 R&RA TOTAL, NSF Totals may not add due to rounding. 17. 06 -9. 00
Recent and Outyear NSF Funding $ in Billions $14. 0 $12. 0 $10. 0 $8. 0 $6. 0 $4. 0 $2. 0 $0. 0 2005 2006 2007 2008 2009 2010 2011 2012 2013 2014 2015 2016 Fiscal Year NSF Appropriations ARRA Appropriations President's Plan for Science & Innovation America COMPETES Act 2017
National Science Foundation FY 12 Budget Funding Highlights • Provides $7. 8 B for the NSF. Investments are made in areas that contribute to the President’s Plan for Science and Innovation. Savings are also created by reducing funding for low-performing and lower-priority education and research programs. • Demonstrates the Administration’s commitment to R&D as a driver of economic growth, consistent with the President’s plan to double funding for key basic research agencies. • Fosters the development of a clean energy economy by providing $998 million for a cross-agency sustainability research effort focused on renewable energy technologies and complex environmental- and climate-system processes. • Supports job creation in advanced manufacturing and emerging technologies with significant increases for multidisciplinary research targeted at next-generation computer chips, wireless communications, and robotics technologies.
National Science Foundation FY 12 Budget Funding Highlights, cont. ___________________________ • Invests in the growth of America’s science and technology workforce with $20 million for recruiting and retaining undergraduate students from underrepresented groups. • Invests in the next generation of math and science teachers with a new $20 million research and development program aimed at improving the preparation and professional development of future educators in these fields. • Builds first-of-a-kind distributed research facilities to continuously monitor the Nation’s environment and oceans.
Obama Administration FY 2012 Priorities ___________________________ • Growing the economy and spurring job creation by America's businesses, is the top priority. • 5 -year freeze on all discretionary spending outside of security, but not across the board. • “…we-as a Nation-must devote our resources to these fundamental areas of scientific inquiry. ” – Increasing investment in R&D that contributes to fields as varied as biomedicine, cybersecurity, nano-technology, and advanced manufacturing. – Significant investment in clean energy technology, boosting investment by 1/3 rd • Historic investment in repairing, rebuilding, and modernizing our transportation infrastructure. • Ambitious effort to speed development of a cutting-edge, high-speed wireless data network. • Double U. S. exports by 2014.
NSF in the “Big Picture”
U. S. BUDGET IS $3, 729, 000, 000
Federal Budget Growth • 1789 -1987 (198 Years) 1 st Trillion • 1987 -2002 (15 Years) 2 nd Trillion • 2002 -2007 (5 Years) 3 rd Trillion
FEDERAL R&D $ 147, 911, 000 3. 97%
NSF RESEARCH BUDGET $ 6, 320, 000 4. 3%
FEDERAL GOVERNMENT 2012 R&D Budget ($147. 9 Billion) $1. 7 $77. 5 $11. 0 $11. 2 $5. 6 $8. 5 $32. 2
NSF Role in Research and Development Fiscal Year 2008 Latest complete data currently available. Source: NSF/SRS: Science and Engineering Indicators FY 2008, Appendix Table 4 -3; Federal Funds for Research and Development, 2007 -9, Tables 4, 28, and 66.
Federal Government Budget FY 2012 and Beyond
FEDERAL GOVERNMENT 2012 Proposed Outlays ($3. 729 Trillion) $ 242 $ 1. 340 $ 2. 140
Mandatory Spending is Overwhelming the Rest of the Budget 1962 Mandatory 2012 Discretionary Net Interest
FEDERAL GOVERNMENT Proposed Outlays 2012 Proposed Outlays ($3. 729 Trillion) 2021 Proposed Outlays ($5. 697 Trillion) $242 $. 844 $1. 340 $2. 140 $1. 367 $3. 475 Mandatory Discretionary Net Interest
Mandatory Spending • Not in the jurisdiction of Appropriations Committees • Many programs are increased for Cost of Living Adjustments • Major Three - Social Security, Medicare, and Medicaid
Important Trends
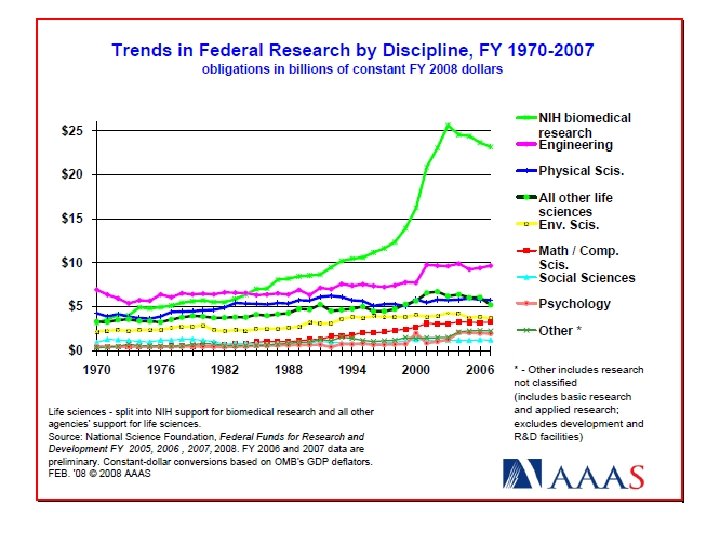
Federal Support for research • In inflation-adjusted dollars, federal funding for the physical sciences has been flat for several decades • This comes at a time when other nations are increasing their public investments in R&D • The America Competes Act will hopefully represent a reversal of this trend.
Academic R&D expenditures, by source of funding: 1973 -2009 Percent 70 60 50 Federal government State/local government Industry Academic institutions All other sources 40 30 20 10 0 1973 1977 1981 1985 1989 1993 1997 2001 2005 NOTE: Science and engineering R&D; non-S&E R&D not included. SOURCE: National Science Foundation, National Center for Science and Engineering Statistics , Survey of Research and Development Expenditures at Universities and Colleges: FY 2009. See appendix table 5 -2. 2009
Innovation Resulting from US Federally-Funded Research Innovation Funder The Internet Web Browser Bar Codes Fiber Optics Routers MRI Doppler Radar Speech Recognition Nanotechnology Computer Aided Design Google DARPA/NSF NSF NSF NIH/NSF NSF/DARPA NSF Source: Losing the Competitive Advantage? American Electronics Association, 2005.