
DFO Shellfish Aquaculture Research Update Chris Pearce Fisheries













- Slides: 50
DFO Shellfish Aquaculture Research Update Chris Pearce Fisheries and Oceans Canada (and a cast of thousands, well dozens maybe)
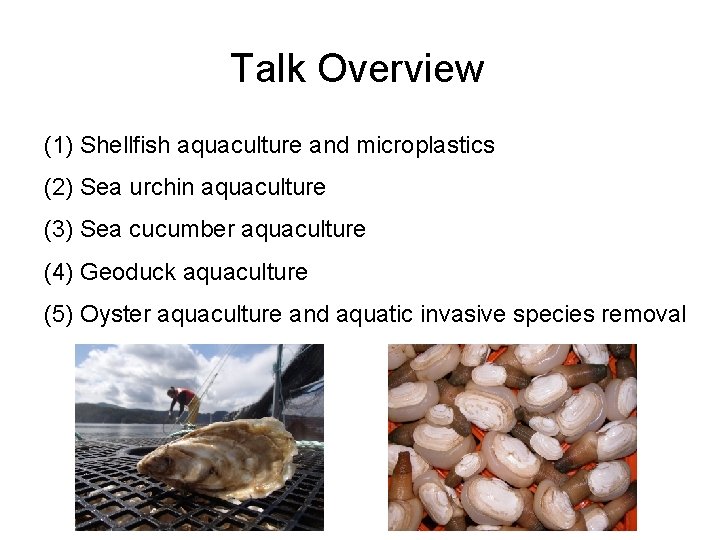
Talk Overview (1) Shellfish aquaculture and microplastics (2) Sea urchin aquaculture (3) Sea cucumber aquaculture (4) Geoduck aquaculture (5) Oyster aquaculture and aquatic invasive species removal
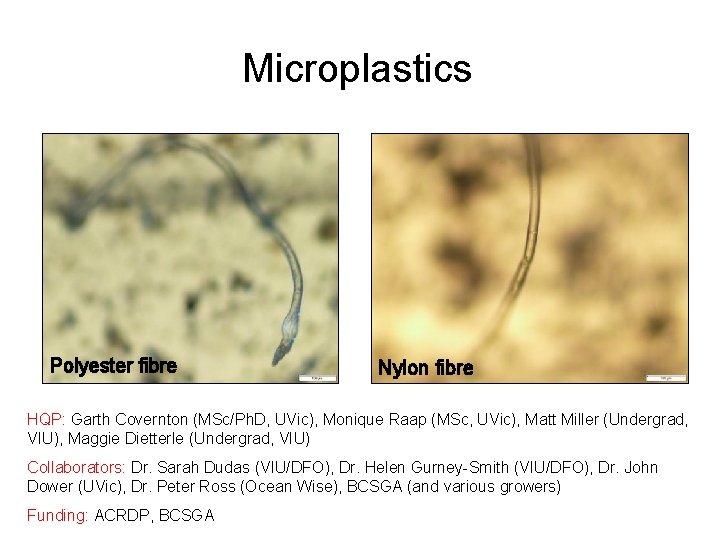
Microplastics Polyester fibre Nylon fibre HQP: Garth Covernton (MSc/Ph. D, UVic), Monique Raap (MSc, UVic), Matt Miller (Undergrad, VIU), Maggie Dietterle (Undergrad, VIU) Collaborators: Dr. Sarah Dudas (VIU/DFO), Dr. Helen Gurney-Smith (VIU/DFO), Dr. John Dower (UVic), Dr. Peter Ross (Ocean Wise), BCSGA (and various growers) Funding: ACRDP, BCSGA
Microplastics (Sampling Points) • Out-plant: May/Jun • Collection: Aug/Sep • 5 quadrats per site • 12 clams/10 oysters per quadrat
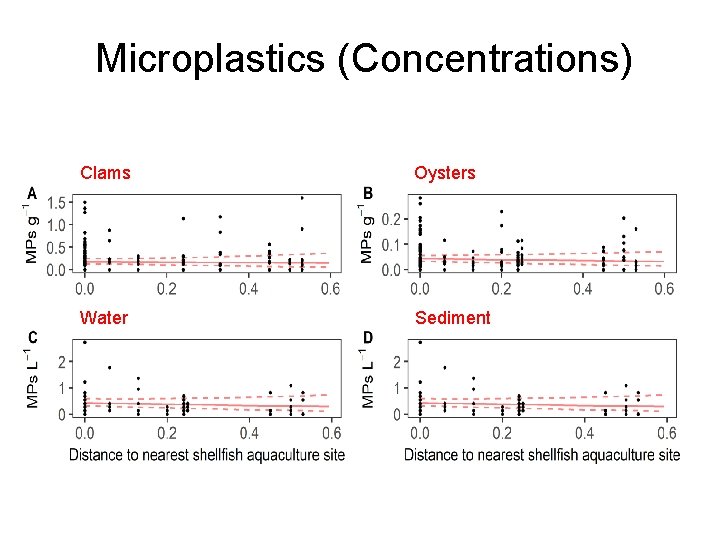
Microplastics (Concentrations)
Microplastics (Concentrations) Clams Oysters Water Sediment
Microplastics (Sizes)
Microplastics (Particle Composition) 44 particles under FTIR: ~73% error rate for shellfish ~83% error rate for water
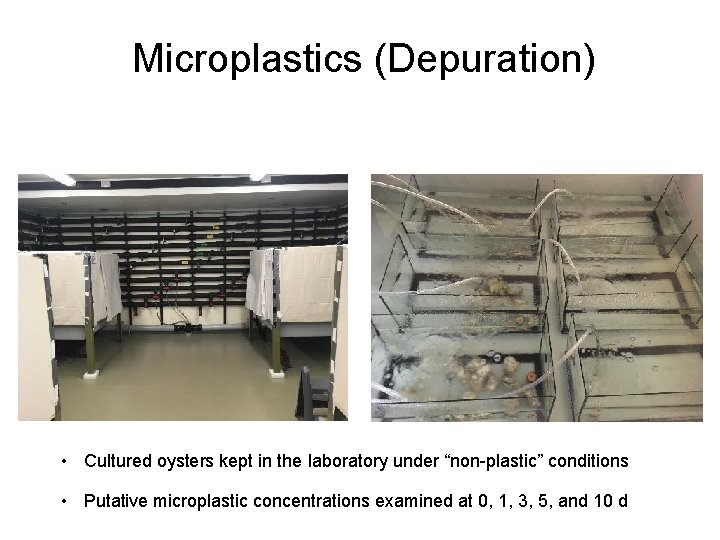
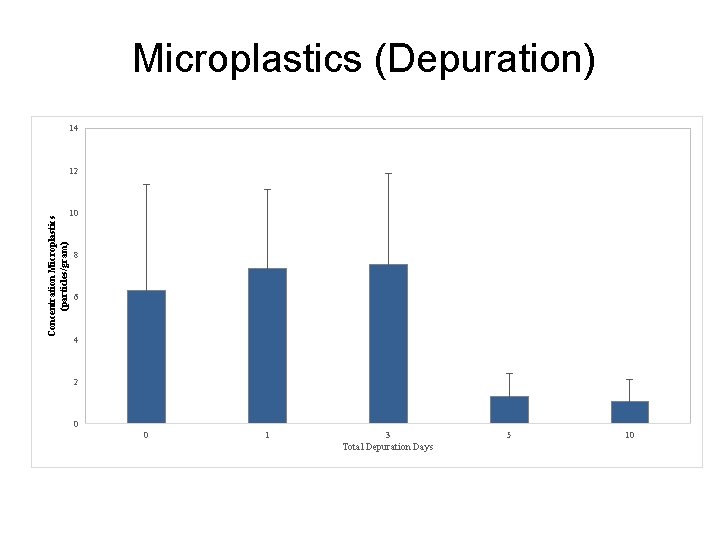
Microplastics (Depuration) • Cultured oysters kept in the laboratory under “non-plastic” conditions • Putative microplastic concentrations examined at 0, 1, 3, 5, and 10 d
Microplastics (Depuration) 14 Concentration Microplastics (particles/gram) 12 10 8 6 4 2 0 0 1 3 Total Depuration Days 5 10
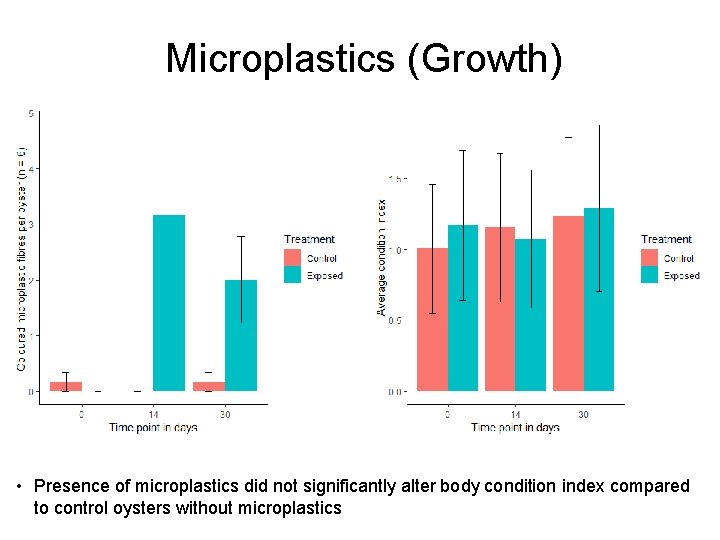
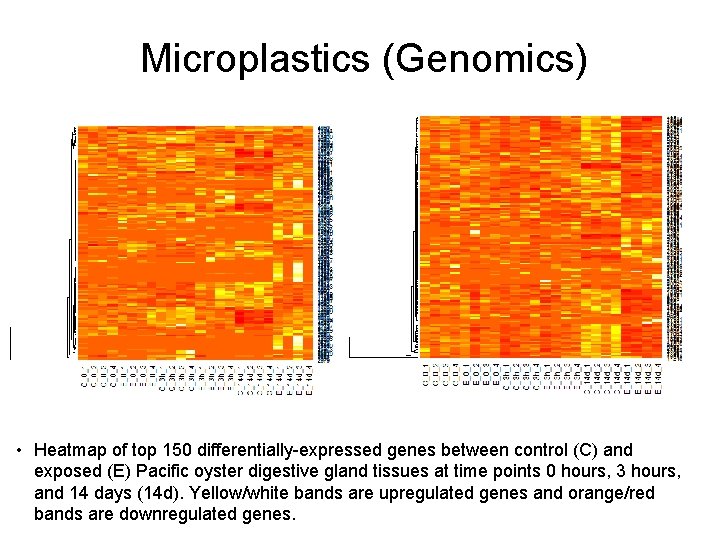
Microplastics (Growth and Genomics) • Shellfish fed microplastic particles in the laboratory at natural concentrations (~5 microplastic particles per liter) versus control animals without microplastic particles • Genomic response examined at 3 hours and 14 days
Microplastics (Growth) • Presence of microplastics did not significantly alter body condition index compared to control oysters without microplastics
Microplastics (Genomics) • Heatmap of top 150 differentially-expressed genes between control (C) and exposed (E) Pacific oyster digestive gland tissues at time points 0 hours, 3 hours, and 14 days (14 d). Yellow/white bands are upregulated genes and orange/red bands are downregulated genes.
Microplastics (Genomics) • Genes involved in immunity, defense, degradation, stress, signaling, wound repair, structural constituents, oxidizing, and cell adhesion had significantly (p ≤ 0. 015) increased levels of gene expression in animals exposed to microplastics compared to those without microplastic exposure.
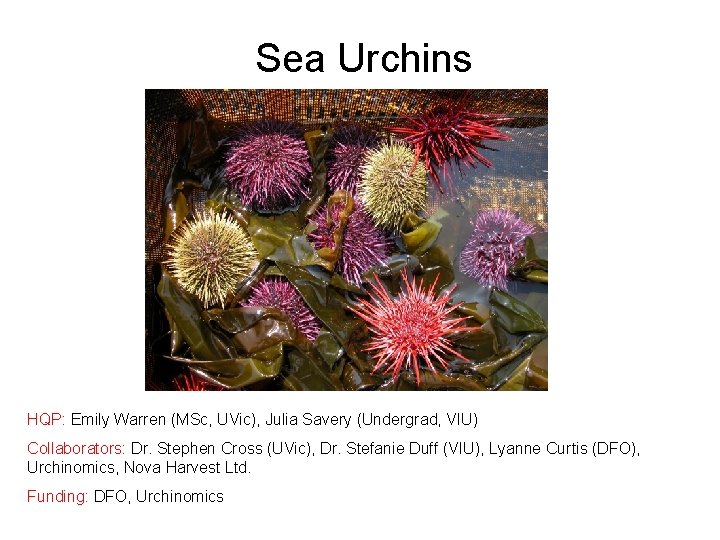
Sea Urchins HQP: Emily Warren (MSc, UVic), Julia Savery (Undergrad, VIU) Collaborators: Dr. Stephen Cross (UVic), Dr. Stefanie Duff (VIU), Lyanne Curtis (DFO), Urchinomics, Nova Harvest Ltd. Funding: DFO, Urchinomics
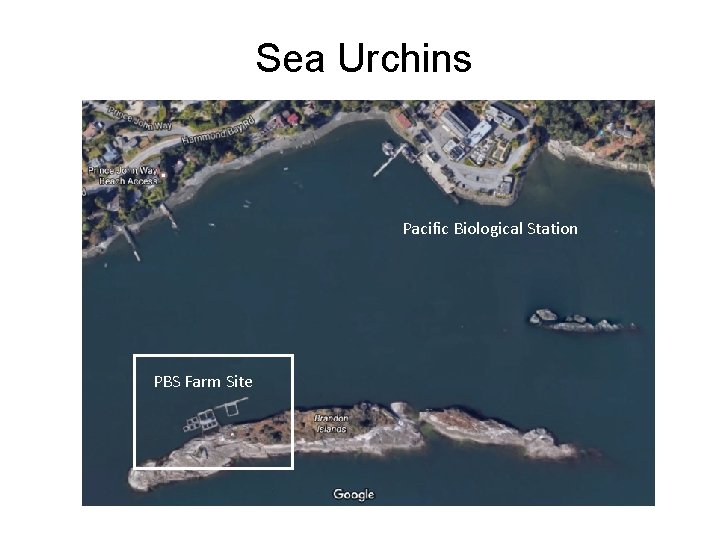
Sea Urchins Pacific Biological Station PBS Farm Site
Sea Urchins Pacific Biological Station PBS Farm Site
Sea Urchins Pacific Biological Station PBS Farm Site
Sea Urchins Pacific Biological Station
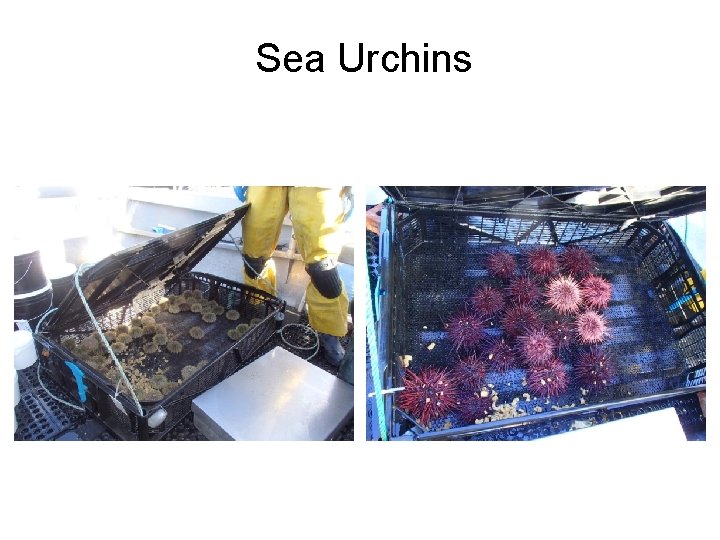
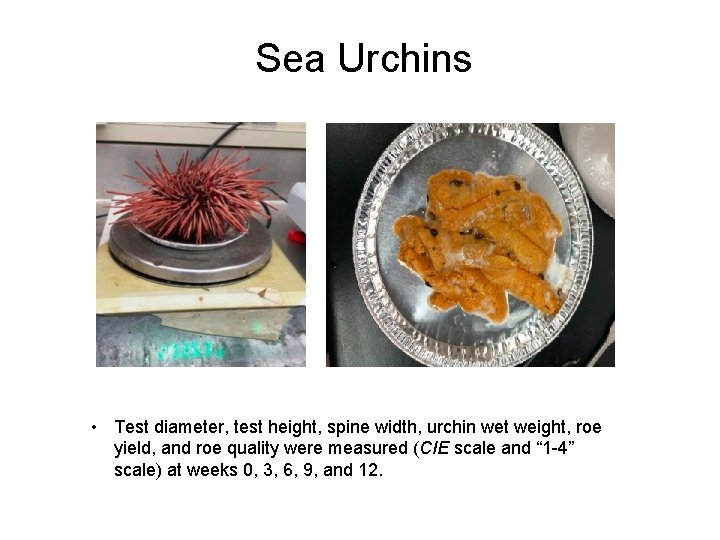
Sea Urchins Pacific Biological Station PBS Farm Site • Test diameter, test height, spine width, urchin wet weight, roe yield, and roe quality were measured (CIE scale and “ 1 -4” scale) at weeks 0, 3, 6, 9, and 12.
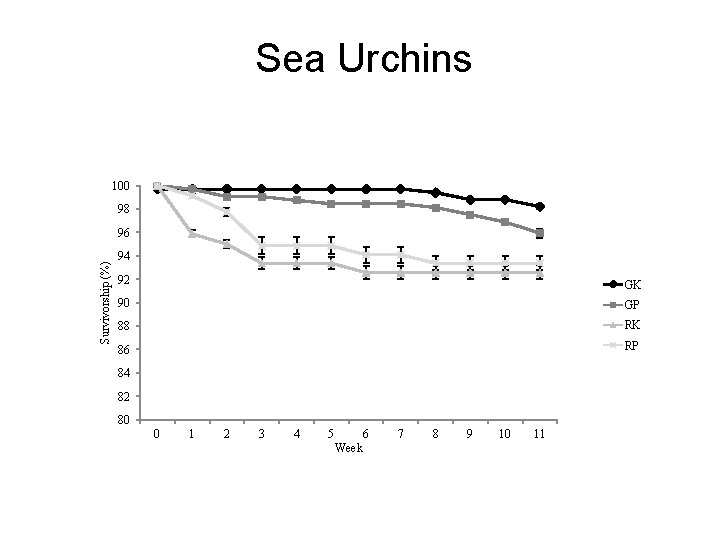
Sea Urchins 100 98 Pacific Biological Station Survivorship (%) 96 94 92 GK 90 GP 88 RK 86 RP 84 82 PBS Farm Site 80 0 1 2 3 4 5 6 Week 7 8 9 10 11
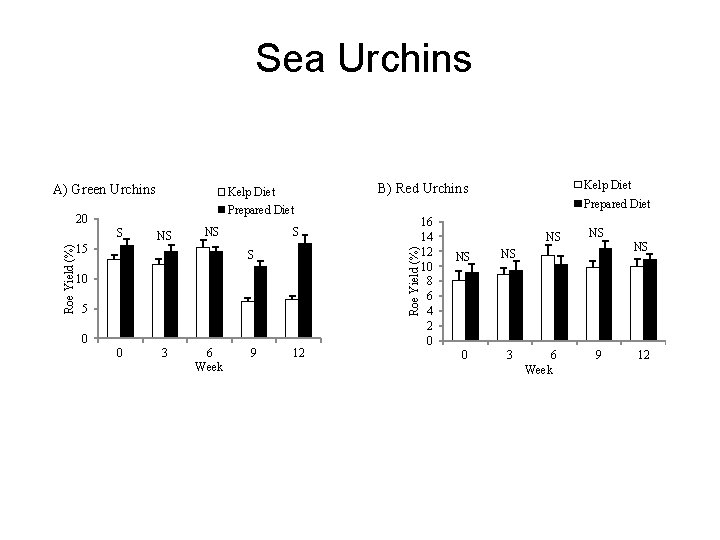
Sea Urchins A) Green Urchins Kelp Diet Prepared Diet Roe Yield (%) S NS NS 15 S S 10 5 0 0 3 6 Week 9 PBS Farm Site Prepared Diet 16 Pacific Biological Station NS 14 Roe Yield (%) 20 12 Kelp Diet B) Red Urchins 12 10 8 6 4 2 0 NS NS 0 3 6 Week NS NS 9 12
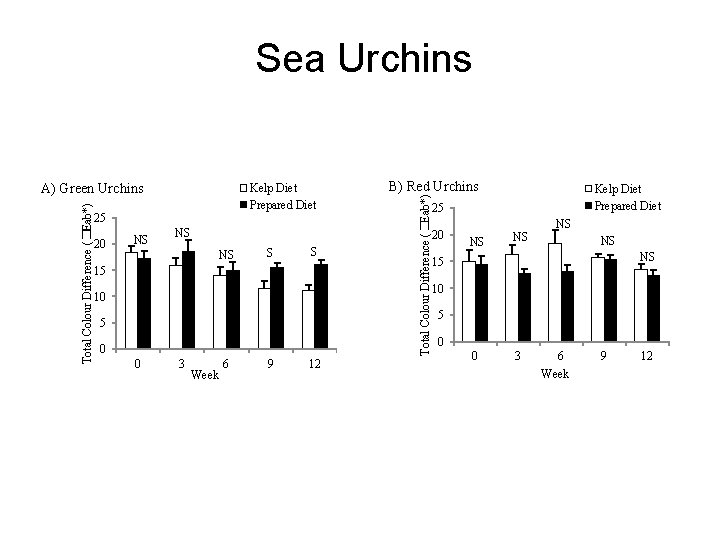
Sea Urchins Kelp Diet Prepared Diet 25 20 NS S S 15 10 5 0 3 Kelp Diet Prepared Diet 25 NS Pacific Station 20 Biological NS NS NS 0 B) Red Urchins Total Colour Difference (�Eab*) A) Green Urchins 6 Week PBS Farm Site 9 12 NS NS NS 15 10 5 0 0 3 6 Week 9 12
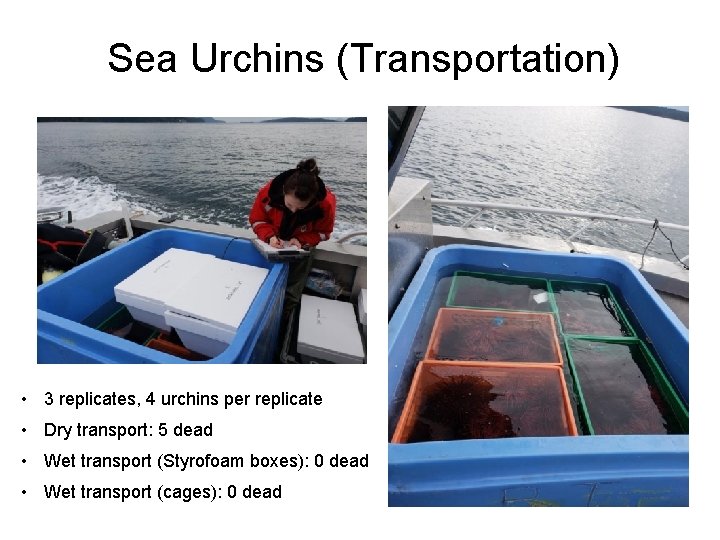
Sea Urchins (Transportation) Pacific Biological Station PBS Farm Site • 3 replicates, 4 urchins per replicate • Dry transport: 5 dead • Wet transport (Styrofoam boxes): 0 dead • Wet transport (cages): 0 dead
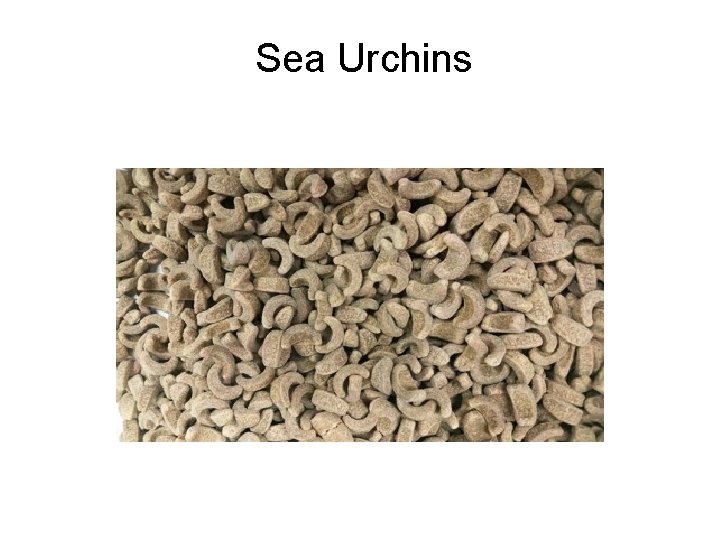
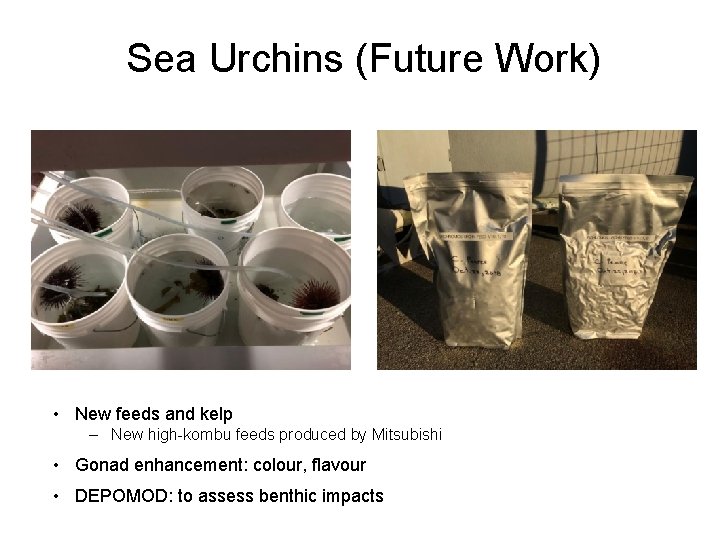
Sea Urchins (Future Work) Pacific Biological Station PBS Farm Site • New feeds and kelp ‒ New high-kombu feeds produced by Mitsubishi • Gonad enhancement: colour, flavour • DEPOMOD: to assess benthic impacts
Sea Cucumbers Pacific Biological Station Photo Credit: Dan Curtis Photo Credit: Dominique Bureau HQP: Dr. Dan Curtis (Post-doc, DFO), Dr. Lucie Hannah (Post-doc, DFO), Paul van Dam-Bates, PBS Farm Site (MSc, UVic), Lindsay Orr (MSc, UVic), Debbie Paltzat (MSc, UBC) Collaborators: Dr. Stephen Cross (UVic), Dr. Laura Cowen (UVic), Dr. Helen Gurney-Smith (VIU/DFO), Dr. Scott Mc. Kinley (UBC), Dr. Penny Barnes (VIU), Klahoose FN, Viking Bay Ventures, Kyuquot SEAfoods Ltd. , Fan Seafoods Ltd. Funding: ACRDP, NSERC, Klahoose FN, Viking Bay Ventures, Kyuquot SEAfoods Ltd. , Fan Seafoods Ltd.
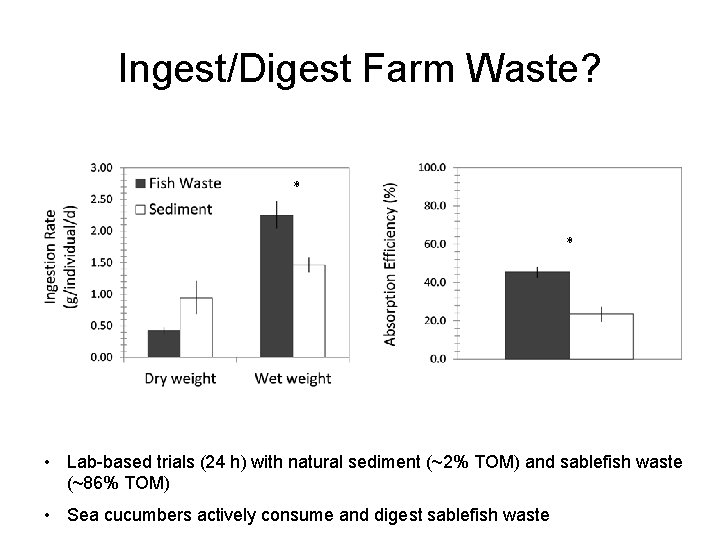
Ingest/Digest Farm Waste? * * • Lab-based trials (24 h) with natural sediment (~2% TOM) and sablefish waste (~86% TOM) • Sea cucumbers actively consume and digest sablefish waste
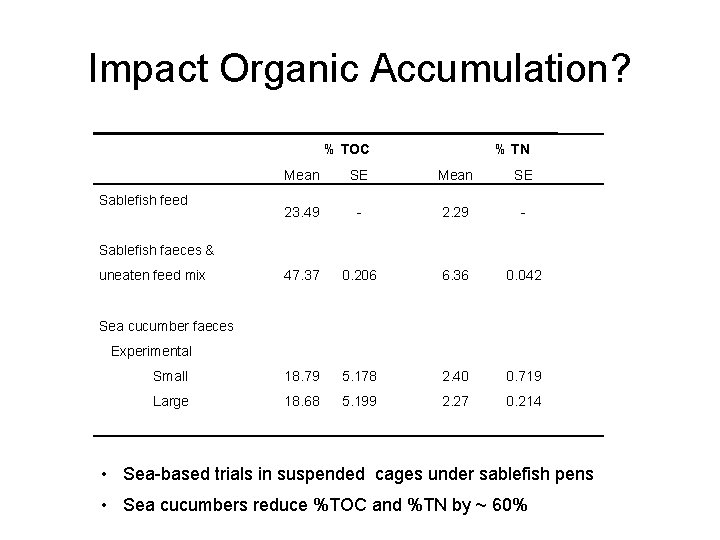
Impact Organic Accumulation? % TOC % TN Mean SE 23. 49 - 2. 29 - 47. 37 0. 206 6. 36 0. 042 Sea cucumber faeces Experimental Sablefish feed Sablefish faeces & uneaten feed mix Small 18. 79 5. 178 2. 40 0. 719 Large 18. 68 5. 199 2. 27 0. 214 • Sea-based trials in suspended cages under sablefish pens • Sea cucumbers reduce %TOC and %TN by ~ 60%
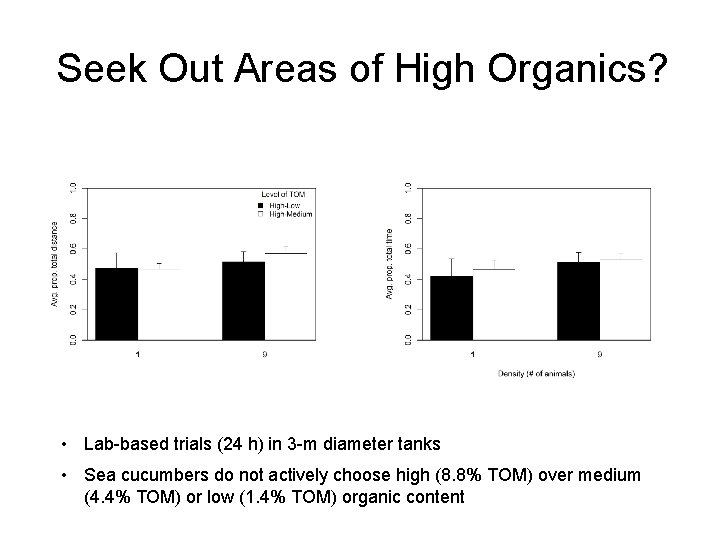
Seek Out Areas of High Organics? • Lab-based trials (24 h) in 3 -m diameter tanks • Sea cucumbers do not actively choose high (8. 8% TOM) over medium (4. 4% TOM) or low (1. 4% TOM) organic content
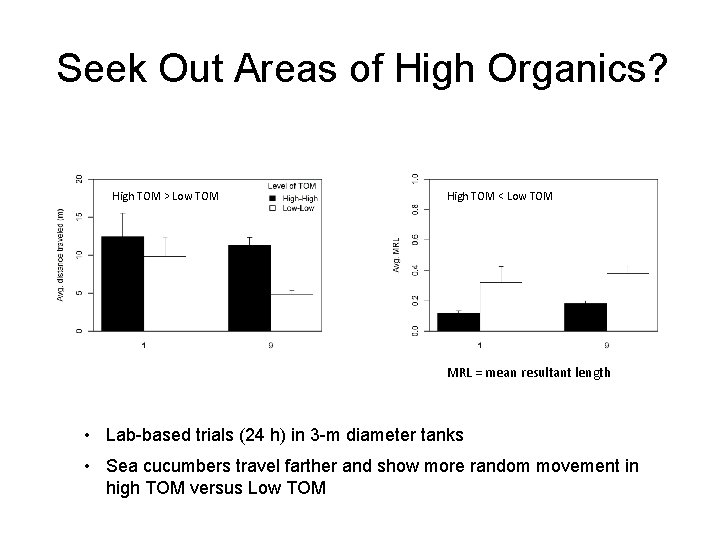
Seek Out Areas of High Organics? High TOM > Low TOM High TOM < Low TOM MRL = mean resultant length • Lab-based trials (24 h) in 3 -m diameter tanks • Sea cucumbers travel farther and show more random movement in high TOM versus Low TOM
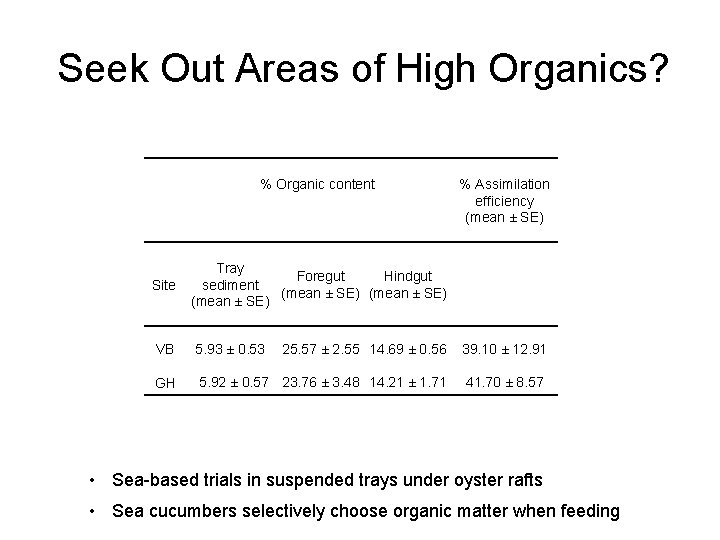
Seek Out Areas of High Organics? Site % Organic content Tray Foregut Hindgut sediment (mean ± SE) % Assimilation efficiency (mean ± SE) VB 5. 93 ± 0. 53 25. 57 ± 2. 55 14. 69 ± 0. 56 39. 10 ± 12. 91 GH 5. 92 ± 0. 57 23. 76 ± 3. 48 14. 21 ± 1. 71 41. 70 ± 8. 57 • Sea-based trials in suspended trays under oyster rafts • Sea cucumbers selectively choose organic matter when feeding
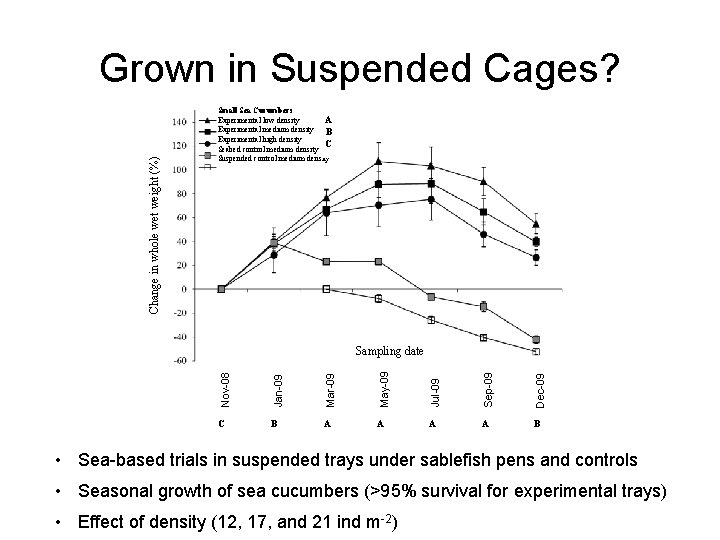
Change in whole wet weight (%) Grown in Suspended Cages? Small Sea Cucumbers Experimental low density A A Experimental medium density B Experimental high density C Seabed control medium density Suspended control medium density Nov-08 Jan-09 Mar-09 May-09 Jul-09 Sep-09 Dec-09 Sampling date C B A A B • Sea-based trials in suspended trays under sablefish pens and controls • Seasonal growth of sea cucumbers (>95% survival for experimental trays) • Effect of density (12, 17, and 21 ind m-2)
Grown in Benthic Cages? • Sea-based trials in benthic cages under oyster rafts and controls • Seasonal growth of sea cucumbers (>85% survival from Apr. 13 to Mar. 14) • Effect of density (1. 5, 5. 9, and 14. 7 ind m-2)
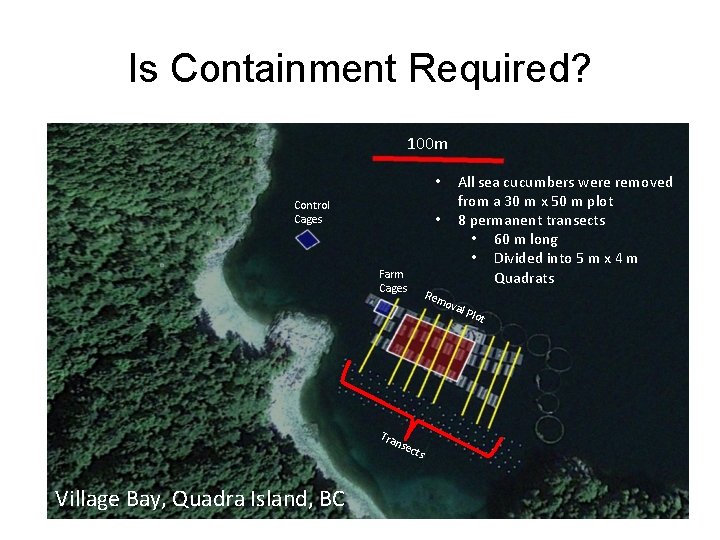
Is Containment Required? 100 m Allsea seacucumberswereremoved • • All fromaa 30 30 mmxx 50 50 mmplot from permanenttransects • • 88 permanent 60 mmlong • • 60 Dividedinto 55 mmxx 44 mm • • Divided Quadrats Control Cages Farm Cages Tra Rem nse ova l Village Bay, Quadra Island, BC cts Plo t
Is Containment Required? 14. 00 12. 00 Density (ind m-2) 10. 00 Inside Plot 8. 00 Outside Plot Entire Site 6. 00 Away from Farm 4. 00 2. 00 0. 00 Feb-12 Sep-12 Mar-13 Oct-13 Apr-14 Nov-14 May-15 • Seasonal shifts in density suggest that sea cucumbers leave the farm in the winter • Movement back in spring/summer could be from off tenure and/or drop off from oyster gear
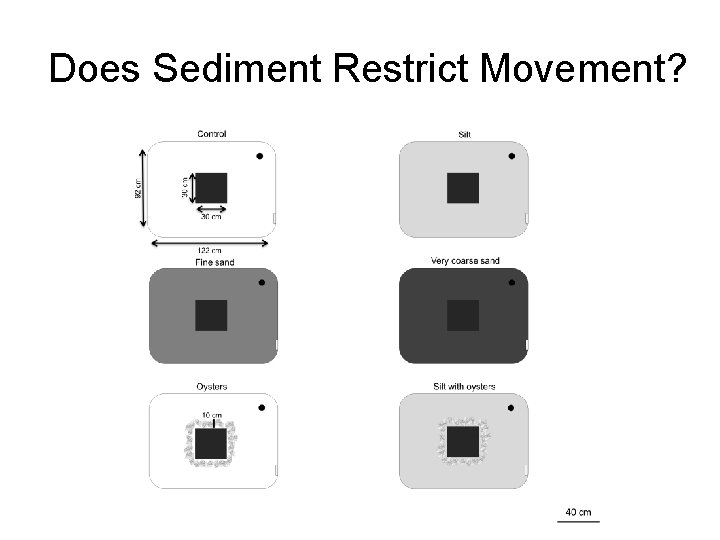
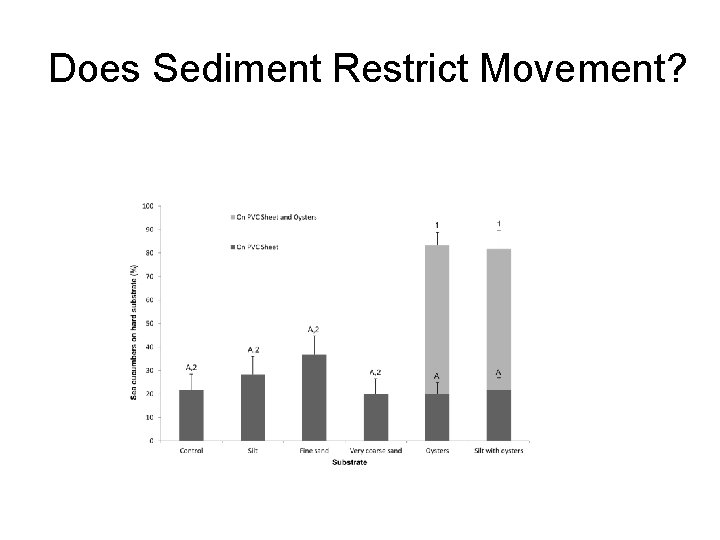
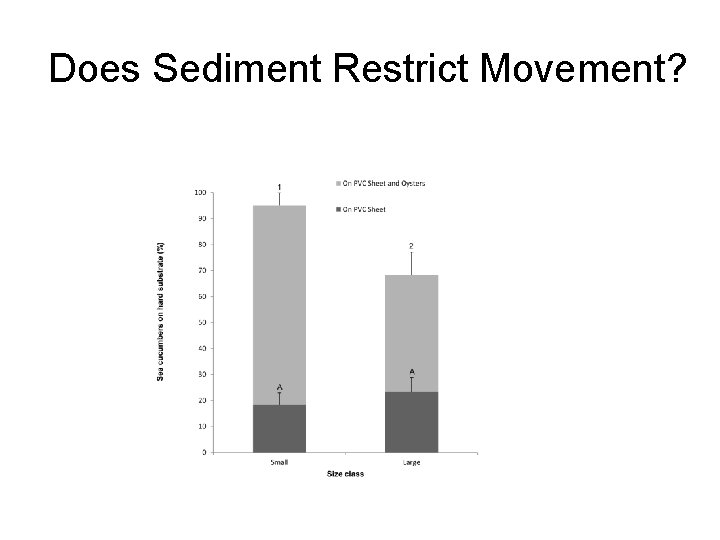
Does Sediment Restrict Movement?
Does Sediment Restrict Movement?
Does Sediment Restrict Movement?
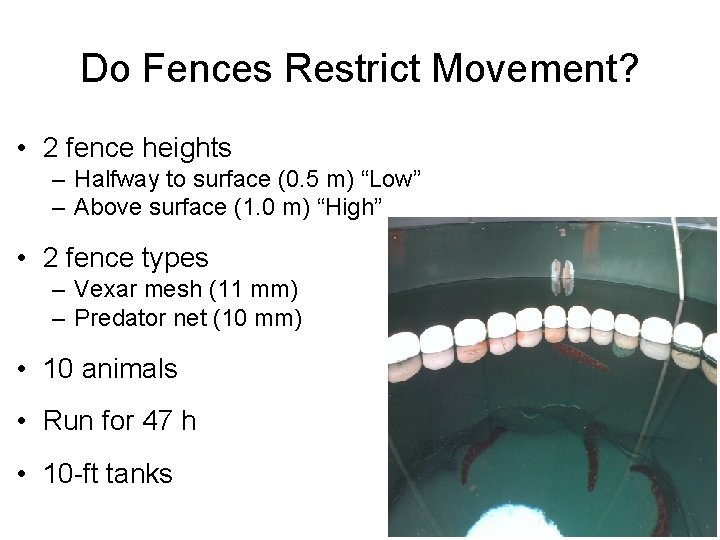
Do Fences Restrict Movement? • 2 fence heights – Halfway to surface (0. 5 m) “Low” – Above surface (1. 0 m) “High” • 2 fence types – Vexar mesh (11 mm) – Predator net (10 mm) • 10 animals • Run for 47 h • 10 -ft tanks
Do Fences Restrict Movement? The only effective fencing is above the water surface.
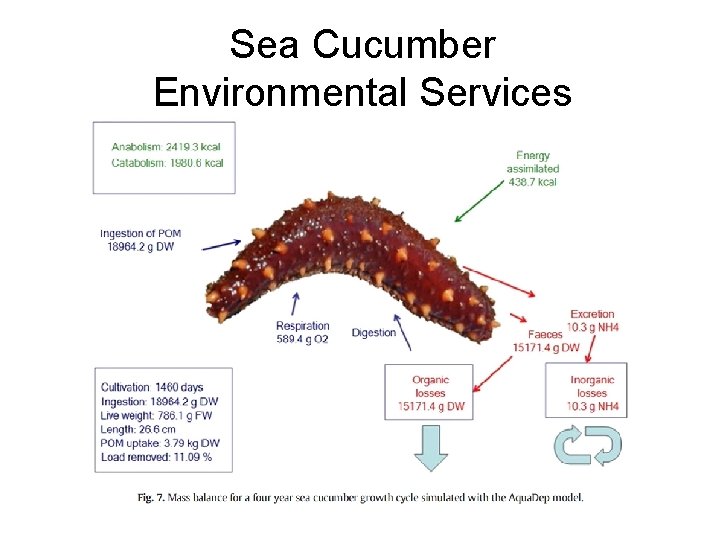
Sea Cucumber Environmental Services
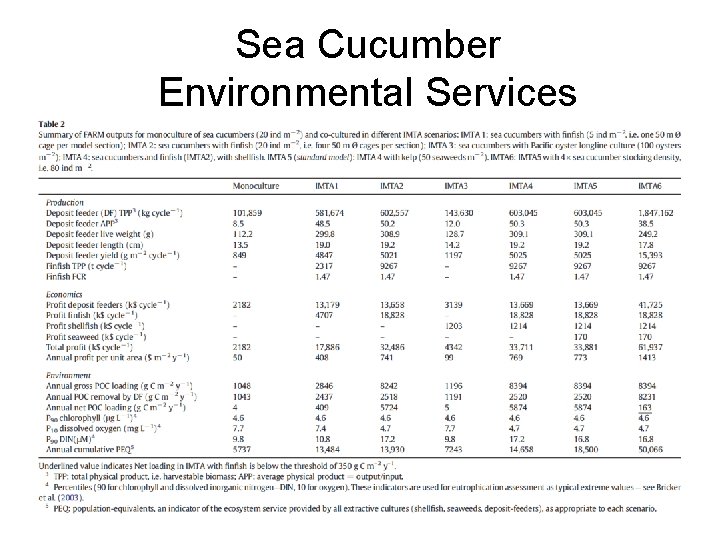
Sea Cucumber Environmental Services
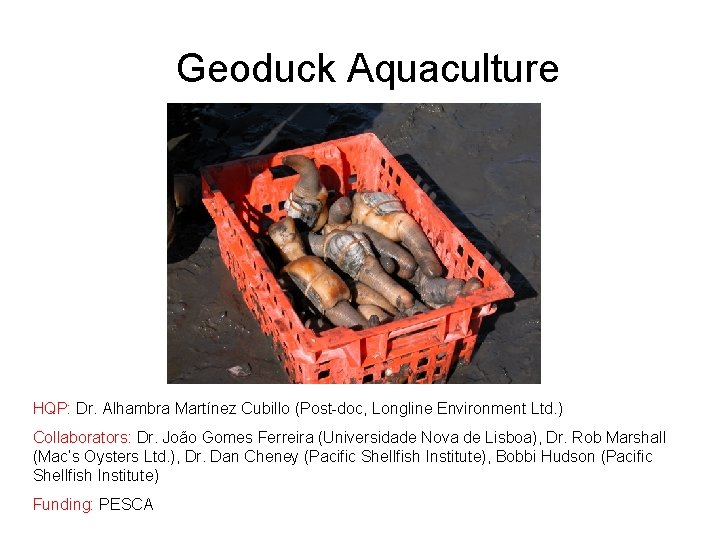
Geoduck Aquaculture HQP: Dr. Alhambra Martínez Cubillo (Post-doc, Longline Environment Ltd. ) Collaborators: Dr. João Gomes Ferreira (Universidade Nova de Lisboa), Dr. Rob Marshall (Mac’s Oysters Ltd. ), Dr. Dan Cheney (Pacific Shellfish Institute), Bobbi Hudson (Pacific Shellfish Institute) Funding: PESCA
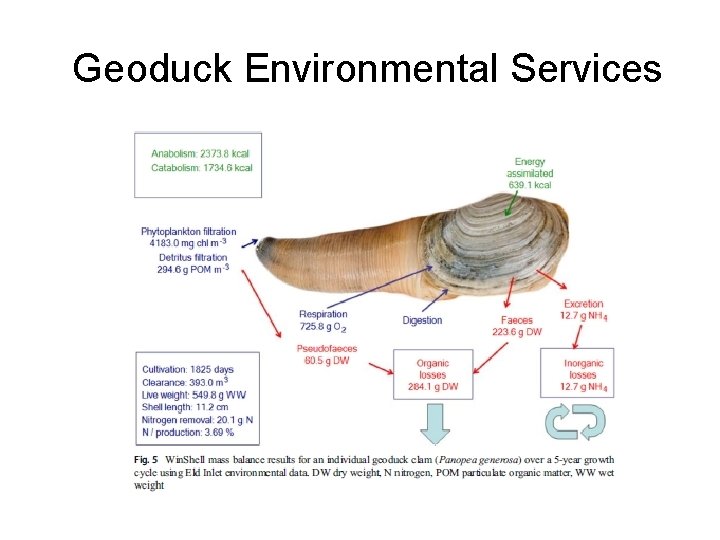
Geoduck Environmental Services
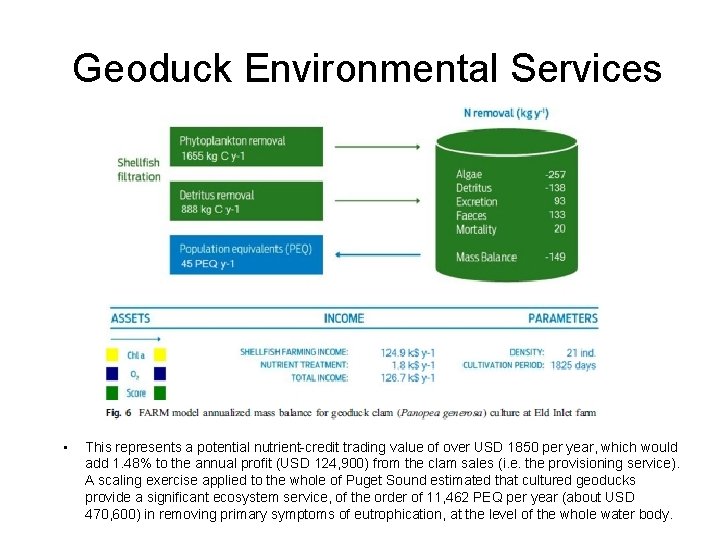
Geoduck Environmental Services • This represents a potential nutrient-credit trading value of over USD 1850 per year, which would add 1. 48% to the annual profit (USD 124, 900) from the clam sales (i. e. the provisioning service). A scaling exercise applied to the whole of Puget Sound estimated that cultured geoducks provide a significant ecosystem service, of the order of 11, 462 PEQ per year (about USD 470, 600) in removing primary symptoms of eutrophication, at the level of the whole water body.
Shellfish Aquaculture and AIS HQP: Julia Savery (Undergraduate, VIU) Collaborators: Dr. Tom Therriault (DFO), Lyanne Curtis (DFO), Vanessa Hodes (DFO), Jocelyn Nelson (DFO), Callie Wasser (DFO) Funding: SPERA
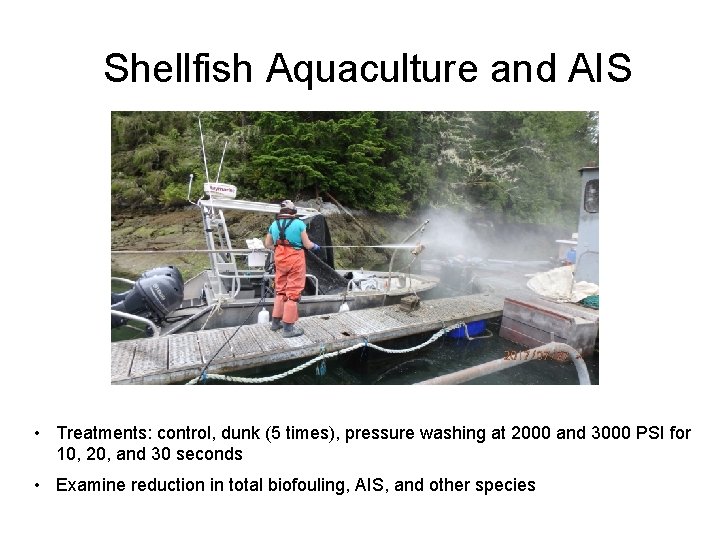
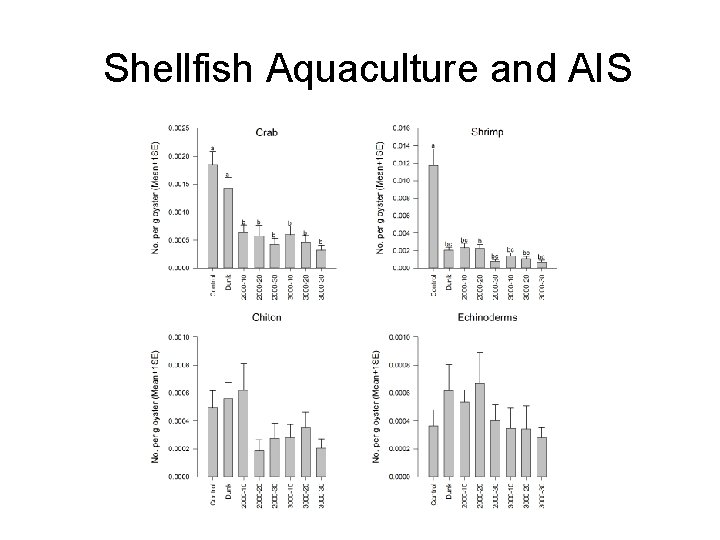
Shellfish Aquaculture and AIS • Treatments: control, dunk (5 times), pressure washing at 2000 and 3000 PSI for 10, 20, and 30 seconds • Examine reduction in total biofouling, AIS, and other species
Shellfish Aquaculture and AIS
Shellfish Aquaculture and AIS
Questions?