Analyst Roundtable Vicki Livingston Head of Communications Analyst

Analyst Roundtable Vicki Livingston Head of Communications & Analyst Relations 4 G Americas 262 242 3458 office 414 688 9000 mobile www. 4 gamericas. org

Bringing M 2 M into the Home: The Consumer Perspective Jennifer Kent Research Analyst Digital Health and Mobile Product Research Parks Associates

The Consumerization of M 2 M • M 2 M industry has traditionally been B 2 B or B 2 B 2 C • As more devices gain embedded connectivity, M 2 M increasingly touches the consumer directly, especially in and around the home • Consumers will expect smartphones and tablets to be the control center of their digital lives • M 2 M services with consumers as end-users include: – – Connected home services Wireless health care Connected cars Retail
 (Among U. S. Broadband Households) Laptop")
Connected CE Adoption in U. S. (Q 1/12) (Among U. S. Broadband Households) Laptop computer Home network router Desktop computer Smartphone Connected Game Console Tablet e-Book Reader Smart TV Connected PVR/DVR/Ti. Vo Connected Blu-ray player Networked security camera Connected digital media receiver 82% 78% 57% 31% 27% 22% 18% 16% 10% 8% 0% Sources: Consumer Decision Process – Core Study, 2012 ©Parks Associates, 2012 Untapped Consumer Opportunities for Mobile Services, ©Parks Associates, 2012 50% % Owning Specified Devices 100%

Interest in Home Control from Mobile Phones (Among U. S. BB HHs Without a Home Control System) Door locks 20% 18% Thermostat Lights 17% Security cameras 16% 9% Home appliances Window shades 8% Flood detector 8% Sprinkler system 8% 0% 5% 10% 15% % Very Interested (Rating 6/7) Source: Consumer Decision Process – Core Study, 2012 ©Parks Associates 20% 25%

Connected Home Services Parks Associates estimates bundled IP home services currently stand at ~ 500 K U. S. subscribers but projects adoption will hit 18 -20 M households by 2020 Operators with home broadband or pay-TV presence have credible connected home plays, and can leverage LTE networks to support connected home initiatives in the long run
 (Among U. S. BB HHs) 60% %")
Interest in Wireless Health Services (Q 4/11) (Among U. S. BB HHs) 60% % Finding Service "Very Appealing", Rating 6/7 on a 7 -pt. Scale 50% Independent Living Services 50% 42% Vital Care Services 40% 33% 32% 30% 19% 20% 16% 10% 0% Caretakers Prospective Caretakers Source: IP Monitoring, Access and Controls, ©Parks Associates, 2011. Others

% "Very Willing" to Pay for Service, Rating 6/7 on a 7 -pt. Scale 40% Willingness to Pay for Health Monitoring (Q 4/11) (Among Caregivers in U. S. BB HHs) 35% 31% 29% 30% 20% Motion-sensing fall detection program Telehealth service Source: IP Monitoring, Access and Controls, ©Parks Associates, 2011. Location-tracking service

Ron Gherman

M 2 M – From Millions to Billions! Making Lives Better

The M 2 M Ecosystem – Devices, Networks, and Apps * Other mobile operators such as Leap Wireless International, U. S. Cellular, and Metro PCS Wireless, Inc. ** Other application service providers such as Securus, Inc. , and Geotab, Inc Source: Frost & Sullivan

Cellular M 2 M Communications - Market Forecasts Source: Frost & Sullivan Direct M 2 M connections on cellular networks in North America to approach 75 -80 million in 2018. These figures do not include laptops, netbooks, notebooks and tablets, which would be in excess of 50 million.

Cellular M 2 M Communications – State of the Industry Source: Frost & Sullivan

M 2 M Cloud – A Key Enabler of Innovative M 2 M Apps Saa. S - Applications, User Interfaces, Data Presentation Paa. S - Middleware, APIs, Application Integration Iaa. S - Computing , Storage, Connectivity Resources Source: Frost & Sullivan Millions of M 2 M connections will generate Trillions of transactions supported/measured on M 2 M cloud platforms. This also speaks to the market opportunity for M 2 M cloud vendors.

Conclusions q The M 2 M industry continues to work tirelessly to maximize the M 2 M opportunity. q. Migration from “products” to “solutions” is a noticeable trend. q Mobile operators and M 2 M Solution Providers are key to market growth. q Ease of deployment , and ease of management of existing implantations will be the key to achieving long-term success in this market. q Frost & Sullivan continues to hold that both direct connections and aggregate revenues from M 2 M could become larger than traditional mobile phone business in North America– this could take 20 -25 years.
 247 -3826 ron. gherman@frost. com 17")
Contact Information Ron Gherman Consultant (210) 247 -3826 ron. gherman@frost. com 17

James Brehm Senior Strategist and Technology Evangelist 210. 639. 3829 jbrehm@compassintelligence. com

About Compass Intelligence, a global consulting and market analytics firm, specializes in segment and vertical market intelligence for the hightech and telecom industries; and offers clients a tailored research experience through excellent customer support. Compass Intelligence provides subscriptions and research reports, insight videos, forecasts, competitive analysis, market data and expert recommendations on multiple markets. Find us on http: //www. compassintelligence. com or follow us on Twitter(www. twitter. com/Compass. Intel).

If M 2 M were a football game, what quarter are we in?

Training Camp!

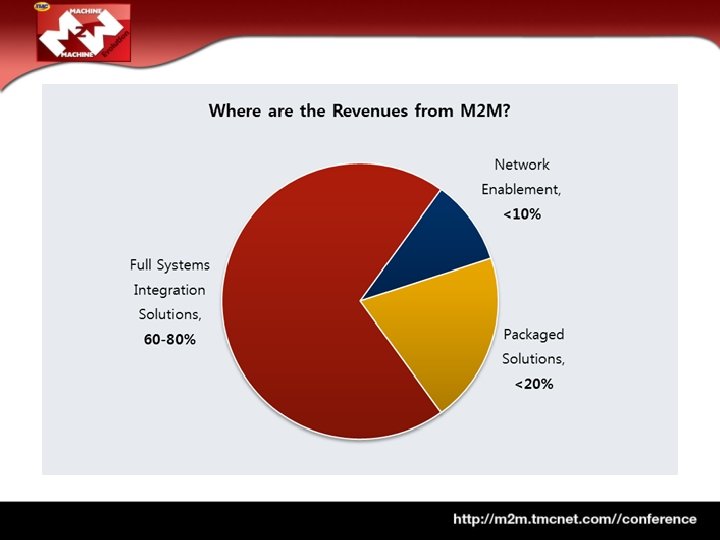
Why deploy M 2 M? Market or Revenue Growth Cost Reduction

How big is the market opportunity?

“Soon, there will be more than one trillion connected devices…” IBM TV Commercial “…there will be 50 Billion connected devices by 2020. ” Hans Vestberg, CEO of Ericsson “In this model, there is literally no limit on the number of connections that can be part of the mobile grid: cars, appliances, buildings, roads, sensors, medical monitors and someday even inventories on supermarket shelves. All of these have the potential to become inherently intelligent — perpetually connected nodes on the mobile web. ” Ivan Seidenberg, CEO of Verizon “When you look at the numbers between M 2 M and social networking companies, Linked. In counts as its market every professional on the planet; that’s 1 billion people. Facebook is a little bit more ambitious, it counts as a potential customer over 2 billion internet users and counting. But if you look at M 2 M, we have a market which consists of over 7 trillion machines…” Dale Calder, Founder of Axeda “Once you embed it [wireless M 2 M application] in a business process, for example, customers are probably not going to rip you [out] when your annual contract is up. ” Sprint Nextel Corp

Hype or Reality? High Growth Above 14 percent Medium Growth 7 -14 percent Low Growth Less than 7 percent Declining Market M 2 M Tablet Computing Contextual Computing Technology Trigger Crest of Inflated Expectations Landlines Netbook and Smartbook Feature Phones Smartphones Depression of Expectations Educated Decisionmaking Product Maturity

Are the numbers any good?

Many Numbers are Simply Wrong

Vehicle Telematics is the largest segment in the M 2 M market. Just 4% of consumer vehicles and less than 20% of fleets currently connected, the market potential is enormous!

Automotive, Transportation and Distribution 6, 83% 7, 39% Smart Grid Security 9, 09% 1, 00% m. Health 57, 24% 14, 15% RMAC Transaction Terminals 4, 31% MVNO / TSP


• ARPU’s range from $1 to $20 • One of the goals of service providers who have to invest in spectrum should be in efficiently utilizing the spectrum • It’s about the cost per KHz of spectrum • Compass is wondering if AMPU is not a better measure of success

Multivendor M 2 M Solution Development Process Fast Pitch & Executive Sponsorship Platforms IDEA CONCEPTUALIZATION Hardware Applications Create a proofof-concept & prototype Developers Bring Disparate Hardware companies and Software developers together 6 Weeks Certification Go To Market Beta Testing 8 -12 Weeks 8 -10 Weeks

§ Reasons to use Location Based Services for asset tracking – – – Lost goods Fewer future thefts Improved efficiencies Shorter time to market Safety Convenience Green Fuel savings Staffing Fleet management Brand protection More

Focusing on Transportation and Logistics • Roads and Vehicles: 4 M miles of roads, 254 M vehicles, 11. 8 M heavy trucks and busses • Rail: 140, 000 miles of railroad tracks and 1. 4 M rail cars • Air: 5, 200 airports including 5 of the 25 largest in terms of air freight and 13 of the top 25 in terms of passenger traffic • Pipeline: 1. 7 M miles of gas and oil pipelines • Waterways: 25, 000 miles of navigable waterways • Shipping Containers: 14. 8 M TEUs globally. (At any time, over 1/4 could be in the United States or inbound to the United States. )

James Brehm Senior Strategist and Technology Evangelist 210. 639. 3829 jbrehm@compassintelligence. com
- Slides: 37