Journalism 614 Sampling and NonResponse Sampling Probability Sampling

Journalism 614: Sampling and Non-Response

Sampling ¨ Probability Sampling – Based on random selection ¨ Non-probability sampling – Based on convenience
 ¨ Literary Digest: post cards to voters")
Sampling Miscues: Alf Landon for President (1936) ¨ Literary Digest: post cards to voters in 6 states – Correctly predicting elections from 1920 -1932 • Names selected from telephone directories and automobile registrations – In 1936, they sent out 10 million post cards • Results pick Landon 57% to Roosevelt 43% – Election: Roosevelt in the largest landslide • Roosevelt 61% of the vote and 523 -8 in Elect. Col. ¨ Why so inaccurate? : Poor sampling frame – Leads to selection of wealthy respondents
 ¨ Gallup picks winner 1936 -1944")
Sampling Miscues: Thomas E. Dewey for President (1948) ¨ Gallup picks winner 1936 -1944 – Use quota sampling: • matches sample characteristics to population – Gallup quota samples on the basis of income ¨ In 1948, Gallup picked Dewey to defeat Truman – Reasons: • 1. Most pollsters quit polling in October • 2. Undecided voters went for Truman • 3. Unrepresentative samples—WWII changed society since census

Non-probability Sampling ¨ In situations where sampling frame for randomization doesn’t exist ¨ Types of non-probability samples: – 1. Reliance on available subjects • convenience sampling – 2. Purposive or judgmental sampling – 3. Snowball sampling – 4. Quota sampling

Reliance on Available Subjects ¨ Person on the street, easily accessible ¨ Examples: – Mall intercepts, college students, e-polls ¨ Frequently used, but usually biased ¨ Notoriously inaccurate – Especially in making inferences about larger population, even with many respondents

Purposive or Judgmental Sampling ¨ Dictated by the purpose of the study – Situational judgments about what individuals should be surveyed to make for a useful or representative sample • E. g. , Using college students to study third-person effects regarding rap and metal music – 3 pe: Others are more affected by exposure than self • Assessing effects on self and others – Using college students makes for homogeneity of self

Snowball Sampling ¨ Used when population of interest is difficult to locate – E. g. , homeless people, meth addicts ¨ Research collects data from of few people in the targeted group – Initially surveyed individuals asked to name other people to contact • Good for exploration • Bad for generalizability

Quota Sampling ¨ Begins with a table of relevant characteristics of the population – Proportions of Gender, Age, Education, Ethnicity from census data – Selecting a sample to match those proportions ¨ Problems: – 1. Quota frame must be accurate – 2. Sample is not random, but can be representative

Probability Sampling ¨ Goal: Representativeness – Sample resembles larger population ¨ Random selection – Enhancing likelihood of representative sample – Each unit of the population has an equal chance of being selected into the sample

Population Parameters ¨ Parameter: Summary statistic for the population – E. g. , Mean age of the population ¨ Sample allows parameter estimates – E. g. , Mean age of the sample • Used as an estimate of the population parameter

Sampling Error ¨ Every time you draw a sample from the population, the parameter estimate will fluctuate slightly – E. g. : • Sample 1: Mean age = 37. 2 • Sample 2: Mean age = 36. 4 • Sample 3: Mean age = 38. 1 ¨ If you draw lots of samples, you would get a normal curve of values

Normal Curve of Sample Estimates Frequency of estimated means from multiple samples Likely population parameter Estimated Mean

Error and Sample Size ¨ As the sample size increases: – The error decreases – In other words, large sample estimate is likely to be closer to the population parameter – As the sample size increases, we get more confident in our parameter estimate

Confidence Interval ¨ Interval width at which we are 95% confident the estimate contains the population parameter ¨ For example, we predict that Candidate X will receive 45% of the vote with a 3% confidence interval – We are 95% sure the parameter will be between 42% and 48% – The “margin of error” in a poll ¨ Confidence interval shrinks as: – Error is smaller – Sample size is larger

Sample Size & Confidence Interval ¨ How precise does the estimate have to be? – More precise: larger sample size ¨ Larger samples increase precision – But at a diminishing rate – Each unit you add to your sample contributes to the accuracy of your estimate • But the amount it adds shrinks with additional unit added

95% Confidence Intervals Sample Size % split N= 100 N= 200 N= 300 N= 400 N= 500 N= 700 N= 1000 N= 1500 50/50 10. 0 7. 1 5. 8 5. 0 4. 5 3. 8 3. 2 2. 6 70/30 9. 2 6. 5 5. 3 4. 6 4. 1 3. 5 2. 9 2. 4 90/10 6. 8 4. 2 3. 5 3. 0 2. 7 2. 3 1. 9 1. 5

Describe Sampling Frame ¨ List of units from which sample is drawn – Defines your population – E. g. , List of members of population ¨ Ideally you’d like to list all members of your population as your sampling frame – Randomly select your sample from that list ¨ Often impractical to list entire population

Sampling Frames for Surveys ¨ Limitations of the telephone book: – Misses unlisted numbers/mobile numbers – SES and age bias: • Poor people may not have phone • Less likely to have multiple phone lines • Young people have mobile phone numbers ¨ Most studies use a technique such as Random Digit Dialing as a way around this

Types of Sampling Designs ¨ Simple Random Sampling ¨ Systematic Sampling ¨ Stratified Sampling ¨ Multi-stage Cluster Sampling

Simple Random Sampling ¨ Establish a sampling frame – A number is assigned to each element – Elements randomly selected into the sample – Use a random number generator to select every case you need for inclusion.

Systematic Sampling ¨ Establish sampling frame – Select every kth element with random start – E. g. , 1000 on the list, choosing every 5 th name yields a sample size of 200 ¨ Sampling interval: standard distance between units for the sampling frame – Sampling interval = pop. size / sample size ¨ Sampling ratio: proportion of pop. selected – Sampling ratio = sample size / population size

Stratified Sampling ¨ Modification used to reduce potential for sampling error – Research ensures that certain groups are represented proportionately in the sample • E. g. , If the population is 60% female, stratified sample selects 60% females into the sample • E. g. , Stratifying by region of the country to make sure that each region is proportionately represented

Cluster Sampling ¨ Frequently, there is no convenient way of listing the population for sampling – E. g. , Sample of Dane County or Wisconsin • Hard to get a list of the population members ¨ Cluster sample – Sample of census blocks • List of census blocks, list people for selected blocks • Select sub-sample of people living on each block

Multi-stage Cluster Sample ¨ Cluster sampling done in a series of stages: – List, then sample within ¨ Example: – Stage 1: Listing zip codes • Randomly selecting zip codes – Stage 2: List census blocks within selected zip codes • Randomly select census blocks – Stage 3: List households on selected census blocks • Randomly select households – Stage 4: List residents of selected households • Randomly select person to interview

Nonresponse ¨ Declining contact and cooperation rates – Especially for “gold standard” RDD National Telephone Surveys ¨ Early research suggests the issues are rather small, with little bias on results – Examined by comparing “easy to contact” individuals to “hard to contact” – More systematic version is to compare between standard 5 -day and “rigorous” survey

Accelerating Problem ¨ Survey firms reporting increasingly high rates of non-contact and non-cooperation – Americans leading increasingly busy lives – More and more unsolicited calls to home – Sophisticated technologies to avoid calls ¨ Big drop offs in last 15 -20 years – Call screening (I only take known callers) – Cell phones (I pay for minutes during survey)

Hard to Gauge the Effect ¨ Initial work conducted in late 90 s ¨ Curtain et al - Low effort “restricted call” design versus high effort “all call” design – See no difference in population estimates ¨ Keeter et al – Two parallel surveys, one using standard 5 day vs. “rigorous” – On average, a two percentage point difference ¨ Seem to suggest that lower response rate does not effect survey quality

Non-response in this Century ¨ Lot has changed in last decade + – More legislative restrictions – More mobile technologies – More VOIP technologies ¨ Re-ran the study and found similar results comparing 5 -day and rigorous – 5 -day – 10 call backs, one refusal conversion – Rigorous – 21 weeks, advance letters, left messages, additional call backs, etc. – Little difference in findings

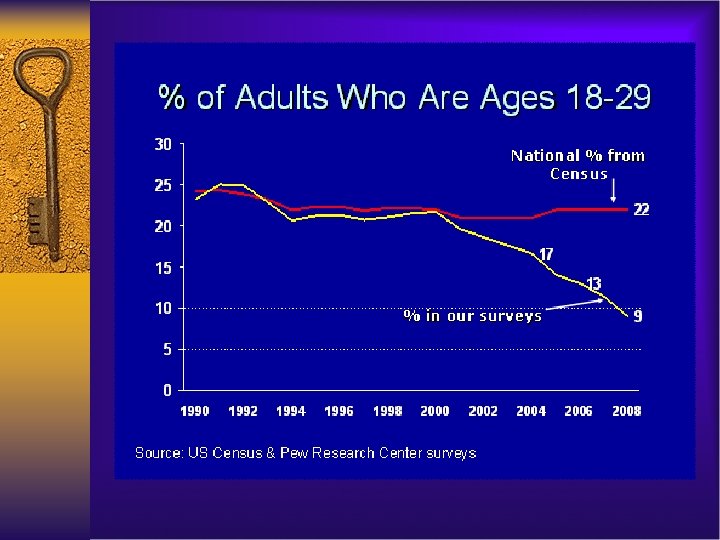
The Problem of Cell Phones ¨ In 2006, 13% of cell phone only HHs – Increasing 1% every six months 2003 -2006 – Increasing 2% every six months after 2006 • By 2015, 46% of U. S. Adults Live In Cellphone-Only HHs • 64% of Millennials (born 1977 -1994) are Cellphone-Only ¨ Bias in terms of who is missed is most prominent among young people. – “Serious coverage problem” – “Particular challenge”

Big differences in wireless only HHs by Age and SES Only 16% of those 65+ Nearly 70% among 25 -29 Just over 40% among “not poor” Over 50% for “near poor” Nearly 60% for the “poor” This creates systematic biases

Some substantial differences ¨ Big differences between cell and non-cell respondents to a range of questions ¨ Especially for issues that affect younger people, and behaviors such as voting – Register to vote? – Political knowledge? – Media usage?

Strive for Higher Response Rate

To Achieve a High Response Rate ¨ Incentives: gifts or drawings for completion – prize drawing vs smaller incentives to alll – donating to a charity as an inducement – Run experiments to see which incentive works ¨ Online: pre-invitation and landing page – Test different versions to see what encourages respondents to click on survey link (online) ¨ Reminders and follow-ups to boost response – In general, you only want to send one or two email reminders. ¨ Make online survey friendly for all devices/browsers. – Make it usable on mobile or tablet. See if there is a high bounce rate from particular devices
- Slides: 36