INVESTIGATING THE EFFECT OF TEMPERATURE ON Initial Rate


 2. Initial")


 – the stopwatch may not")

- Slides: 21
INVESTIGATING THE EFFECT OF TEMPERATURE ON Initial Rate of Linked to global warming ENZYME ACTIVITY Investigating climate change Read the student sheet Make yourself a summary sheet to complete or use the handout • Title • Aim • Hypothesis • IV: range of values you will use • DV: range of values you might find • Apparatus • Method • Risk assessment/minimize risks • Control variables and how they will be kept CONSTANT • Control? What is it? • Results: what measurements you will make and how • Process Results: table/how will you look at results? Initial rate of reaction and Q 10 • Replicates • Sources of error and minimised
Core practicals Mathematical skills Investigate a factor affecting the initial rate of an enzyme– controlled reaction. • Tabulating data, calculating of rate, plotting a suitable graph, determining initial rate by drawing a tangent.
Catalase: • The fastest known enzyme • Catalase is one of the most potent catalysts known. The reactions it catalyses are crucial to life. • Catalase catalyses conversion of Hydrogen Peroxide, a powerful and potentially harmful oxidizing agent, to water and molecular oxygen • The number of molecules of hydrogen peroxide catalysed by the enzyme catalase extracted from liver cells is 6 x 10⁶ in one minute • Source of catalase is peas: when peas are added to hydrogen peroxide (substrate) oxygen is produced (and water) • Let us watch https: //www. youtube. com/watch? v=c. YFxr. ZDwork
TITLE: To investigate the effect of temperature on the initial rate of reaction of an enzyme-controlled reaction. • Aim: To investigate the effect of temperature on the initial rate of an enzyme-catalysed reaction. • Independent Variable: Temperature of each enzyme solution (water baths at 10°C, 20°C, 30°C, 40°C and 50°C will be used) • Dependent Variable: Volume of gas given off Control Variables: and how they are kept constant • Volume of enzyme: known mass of peas in a known volume of distilled water. • The way in which concentrations can be controlled should be discussed in terms of details of accurate weighing out of the relevant substances, the accurate measurement of a volume of water in which they are to be dissolved and a suitable method of dissolving and then making up to the required volume. • Substrate concentration: Known volume of hydrogen peroxide(p. H from 1. 3 -2. 7) • p. H: p. H can be controlled using a suitable buffer but it is important to stress that the value at which it should be controlled needs to be either researched or determined empirically. (Buffers are molecules that donate or accept protons to resist changes in p. H as acids or bases are added to the solution. A buffer consists of a weak acid and its conjugate base, or a weak base and its conjugate acid) • Control: Set up without the enzyme. • Results: Start timing a collection period as soon as first bubble of gas enter the collecting syringe. Take measurements of volume of oxygen produced at regular intervals • Need to decide what this is? Every how many seconds over what period of time? Every 10 seconds for 120 seconds/ every 20 sec for 240 secs.
Risk assessment • Hydrogen peroxide is an irritant and dangerous if swallowed. Wear eye protection and avoid contact with skin or clothes. • Take care when handling equipment such as test tubes as conical flasks as they are made of glass and are fragile
Equipment
Equipment 2
The effect of temperature on enzyme activity: Method 1 Set up the apparatus as shown. Note that the collecting syringe should not be over the end of the delivery tube when the boiling tube is first attached to the bung. 2 Grind a known mass of peas in a known volume of distilled water. 3 Measure a known quantity of the ‘pea solution’ made in step 2 into the boiling tube. 4 Add 5 cm 3 of hydrogen peroxide to the pea solution. 5 Reconnect the boiling tube to the apparatus making sure the bung has a gas-tight fit. 6 Place the syringe over the end of the delivery tube. 7 Start timing a collection period as soon as the first bubbles of gas enter the collecting syringe. 8 Repeat the procedure at a range of different temperatures. Students could pool results to obtain replicate readings at each temperature.
Results in enzyme controlled reactions: 1. Rate of reaction (just a reminder!) 2. Initial rate of reaction 3. Q 10 : To show rate changes with temperature.
Results • Calculations of the rate of reaction can be made from measurements over time: • Reaction rate = 1/time • These can then be plotted on a graph, with reaction rate on y axis and independent variable on the x axis
Calculate the rate of reaction for the results of an investigation to see the effect of temperature on catalase activity: Temperature °C Time taken to move coloured water 5 cm³ 20 40 30 14 40 6 50 12 60 55 70 0 Rate calculation 1/t
Calculate the rate of reaction for the results of an investigation to see the effect of temperature on catalase activity: Temperature °C Time taken to move coloured water 5 cm³ Rate calculation 1/t 20 40 0. 025 30 14 0. 071 40 6 0. 167 50 12 0. 083 60 55 0. 018 70 0 0
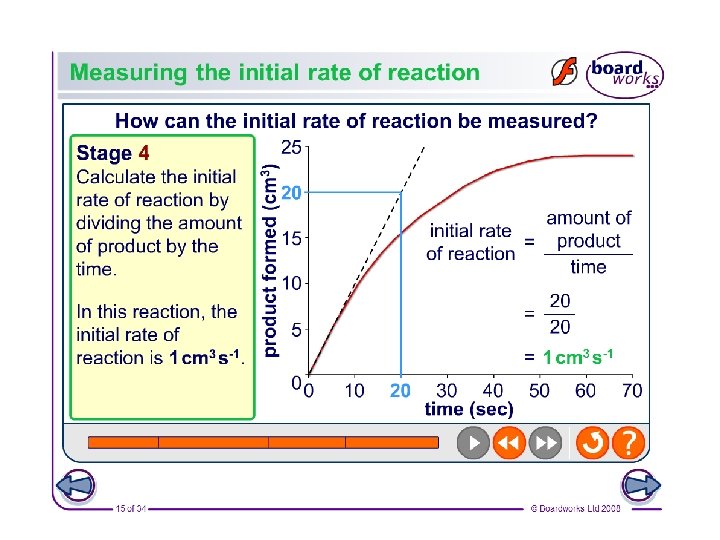
Initial rates of reaction • If you want to show the effect of any dependent variable on the action of an enzyme it is best to compare initial rates at each value • Why? • Because every other factor has not had chance to change and SO influence the rate of reaction. • No limiting factor! • So for your graph you need to plot a graph of the volume of oxygen produced against time for each temperature you investigated. You can then use the graph to calculate initial rate of reaction at each temperature
Initial rate of reaction graphs • To do this you take several readings over the course of a reaction • Plot them in a graph of product formed against time • Take a tangent to steepest portion of graph for a measure of the initial reaction rate • Gradient = change in y axis divided by change in x axis • y/x=rate in cm³ per second/ time • Initial rate. . See next slide • Amount of product/time Y AXIS X AXIS
Task • Using the data provided • Plot a graph and work out the initial rate of reaction
Q 10 • Temperature has an effect on enzyme activity, which in turn affects the whole organism • Q 10 or temperature coefficient is a measure of the rate of change of a reaction when the temperature is increased by 10 °C. • A 10 ⁰C increase in temperature will double the rate of an enzyme controlled reaction • Temperature coefficient: • Q 10 can be calculated • Q 10 = rate of reaction at higher temperature (T + 10) • rate of reaction at lower temperature (T) Between 0 -40 ⁰C Q 10 for any reaction is 2: which means that the rate doubles when the temperature is raised by 10° C Most enzyme controlled reactions have a Q 10 value of around 2 Outside this range it decreases rapidly https: //www. youtube. com/watch? v=UQWWSm. GM 0 y. Q
Results: • A Q 10 value can also be calculated for this reaction using the data below the optimum temperatures. The equation for Q 10 is as follows: • (Rate of reaction at temperature T + 10°C) ÷ (Rate of reaction at temperature T) • A Q 10 value of 2 means that for every increase in 10°C, the initial rate doubles. Likewise, a value of 3 means that every increase in 10°C triples the initial rate and so on. • This deduction only works for temperatures up to the optimum temperature • See Q 10 practice sheet and exam question ‘The reactions involved in photosynthesis are affected by environmental factors. . ’
Conclusion: • The shape of the graph is largely down to kinetics and protein structure. A low temperature provides less kinetic energy to the enzymes so fewer enzyme-substrate complexes are formed in the same amount of time. Therefore, fewer product molecules are produced. This is the reason why increasing temperature initially increases the rate of reaction. • The peak of the graph indicates the optimum temperature. This is when enzymes have the greatest amount of kinetic energy they can have whilst maintaining their protein structure. At this point, the enzymes are working most efficiently and effectively. • Beyond this optimum temperature the protein structure starts to change. Large amounts of kinetic energy overcome the hydrogen bonds in the tertiary and secondary structures of the proteins. This causes the enzyme to change shape/denature and so the shape of the active site is also altered. For this reason, fewer substrates can bind to form enzyme-substrate complexes. This is why increasing the temperature beyond a certain point slows down the rate of reaction
Evaluation Points: • Inconsistency when stopping stopwatch (random error) – the stopwatch may not have been stopped at the exact time, each time. The main limitations are: • the escape of gas from the apparatus and connecting tubes so that a lower volume of gas is collected • Variations in the time delay in adding the enzyme to each tube will also lead to variations in the volume of gas collected.
• Exam question practice!