INTT 103 Chapter 8 Appendix MODEL Often describe

INTT 103 Chapter 8 Appendix

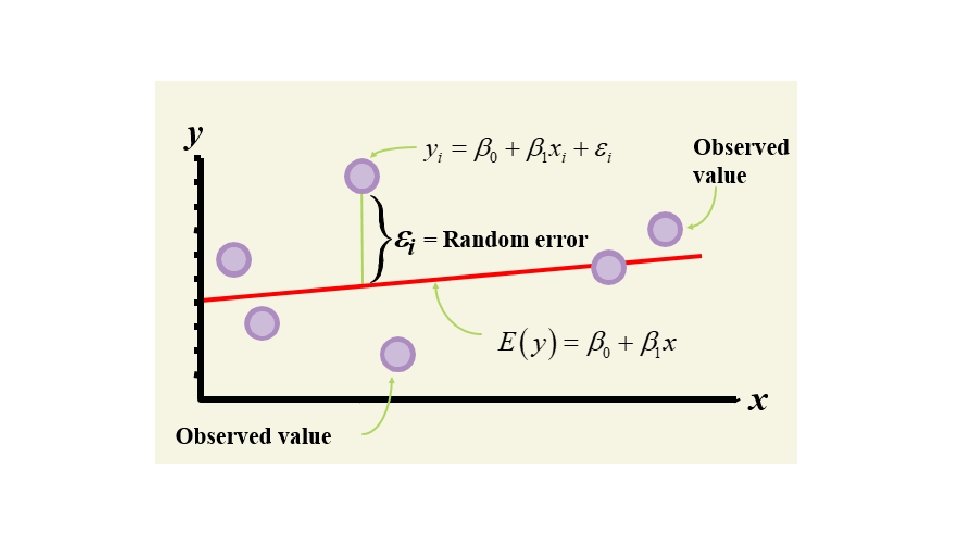
MODEL Often describe relationships between variables Types Deterministic models: * Hypothesize exact relationships * Suitable when prediction error is negligible * Example: force is exactly mass times acceleration F = m·a Probabilistic models: * Hypothesize two components Deterministic Random error * Example: sales volume (y) is 10 times advertising spending (x) + random error y = 10 x + ε • Random error may be due to factors other than advertising

Types of Probabilistic Models Regression Models Correlation Models

Regression Models • Answers ‘What is the relationship between the variables? ’ • Equation used –One numerical dependent (response) variable § What is to be predicted –One or more numerical or categorical independent (explanatory) variables • Used mainly for prediction and estimation

Regression Modeling Steps 1. Hypothesize deterministic component 2. Estimate unknown model parameters 3. Specify probability distribution of random error term • Estimate standard deviation of error 4. Evaluate model 5. Use model for prediction and estimation
 •")
Specifying the Model 1. Define variables • Conceptual (e. g. , Advertising, price) • Empirical (e. g. , List price, regular price) • Measurement (e. g. , $, Units) 2. Hypothesize nature of relationship • Expected effects (i. e. , Coefficients’ signs) • Functional form (linear or non-linear) • Interactions

Model Specification Is Based on Theory • • Theory of field (e. g. , Sociology) Mathematical theory Previous research ‘Common sense’

Types of Relationships

Types of Regression Models

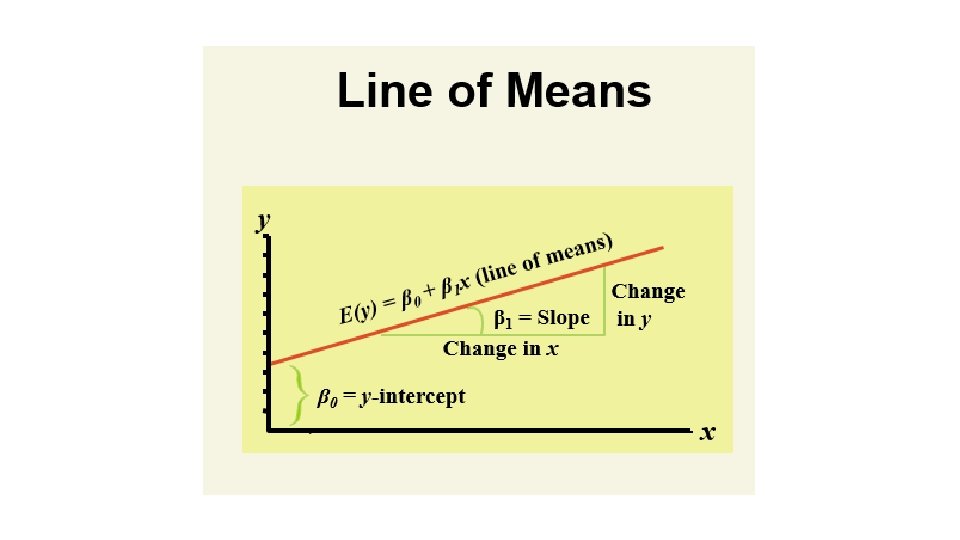
Simple Linear Regression Model Relationship between variables is a linear function

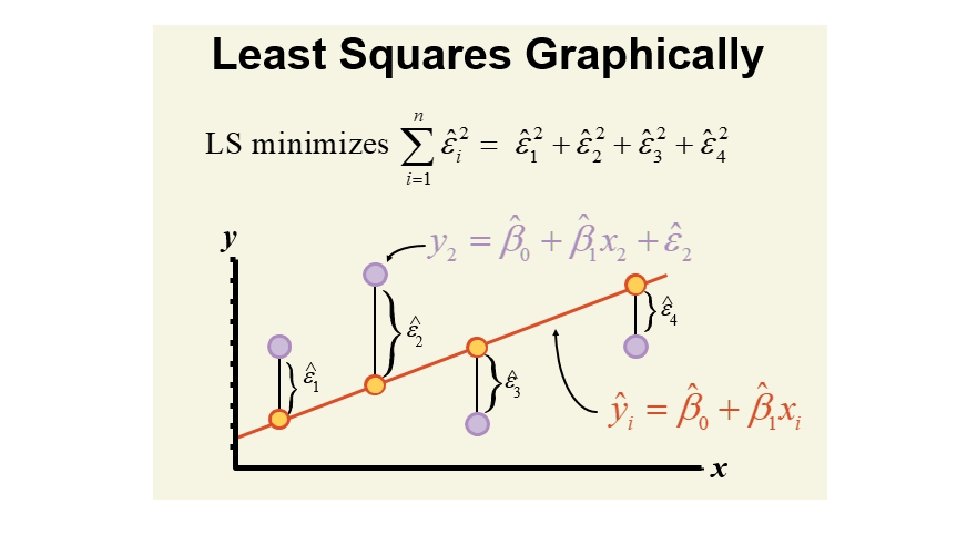
Estimating Parameters: Least Squares Method
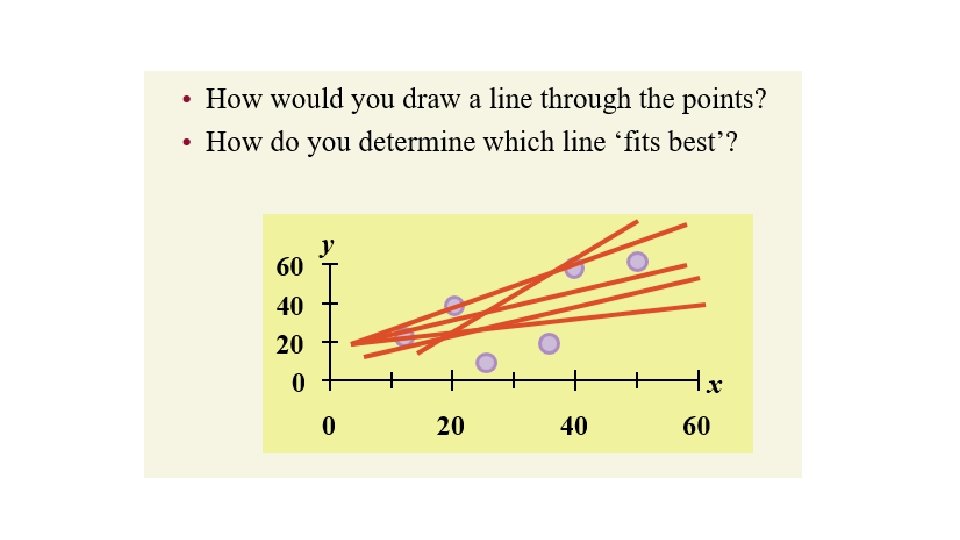

• ‘Best fit’ means difference between actual y values and predicted y values are a minimum – But positive differences off-set negative • Least Squares minimizes the Sum of the Squared Differences (SSE)
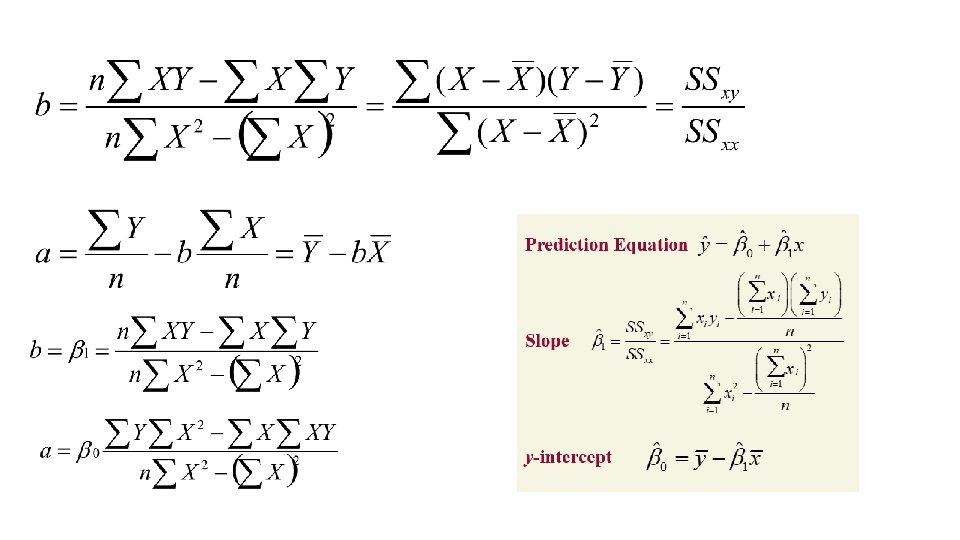

Let: Sums of Squares Sums of squares of x. Sums of squares of y. Sums of cross products of x and y.

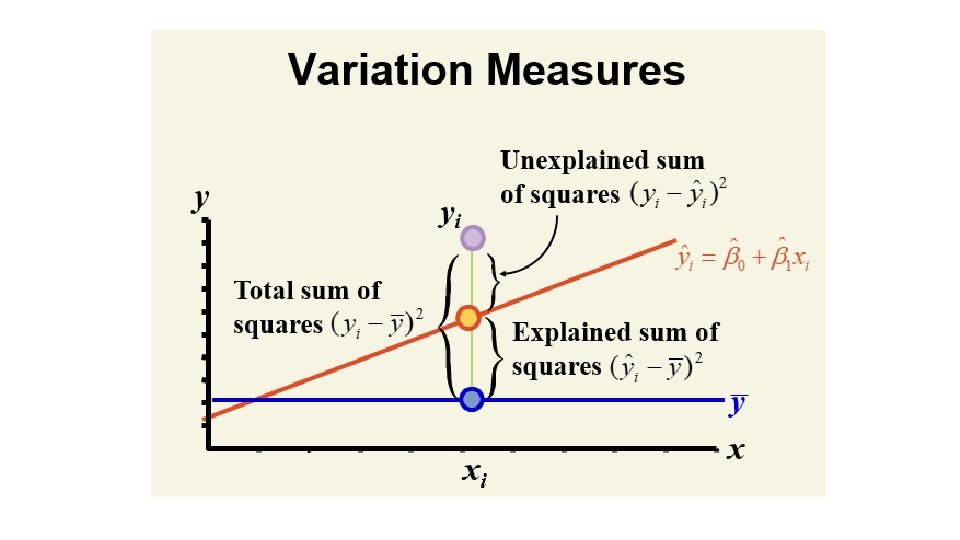
Graphical View Linear Model Mean Model TSS = SSR + SSE Total variability in y-values = Variability accounted for by the regression + Unexplained variability
 • Estimated y changes by in x")
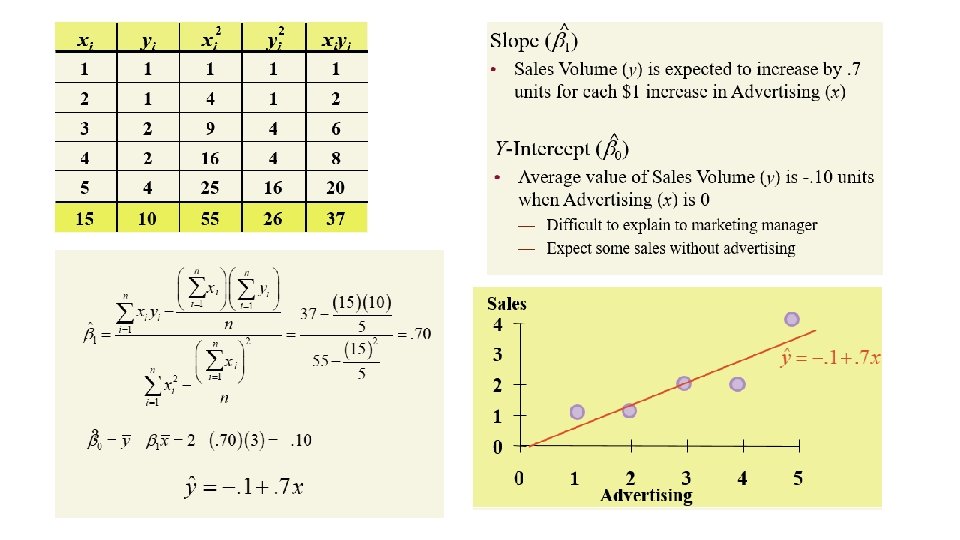
Interpretation of Coefficients 1. Slope ( ) • Estimated y changes by in x for each 1 unit increase — If = 2, then Sales (y) is expected to increase by 2 for each 1 unit increase in Advertising (x)

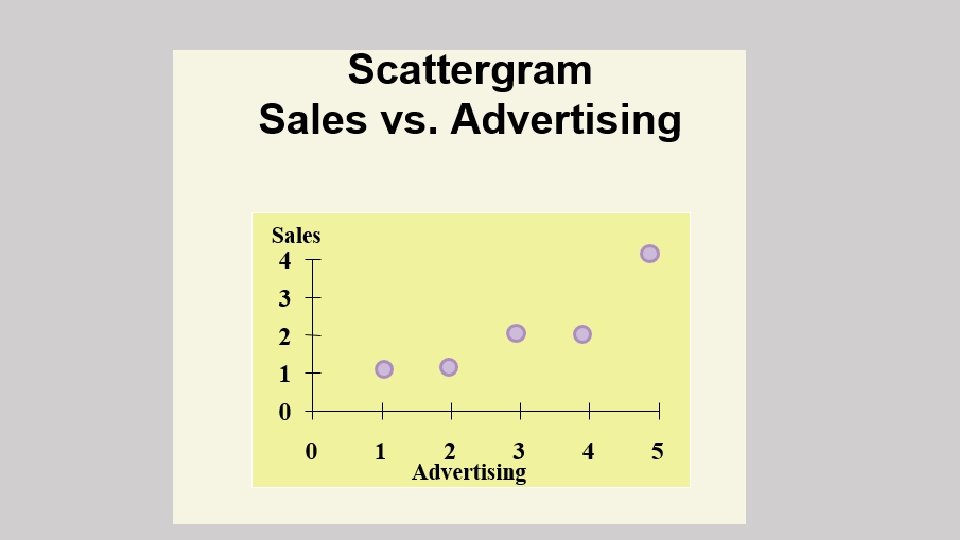
Example: You’re a marketing analyst for G Toys. You gather the following data: Ad $ Sales (Units) 1 1 2 1 3 2 4 2 5 4 Find the least squares line relating sales and advertising.

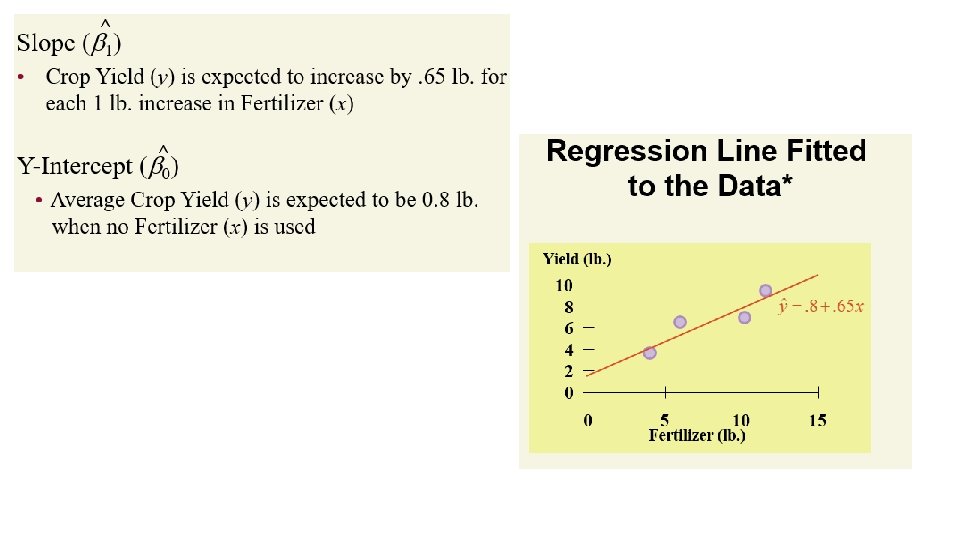
Example: You’re an economist for the county cooperative. You gather the following data: Fertilizer (lb. ) Yield (lb. ) 4 3. 0 6 5. 5 10 6. 5 12 9. 0 Find the least squares line relating crop yield and fertilizer.

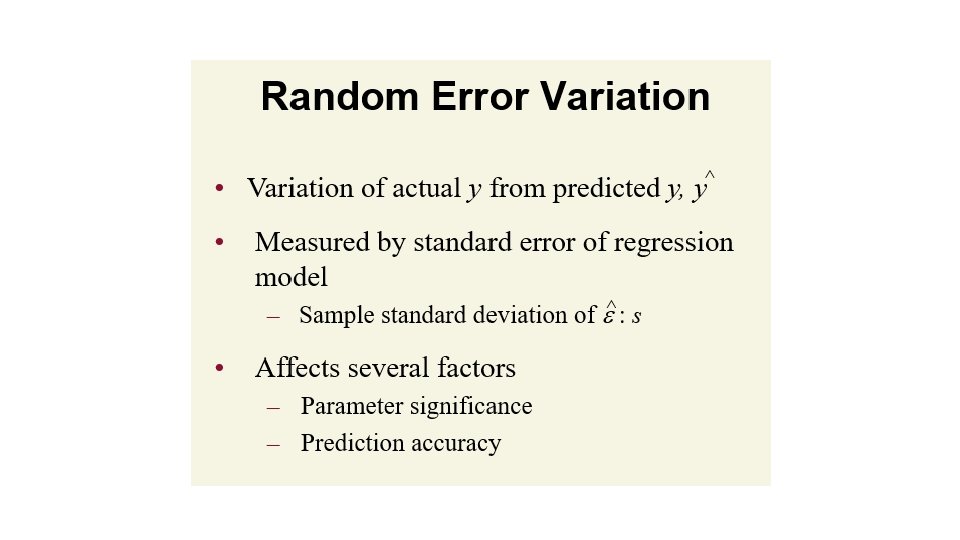
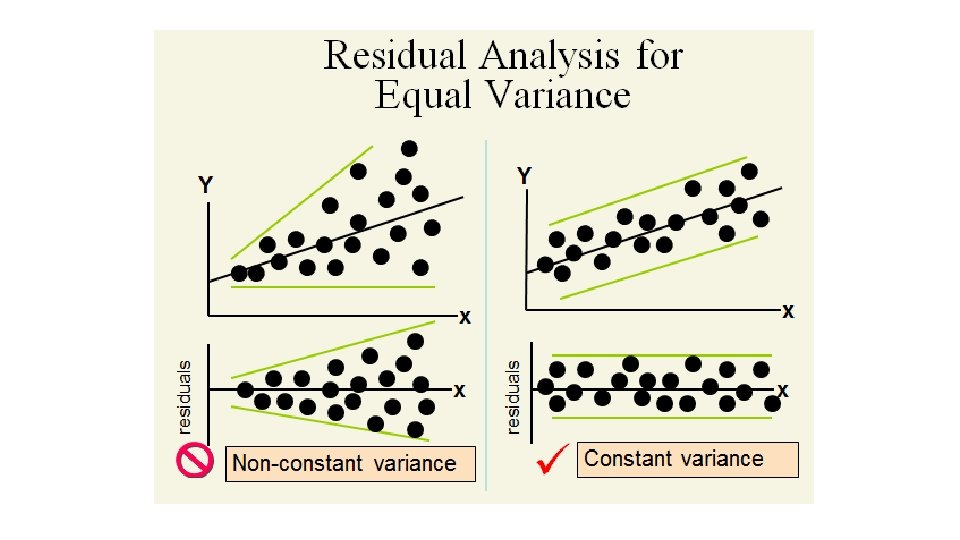
Specify probability distribution of random error term Linear Regression Assumptions 1. 2. 3. 4. Mean of probability distribution of error, ε, is 0 Probability distribution of error has constant variance Probability distribution of error, ε, is normal Errors are independent
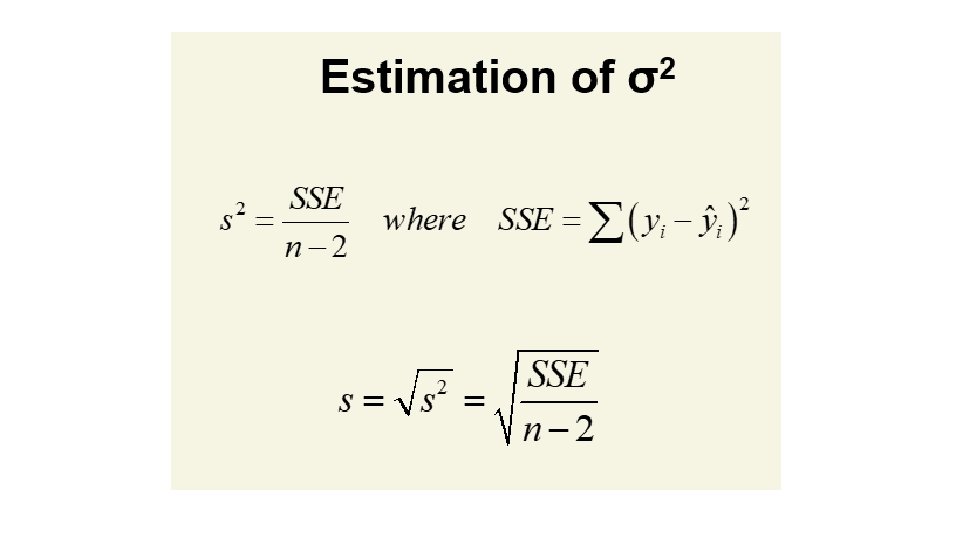

Example: You’re a marketing analyst for G Toys. You gather the following data: Ad $ Sales (Units) 1 1 2 1 3 2 4 2 5 4 Find SSE, s 2, and s.

Calculating SSE Solution

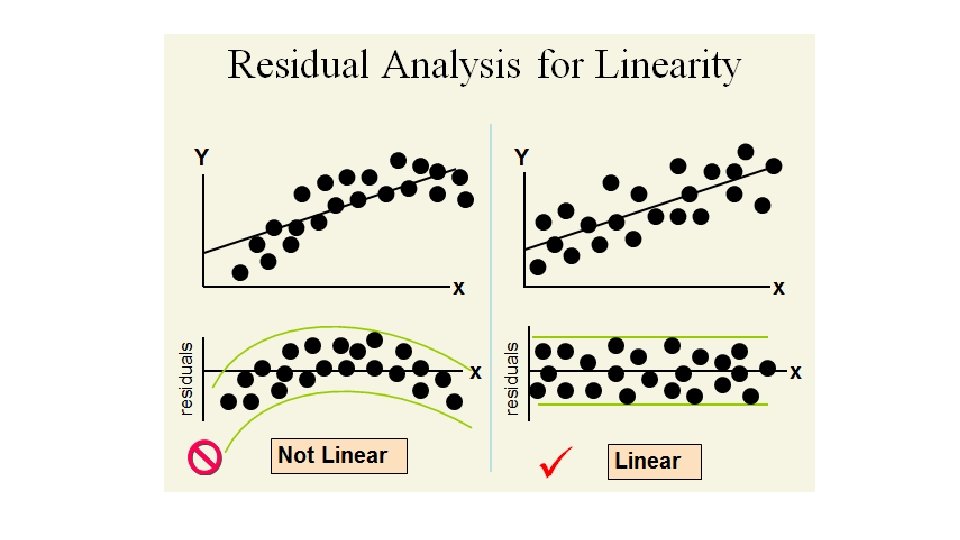
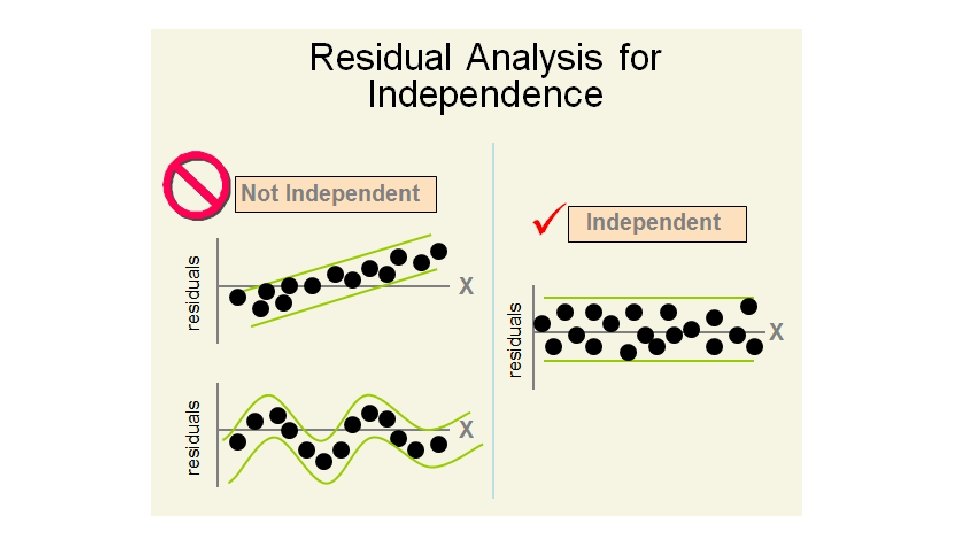
Residual Analysis • The residual for observation i, ei, is the difference between its observed and predicted value • Check the assumptions of regression by examining the residuals – Examine for linearity assumption – Evaluate independence assumption – Evaluate normal distribution assumption – Examine for constant variance for all levels of X (homoscedasticity)

Residual Analysis for Normality When using a normal probability plot, normal errors will approximately display in a straight line

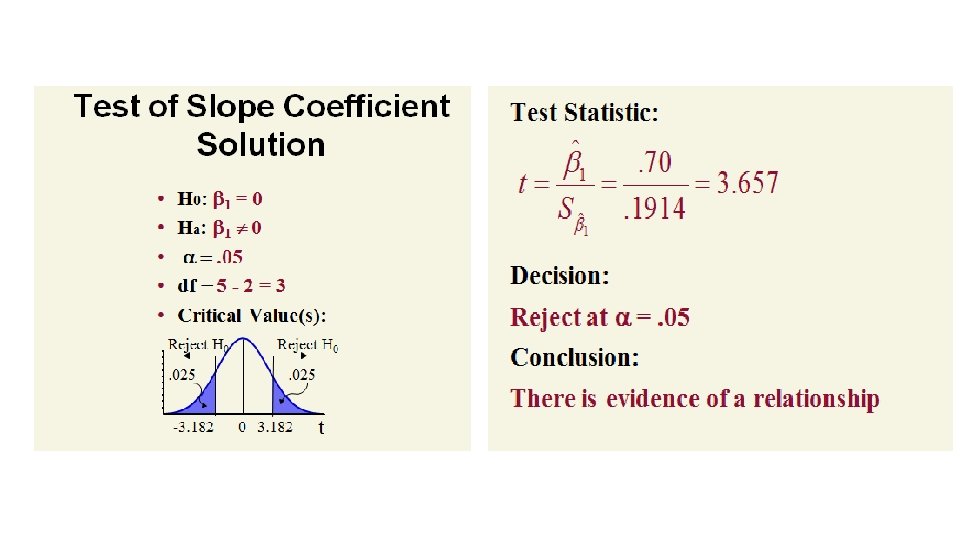
Evaluating the Model Testing for Significance Test of Slope Coefficient • Shows if there is a linear relationship between x and y • Involves population slope 1 • Hypotheses – H 0: 1 = 0 (No Linear Relationship) – Ha: 1 0 (Linear Relationship) • Theoretical basis is sampling distribution of slope
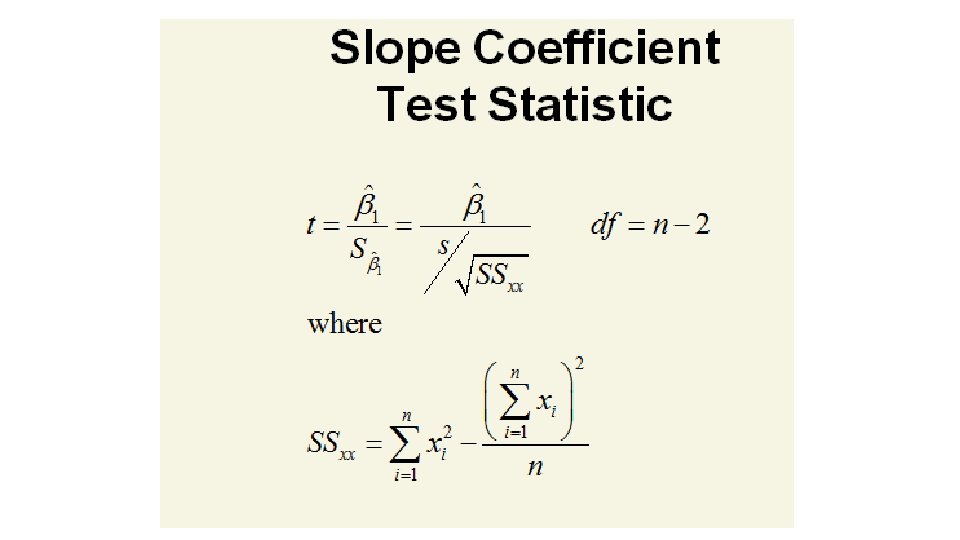

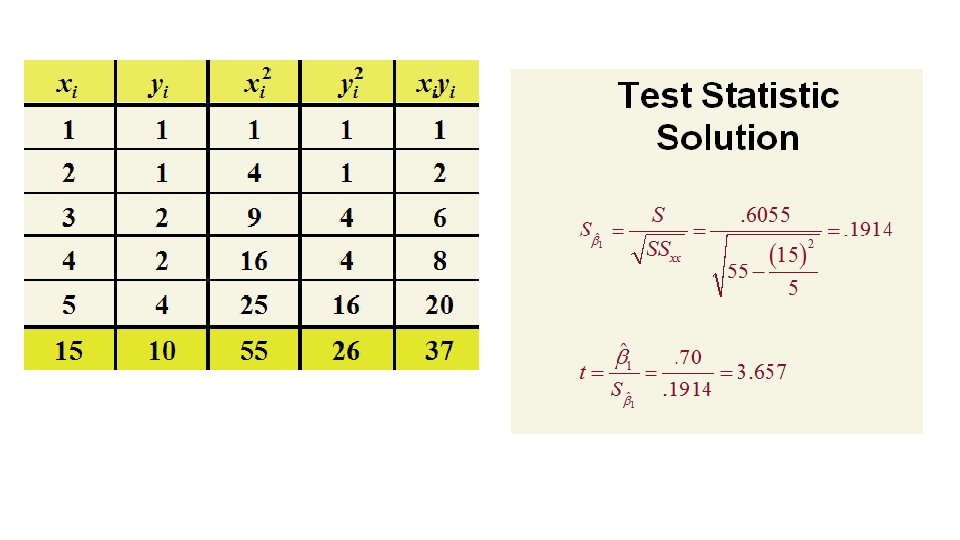
Test of Slope Coefficient Example

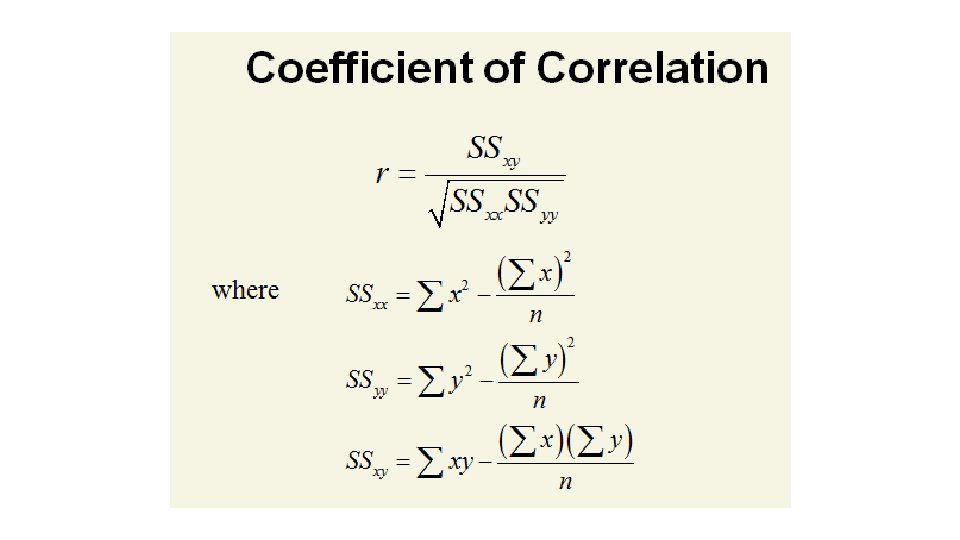
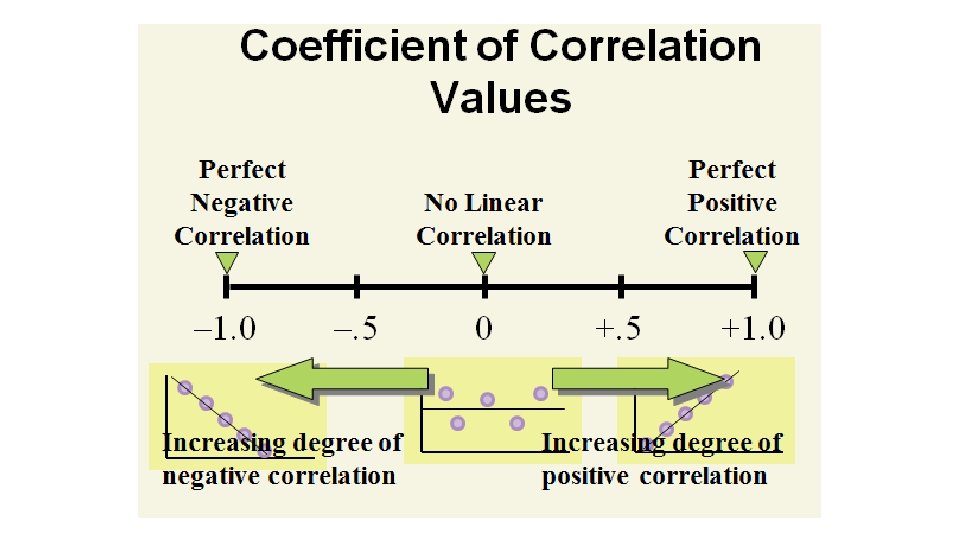
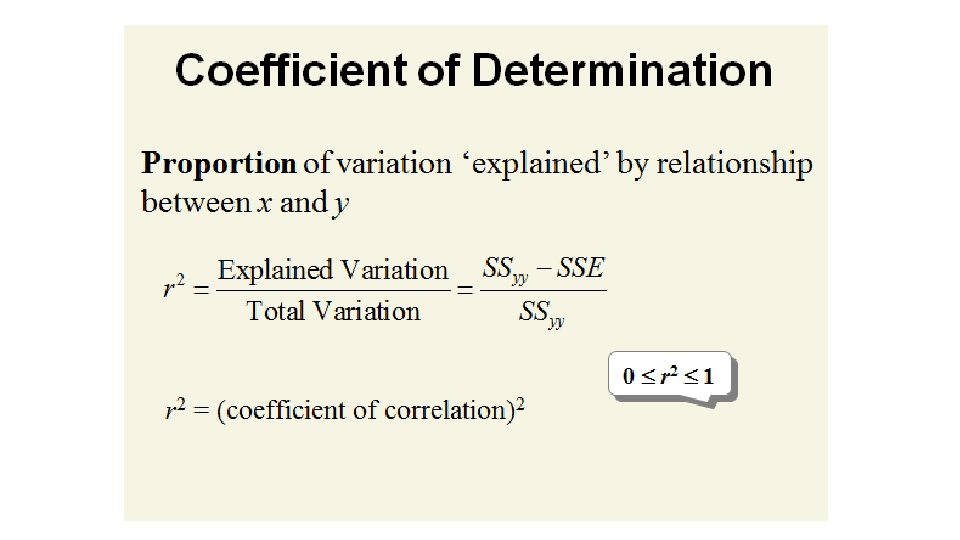
Correlation Models • • Answers ‘How strong is the linear relationship between two variables? ’ Coefficient of correlation – – Sample correlation coefficient denoted r Values range from – 1 to +1 Measures degree of association Does not indicate cause–effect relationship

Coefficient of Correlation Example You’re a marketing analyst for Hasbro Toys. Ad $ Sales (Units) 1 1 2 1 3 2 4 2 5 4 Calculate the coefficient of correlation.
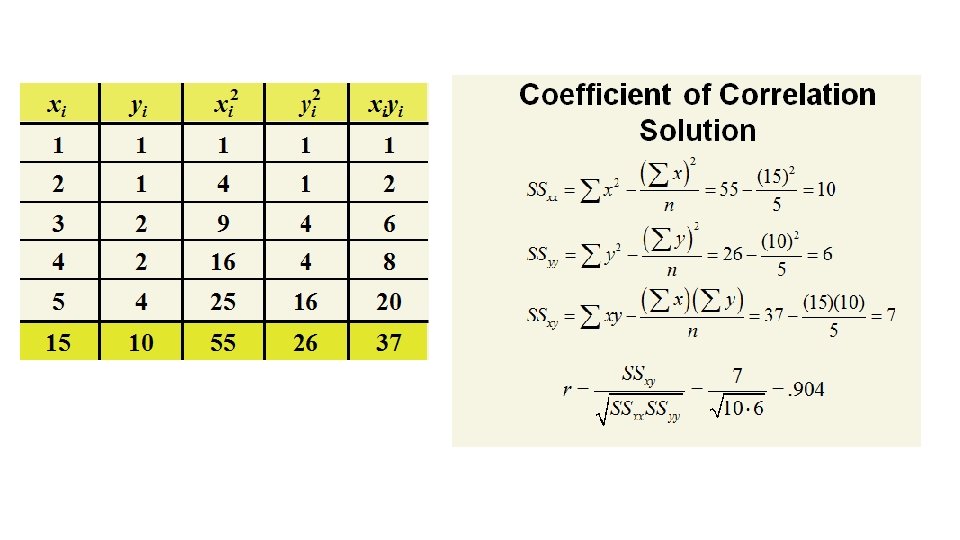

Example
- Slides: 51