INTT 103 Chapter 1 Secondary Data Collection Collecting


 for purposes other")

 that is utilized by a person")


of")


 A measure of central tendency is a single value that attempts to describe")
 In statistics, dispersion (also called variability, scatter, or spread) denotes how stretched or")


 to be consistent (tutarlı) with the testable")


 theories like theory")
 continuous variable is one that can take on a")

 Nonmetric Nominal Ordinal Metric Interval Ratio")
… is one that has")
in which the numbers serve")


 Female ( ) Male Marital Status ( ) Married (")

 An ordinal scale is a ranking scale in which numbers")


- Slides: 115
INTT 103 Chapter 1 Secondary Data Collection
Collecting Data Primary Data Secondary Business Intelligence Data
Secondary Data are data that have already been collected (by somebody) for purposes other than the problem at hand. At face value this definition seems straightforward(basit). However, many researchers confuse the term, or quite rightly see some overlap with business intelligence.
Secondary data, are data collected by someone other than the user. Common sources of secondary data for social science include censuses, organisational records and data collected through qualitative methodologies or qualitative research. Primary data, by contrast, are collected by the investigator conducting the research.
Data that has previously been collected (primary data) that is utilized by a person other than the one who collected the data. Secondary data is often used in social and economic analysis, especially when access to primary data is unavailable. For example, a survey of a group of economists (primary data) cannot be repeated, so its results are used in subsequent research projects. Or, data collected by the Department of Labor (primary data) that is used in economic analysis. Examples of secondary data are research reports, government reports, censuses, weather reports, interviews, the Internet, reference books, organizational reports and accounting documents.
Common sources of existing secondary data include data collected by government public services departments, libraries, internet searches and censuses. Companies use market research to draw on existing information from social media as a source of secondary data. Social media is becoming heavily favored in market research, as opinions are already available from millions of users on many topics and products.
The benefit of using secondary data is that much of the preliminary work is done. The data may have already been sorted in an electronic format, published and reviewed with case studies already conducted. Secondary data can quickly become more or less public knowledge through use in the media. Due to its exposure and public examination, secondary data can carry more validity than primary research data and is often used as verification of primary data. However, there a number of potential problems in using secondary data. It can be difficult to attain secondary data that the fits exact requirements of research studies. It can also be hard to verify the accuracy of secondary data, which can also become outdated over time.
Sources of Secondary Data: 1. Published Printed Sources: There are variety of published printed sources. Their credibility depends on many factors. For example, on the writer, publishing company and time and date when published. New sources are preferred and old sources should be avoided as new technology and researches bring new facts into light. a. Books: Books are available today on any topic that you want to research. The use of books start before even you have selected the topic. After selection of topics books provide insight on how much work has already been done on the same topic and you can prepare your literature review. Books are secondary source but most authentic one in secondary sources.
b. Journals/periodicals: Journals and periodicals are becoming more important as far as data collection is concerned. The reason is that journals provide up-to-date information which at times books cannot and secondly, journals can give information on the very specific topic on which you are researching rather talking about more general topics. c. Magazines/Newspapers: Magazines are also effective but not very reliable. Newspaper on the other hand are more reliable and in some cases the information can only be obtained from newspapers as in the case of some political studies.
d. Published Electronic Sources: As internet is becoming more advance, fast and reachable to the masses; it has been seen that much information that is not available in printed form is available on internet. In the past the credibility of internet was questionable but today it is not. The reason is that in the past journals and books were seldom published on internet but today almost every journal and book is available online. Some are free and for others you have to pay the price. e. e-journals: e-journals are more commonly available than printed journals. Latest journals are difficult to retrieve without subscription but if your university has an e-library you can view any journal, print it and those that are not available you can make an order for them.
f. General websites: Generally websites do not contain very reliable information so their content should be checked for the reliability before quoting from them. g. Weblogs: Weblogs are also becoming common. They are actually diaries written by different people. These diaries are as reliable to use as personal written diaries. h. Government Records: Government records are very important for marketing, management, humanities and social science research. e. g: Census Data/population statistics, Health records, Educational institutes records
i. Unpublished Personal Records: Some unpublished data may also be useful in some cases. Some of the unpublished data can be in the form of diaries and letters. Diaries are personal records and are rarely available but if you are conducting a descriptive research then they might be very useful. The Anne Franks diary is the most famous example of this. That diary contained the most accurate records of Nazi wars. Letters like diaries are also a rich source but should be checked for their reliability before using them. 2. Public Sector Records AA’s survey data Other private companies records
Advantages of Secondary data • It is economical. It saves efforts and expenses. • It is time saving. • It helps to make primary data collection more specific since with the help of secondary data, we are able to make out what are the gaps and deficiencies and what additional information needs to be collected. • It helps to improve the understanding of the problem. • It provides a basis for comparison for the data that is collected by the researcher.
Advantages of secondary data Secondary data are easily accessible relatively inexpensive quickly obtained
Disadvantages of Secondary Data 1. Secondary data is something that seldom fits in the framework of the marketing research factors. Reasons for its non-fitting are: a. Unit of secondary data collection-Suppose you want information on disposable income, but the data is available on gross income. The information may not be same as we require. b. Class Boundaries may be different when units are same. Before 5 Years 2500 -5000 5001 -7500 -10000 After 5 Years 5000 -6000 6001 -7000 7001 -10000 Thus the data collected earlier is of no use to you. 2. Accuracy of secondary data is not known. 3. Data may be outdated.
Evaluation of Secondary Data Because of the above mentioned disadvantages of secondary data, we will lead to evaluation of secondary data. Evaluation means the following four requirements must be satisfied: 1. Availability- It has to be seen that the kind of data you want is available or not. If it is not available then you have to go for primary data. 2. Relevance- It should be meeting the requirements of the problem. For this we have two criterion: a. Units of measurement should be the same. b. Concepts used must be same and currency of data should not be outdated. 3. Accuracy- In order to find how accurate the data is, the following points must be considered: a. Specification and methodology used; b. Margin of error should be examined; c. The dependability of the source must be seen. 4. Sufficiency- Adequate data should be available.
In short: Because secondary data have been collected for purposes other than the problem at hand, their usefulness to the current problem may be limited in several important ways, including relevance and accuracy. The objectives, nature and methods used to collect the secondary data may not be appropriate to the present situation. Also, secondary data may be lacking in accuracy or may not be completely current or dependable. Before using secondary data, it is important to evaluate them according to a series of factors.
Primary data are originated by a researcher for the specific purpose of addressing the problem at hand. They are individually tailored for the decision-makers of organisations that pay for well-focused and exclusive support. Compared with readily available data from a variety of sources, this tailoring means higher costs and a longer time frame in collecting and analysing the data.
Primary Data consists of a collection of original primary data. It is often undertaken after the researcher has gained some insight into the issue by reviewing secondary research or by analyzing previously collected primary data. It can be accomplished through various methods, including questionnaires and telephone interviews in market research, or experiments and direct observations in the physical sciences, amongst others.
A primary data source is an original data source, that is, one in which the data are collected firsthand by the researcher for a specific research purpose or project. Primary data can be collected in a number of ways. However, the most common techniques are self-administered surveys, interviews, field observation, and experiments. Primary data collection is quite expensive and time consuming compared to secondary data collection. Notwithstanding, primary data collection may be the only suitable method for some types of research.
Importance of Primary Data: Importance of Primary data cannot be neglected. A research can be conducted without secondary data but a research based on only secondary data is least reliable and may have biases because secondary data has already been manipulated by human beings. In statistical surveys it is necessary to get information from primary sources and work on primary data: for example, the statistical records of female population in a country cannot be based on newspaper, magazine and other printed sources. One such sources are old and secondly they contain limited information as well as they can be misleading and biased.
1. Validity: Validity is one of the major concerns in a research. Validity is the quality of a research that makes it trustworthy and scientific. Validity is the use of scientific methods in research to make it logical and acceptable. Using primary data in research can improves the validity of research. First hand information obtained from a sample that is representative of the target population will yield data that will be valid for the entire target population.
2. Authenticity: Authenticity is the genuineness of the research. Authenticity can be at stake if the researcher invests personal biases or uses misleading information in the research. Primary research tools and data can become more authentic if the methods chosen to analyze and interpret data are valid and reasonably suitable for the data type. Primary sources are more authentic because the facts have not been overdone. Primary source can be less authentic if the source hides information or alters facts due to some personal reasons. There are methods that can be employed to ensure factual yielding of data from the source.
3. Reliability: Reliability is the certainty that the research is enough true to be trusted on. For example, if a research study concludes that junk food consumption does not increase the risk of cancer and heart diseases. This conclusion should have to be drawn from a sample whose size, sampling technique and variability is not questionable. Reliability improves with using primary data. In the similar research mentioned above if the researcher uses experimental method and questionnaires the results will be highly reliable. On the other hand, if he relies on the data available in books and on internet he will collect information that does not represent the real facts.
Sources of Primary Data: Sources for primary data are limited and at times it becomes difficult to obtain data from a primary source because of either scarcity of population or lack of cooperation. Regardless of any difficulty one can face in collecting primary data; it is the most authentic and reliable data source. Following are some of the sources of primary data. 1. Experiments: Experiments require an artificial or natural setting in which to perform logical study to collect data. Experiments are more suitable for medicine, psychological studies, nutrition and for other scientific studies. In experiments the experimenter has to keep control over the influence of any extraneous variable on the results.
2. Survey: Survey is most commonly used method in social sciences, management, marketing and psychology to some extent. Surveys can be conducted in different methods. a. Questionnaire: Questionnaire is the most commonly used method in survey. Questionnaires are a list of questions either open-ended or close -ended for which the respondent give answers. Questionnaire can be conducted via telephone, email, live in a public area, or in an institute, through electronic mail or through fax and other methods.
b. Interview: Interview is a face-to-face conversation with the respondent. In interview, the main problem arises when the respondent deliberately hides information otherwise it is an in depth source of information. The interviewer can not only record the statements the interviewee speaks, but he can observe the body language, expressions and other reactions to the questions too. This enables the interviewer to draw conclusions easily. c. Observations: Observation can be done while letting the observing person know that he is being observed or without letting him know. Observations can also be made in natural settings as well as in artificially created environment.
Published secondary data
Non-government statistical data Published statistical data are of great interest to researchers. Graphic and statistical analyses can be performed on these data to draw important insights. Examples of non governmental statistical data include trade associations such as the Swedish Tourism Trade Association (www. sverigeturism. se)
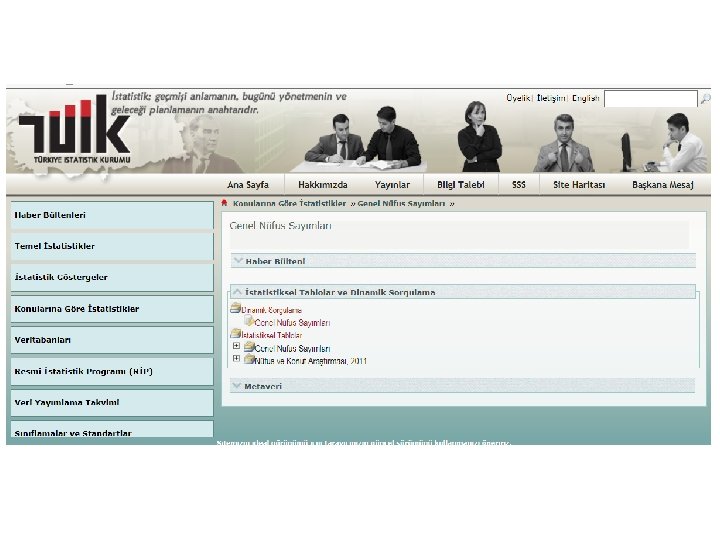
Government sources Turkish government and the EU also produce large amounts of secondary data. Each European country has its own statistical office which produces lists of the publications available (and the costs involved).
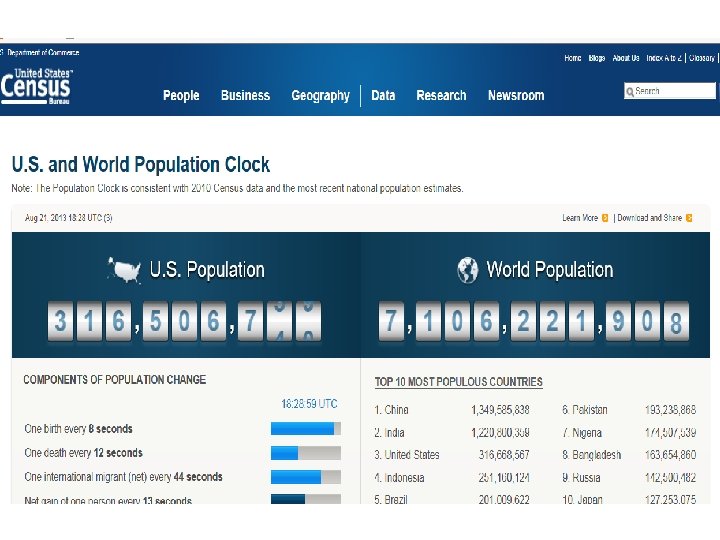
Census data Most world countries produce either catalogues or newsletters that describe the array(seri)of census publications available and the plans for any forthcoming census.
Statistical data are periodicals published by government or non-governments, also can be published nationally or internationally.
In today’s world. . . we are constantly being bombarded with statistics and statistical information. For example: Customer Surveys Medical News Demographics Political Polls Economic Predictions Marketing Information Sales Forecasts Stock Market Projections Consumer Price Index Sports Statistics
What is Statistics? In common usage people think of statistics as numerical data—the unemployment rate last month, total government expenditure last year, the number of impaired drivers charged during the recent holiday season, the crime rates of cities, and so forth. Although there is nothing wrong with viewing statistics in this way, we are going to take a deeper approach. We will view statistics the way professional statisticians view it— as a methodology for collecting, classifying, summarizing, organizing, presenting, analyzing and interpreting numerical information.
Statistics is a way to get information from data. Data: Facts, especially numerical facts, collected together for reference or information. Information: Knowledge communicated concerning some particular fact
Statistics is a branch of mathematics dealing with the collection, analysis, interpretation, presentation, and organization of data. In applying statistics to, e. g. , a scientific, industrial, or social problem, it is conventional to begin with a statistical population or a statistical model process to be studied. Populations can be diverse topics such as "all people living in a country" or "every atom composing a crystal. " Statistics deals with all aspects of data including the planning of data collection in terms of the design of surveys and experiments
Population — a population is the group of all items of interest to a statistics practitioner. — frequently very large; sometimes infinite. E. g. All 5 million Florida voters. Sample — A sample is a set of data drawn from the population. — Potentially very large, but less than the population. E. g. a sample of 765 voters exit polled on election day. Parameter — A descriptive measure of a population. Statistic — A descriptive measure of a sample.
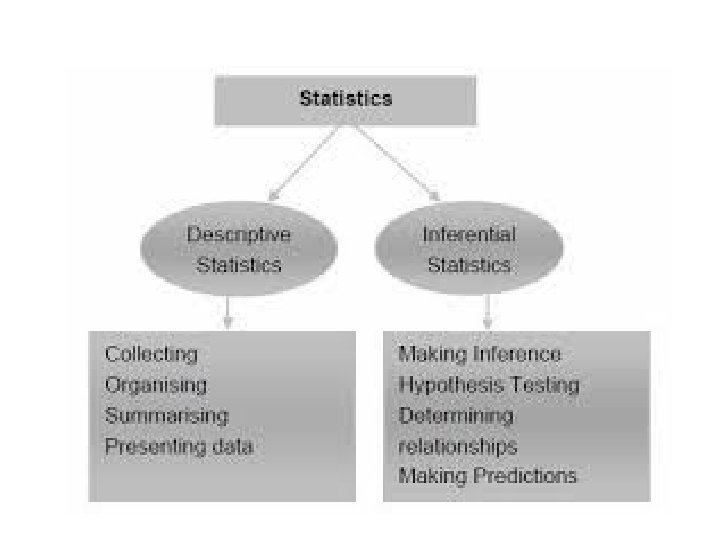
Two main statistical methods are used in data analysis: descriptive statistics, which summarize data from a sample using indexes such as the mean or standard deviation, and inferential statistics, which draw conclusions from data that are subject to random variation (e. g. , observational errors, sampling variation).
Descriptive statistics are most often concerned with two sets of properties of a distribution (sample or population): central tendency (a) seeks to characterize the distribution's central or typical value, while dispersion (or variability) (b) characterizes the extent to which members of the distribution depart from its center and each other. Inferences on mathematical statistics are made under the framework of probability theory, which deals with the analysis of random phenomena.
(a) A measure of central tendency is a single value that attempts to describe a set of data by identifying the central position within that set of data. As such, measures of central tendency are sometimes called measures of central location. They are also classed as summary statistics.
(b) In statistics, dispersion (also called variability, scatter, or spread) denotes how stretched or squeezed a distribution (theoretical or that underlying a statistical sample) is. Common examples of measures of statistical dispersion are the variance, standard deviation and interquartile range.
Statistics as data Statistics as a science
Statistics Theoretical Statistics Applied Statistics
Statistics Mathematıcal Statistics Analytical Statistics
Istintaci, sonuç çıkarımlı Statistics Descriptive Statistics Inferential Statistics
The Use of Statistics in Economics and Other Social Sciences
Businesses use statistical methodology and thinking to make decisions about which products to produce, how much to spend advertising them, how to evaluate their employees, how often to service their machinery and equipment, how large their inventories should be, and nearly every aspect of running their operations. The motivation for using statistics in the study of economics and other social sciences is somewhat different. The object of the social sciences and of economics in particular is to understand how the social and economic system functions.
Views and understandings of how things work are called theories. Economic theories are descriptions and interpretations of how the economic system functions. They are composed of two parts—a logical structure which is tautological (gereksiz tekrar) and a set of parameters in that logical structure which gives theory empirical content.
If the facts turn out (tersine çevirmek) to be consistent (tutarlı) with the testable implications of theory, then we accept theory as true until new evidence inconsistent with it is uncovered. A theory is valuable if it is logically consistent both within itself and with other theories established as “true” and is capable of being rejected by but nevertheless consistent with available evidence.
THE USE OF STATISTICS
“The rich are getting richer and the poorer. ” This is clearly an empirically testable proposition (önerme) for reasonable definitions of what we mean by “rich” and “poor”. It is really an interesting proposition (oran), however, only in conjunction with some theory of how the economic system functions in generating income and distributing it among people. Such a theory would usually carry with it some implications (karışıklık) as to how the institutions within the economic system could be changed to prevent (önlemek) income inequalities from increasing. And thinking about these implications forces us to analyse the consequences of reducing income inequality and to form an opinion as to whether or not it should be reduced.
Statistics is the methodology that we use to confront (karşı koymak) theories like theory of demand other testable propositions with the facts. It is the set of procedures and intellectual processes by which we decide whether or not to accept a theory as true— the process by which we decide what and what not to believe. In this sense, statistics is at the root of all human knowledge.
TYPES OF VARIABLES Mathematically (Quantitative) continuous variable is one that can take on a range of values that correspond to some quantitative amount and can be divided gradually. Age, income, weight kg, distance km etc. Discrete variable is one that indicates membership in some group. Can not be divided. gender, profession, education, living districts, cities, countries, names, etc. 57
TYPES OF VARIABLES Causality Independent variable is one that affects other variables. A variable that is expected to influence the dependent variable in some way. Will explain later. Dependent variable is one that be affected by other variables. A process outcome or a variable that is predicted and/or explained by other variables, will explain later. 58
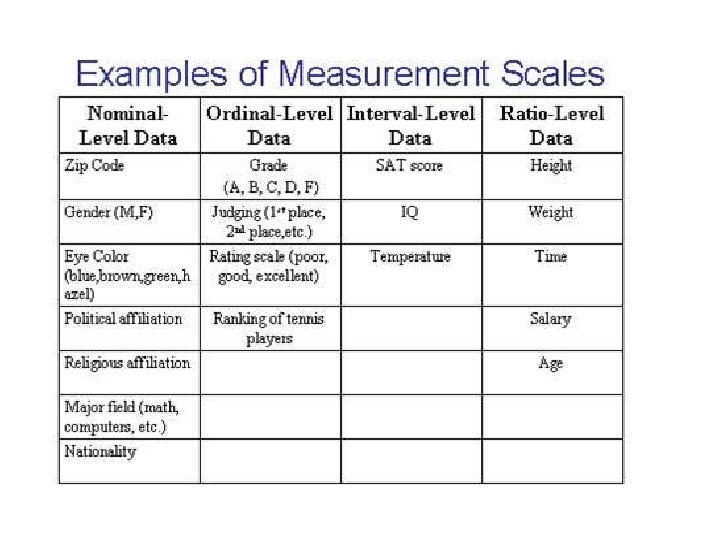
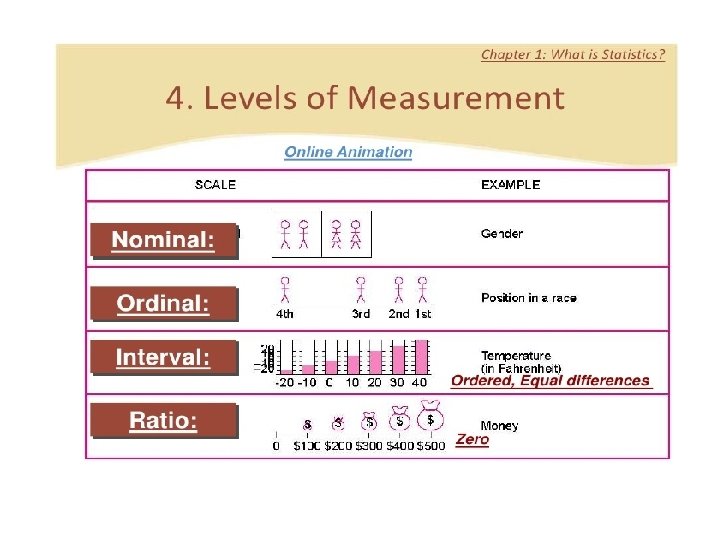
Measurement Scales (Qualitative) Nonmetric Nominal Ordinal Metric Interval Ratio
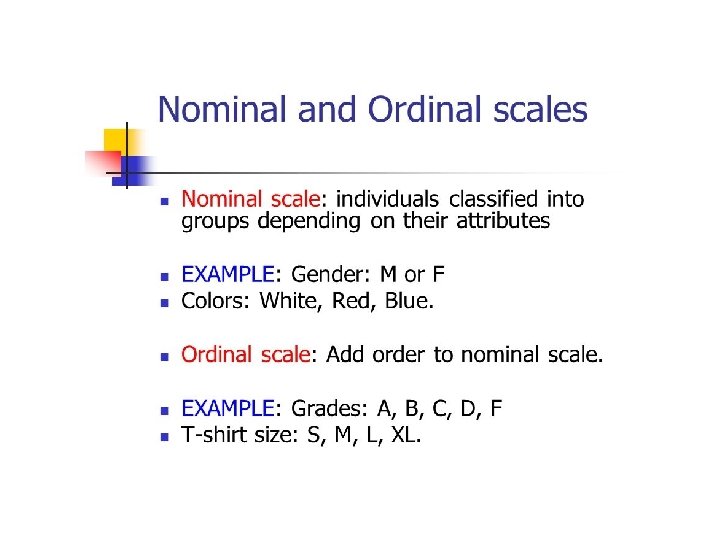
A categorical variable (sometimes called a nominal variable or scale)… is one that has two or more categories, but there is no intrinsic ordering to the categories. For example, gender is a categorical variable having two categories (male and female) and there is no intrinsic ordering to the categories. Hair color is also a categorical variable having a number of categories (blonde, brown, brunette, red, etc. ) and again, there is no agreed way to order these from highest to lowest. A purely categorical variable is one that simply allows you to assign categories but you cannot clearly order the variables. If the variable has a clear ordering, then that variable would be an ordinal variable.
Nominal scale A nominal scale is a figurative labelling scheme(plan)in which the numbers serve only as labels for identifying and classifying objects. For example, the numbers assigned to the respondents in a study constitute a nominal scale, thus a female respondent may be assigned a number 1 and a male respondent 2. (oluşturmak)
When a nominal scale is used for the purpose of identification, there is a strict one-to-one correspondence between the numbers and the objects. Each number is assigned to only one object, and each object has only one number assigned to it.
No matter which one is first or second
Common examples include student registration numbers at their college or university and numbers assigned to football players or jockeys in a horse race. In marketing research, nominal scales are used for identifying respondents, brands, attributes, banks and other objects.
Examples Gender ( ) Female ( ) Male Marital Status ( ) Married ( ) Single ( ) Divorced Nationality ( ) Turk ( ) Arab ( ) Germen ( ) English
- Mod and frequencies can be calculated Table 1: The Nationality of the Tourists Nationality Turkish Germany Japanies Arab Total 330 610 560 100 1600 Frequency (%) 21 38 35 06 100
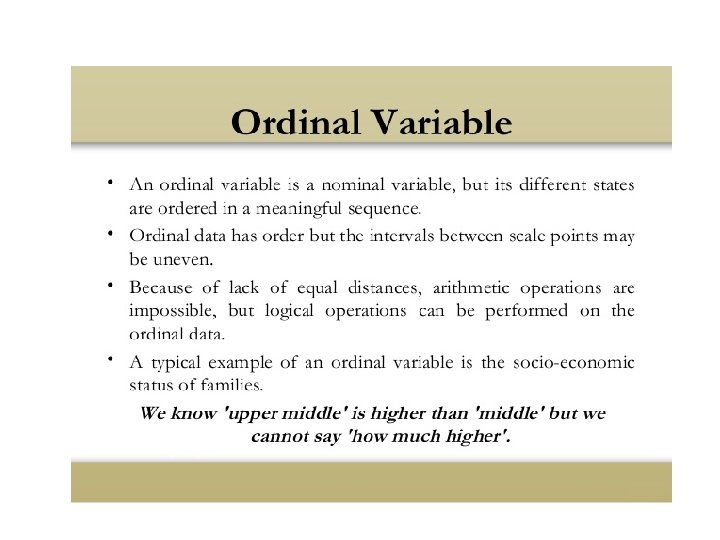
Ordinal scale (or variable) An ordinal scale is a ranking scale in which numbers are assigned to objects to indicate the relative extent to which the objects possess some characteristic. An ordinal scale allows you to determine whether an object has more or less of a characteristic than some other object, but not how much more or less.
Thus, an ordinal scale indicates relative position, not the magnitude of the differences between the objects. The object ranked first has more of the characteristic as compared with the object ranked second, but whether the object ranked second is a close second or a poor second is not known.
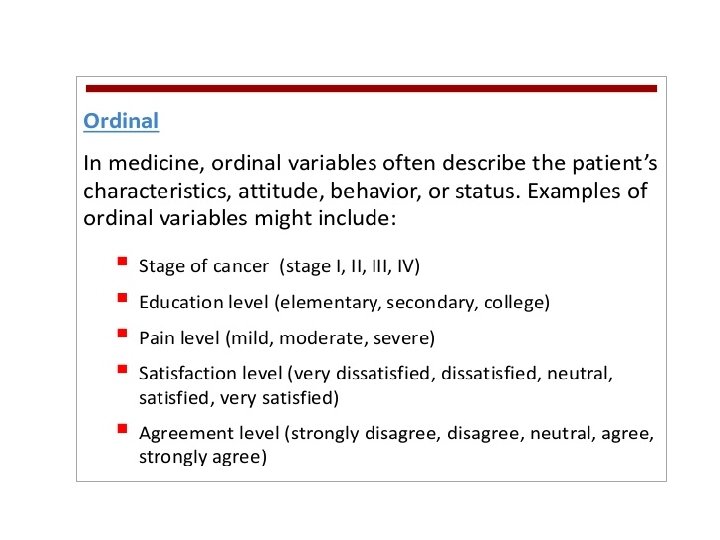
Common examples of ordinal scales include quality rankings, rankings of teams in a tournament and occupational status. In marketing research, ordinal scales are used to measure relative attitudes, opinions, perceptions and preferences. Measurements of this type include ‘greater than’ or ‘less than’ judgments from the respondents.
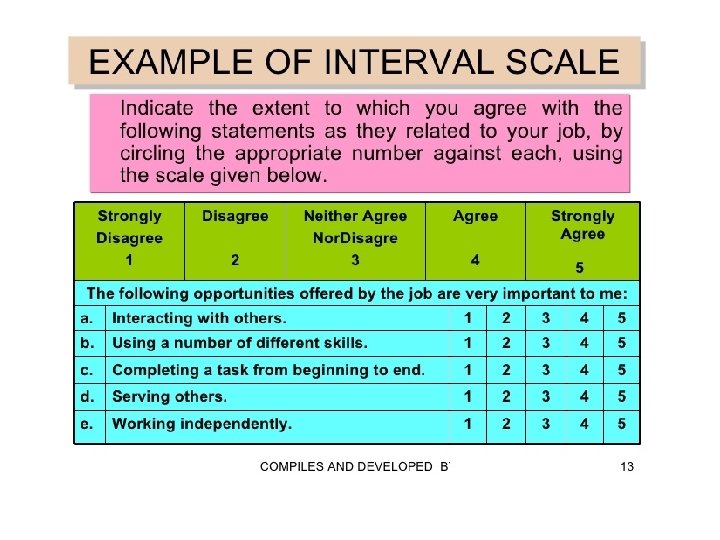
Interval scale In an interval scale, numerically equal distances on the scale represent equal values in the characteristic being measured because it is metric. An interval scale contains all the information of an ordinal scale, but it also allows you to compare the differences between objects. The difference between any two scale values is identical to the difference between any other two adjacent values of an interval scale.
There is a constant or equal interval between scale values. The difference between 1 and 2 is the same as the difference between 2 and 3, which is the same as the difference between 5 and 6. A common example in everyday life is a temperature scale. In marketing research, attitudinal data obtained from rating scales are often treated as interval data.
Interval is a metric scale, so it is possible to calculate the arithmetical means of interval scale. Interval scale can be five, seven or ninelevel scale. Let us assume that 200 students have answered the question above as follow, calculate the arithmetical means
Participation Degree 5 Strongly agree 4 3 2 1 Strongly disagree Total Frequency 75 64 38 18 5 200 The weighted arithmetic means is? (5 x 0, 375)+(4 x 0, 32)+(3 x 0, 19)+(2 x 0, 09)+(1 x 0, 025)=3, 93 % 37, 5 32 19 9 2, 5 100
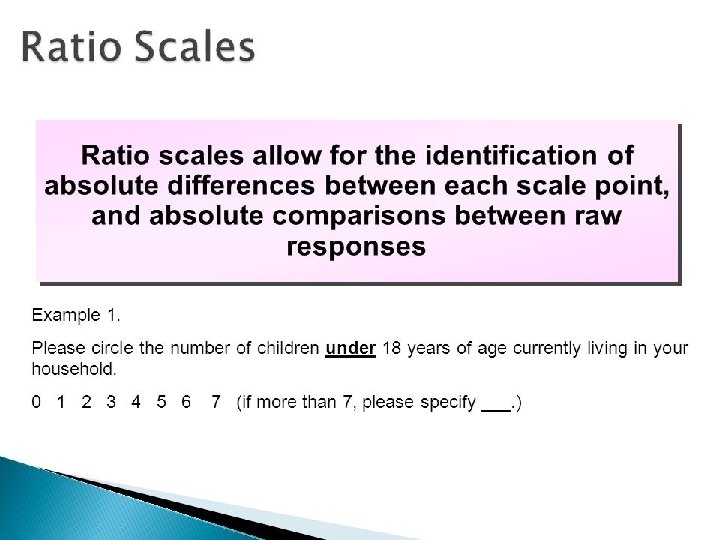
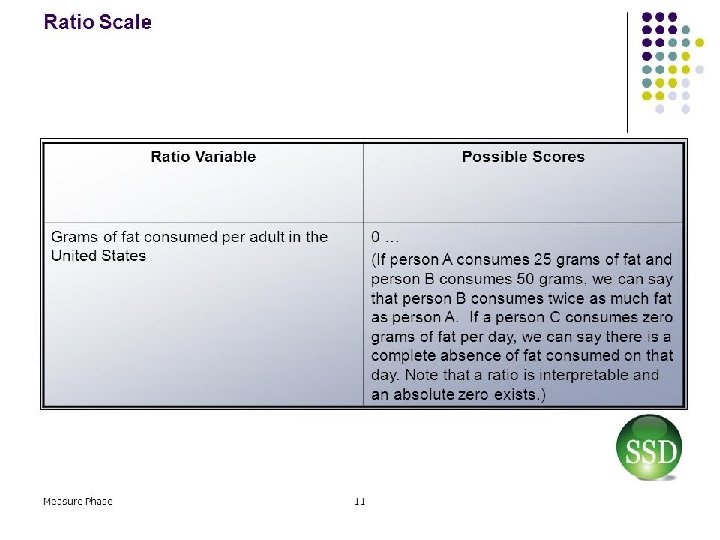
Ratio scale refers to the level of measurement in which the attributes composing variables are measured on specific numerical scores or values that have equal distances between attributes or points along the scale and are based on a “true zero” point.
Descriptive and Inferential Statistics The application of statistical thinking involves two sets of processes. First, there is the description and presentation of data. Second, there is the process of using the data to make some inference about features of the environment from which the data were selected or about the underlying mechanism that generated the data, such as the ongoing functioning of the economy or the accounting system or production line in a business firm. The first is called descriptive statistics and the second inferential statistics.
Descriptive statistics are used to describe the basic features of the data in a study. They provide simple summaries about the sample and the measures. Together with simple graphics analysis, they form the basis of virtually every quantitative analysis of data.
With inferential statistics, you are trying to reach conclusions that extend beyond the immediate data alone. For instance, we use inferential statistics to try to infer from the sample data what the population might think. Or, we use inferential statistics to make judgments of the probability that an observed difference between groups is a dependable one or one that might have happened by chance in this study. Thus, we use inferential statistics to make inferences from our data to more general conditions; we use descriptive statistics simply to describe what's going on in our data.
Descriptive statistics utilizes numerical and graphical methods to find patterns in the data, to summarize the information it reveals and to present that information in a meaningful way. Inferential statistics uses data to make estimates, decisions, predictions, or other generalizations about the environment from which the data were obtained.
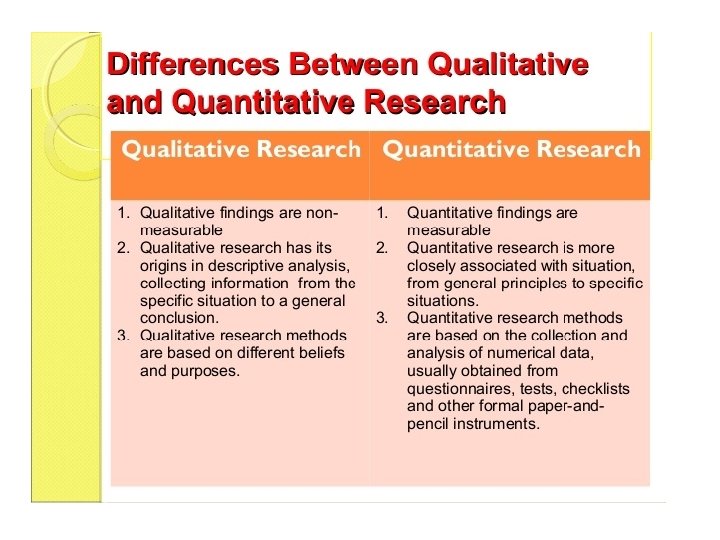
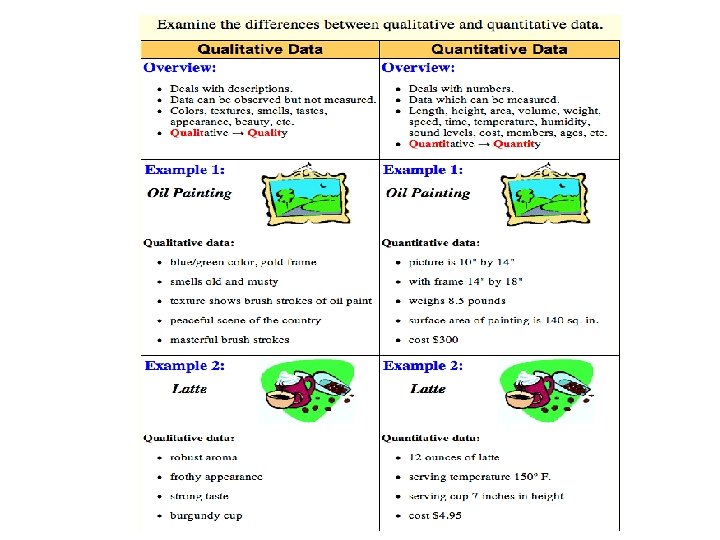
Data Sets There are three general kinds of data sets • cross-sectional • time-series • panel. And within data sets there are two kinds of data • quantitative • qualitative.
Quantitative data can be recorded on a natural numerical scale. Examples are gross national product (measured in dollars) and the consumer price index (measured as a percentage of a base level). Qualitative data cannot be measured on a naturally occurring numerical scale but can only be classified into one of a group of categories. An example is a series of records of whether or not the automobile accidents occurring over a given period resulted in criminal charges—the entries are simply yes or no.
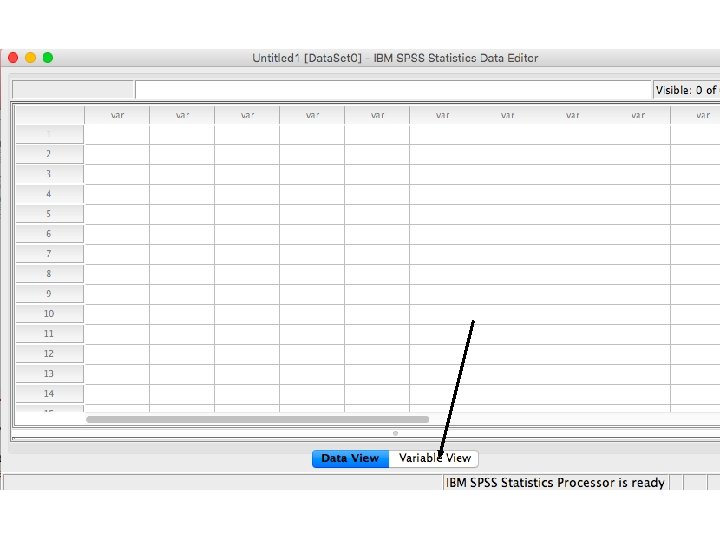
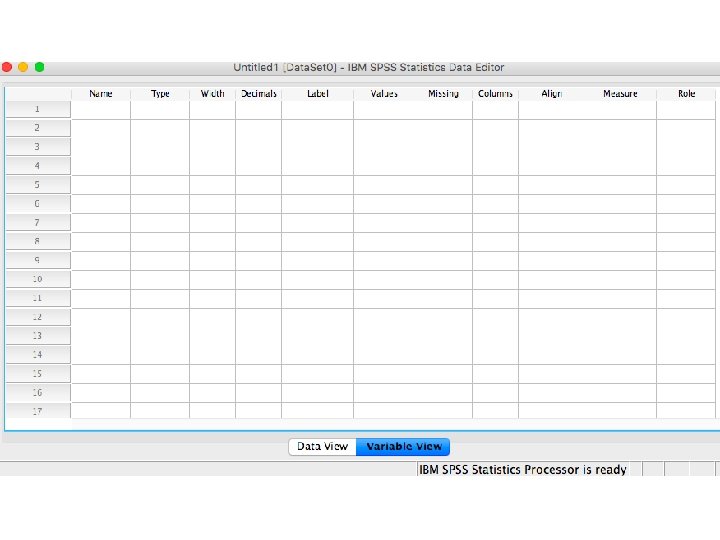
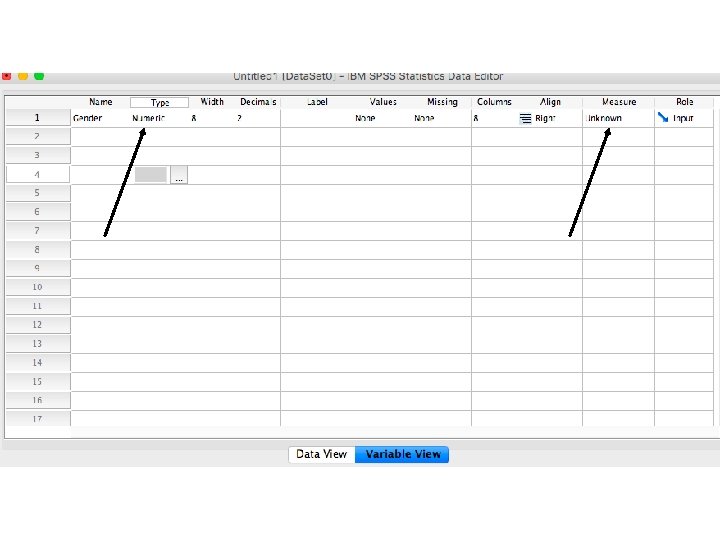
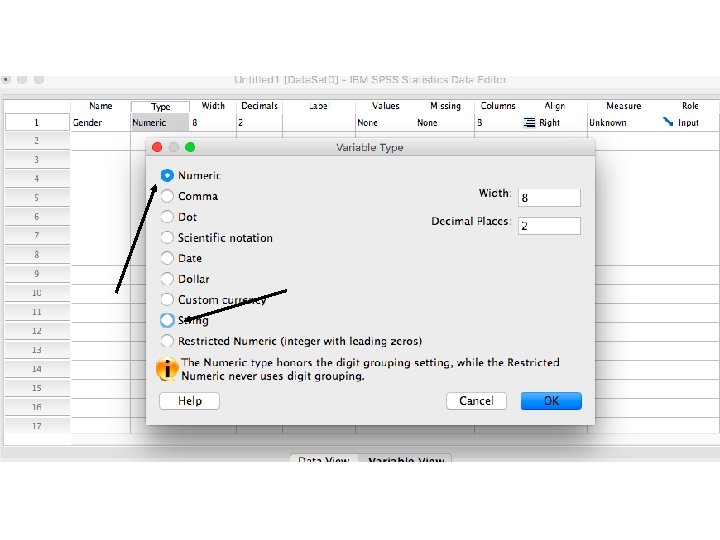
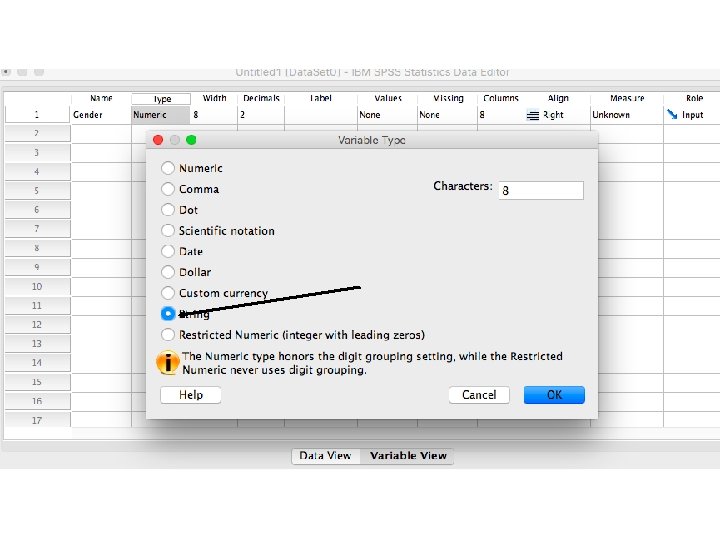
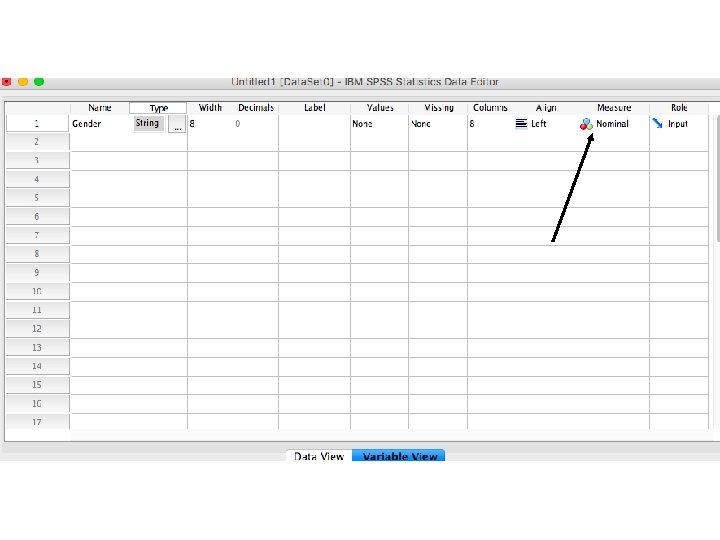
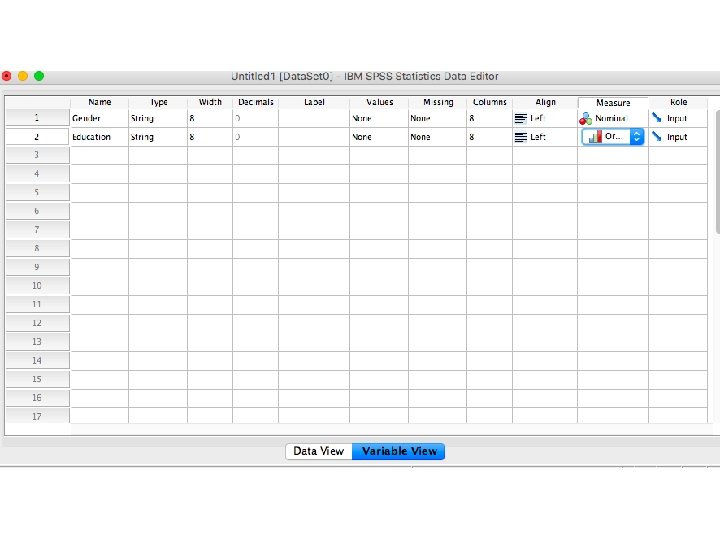
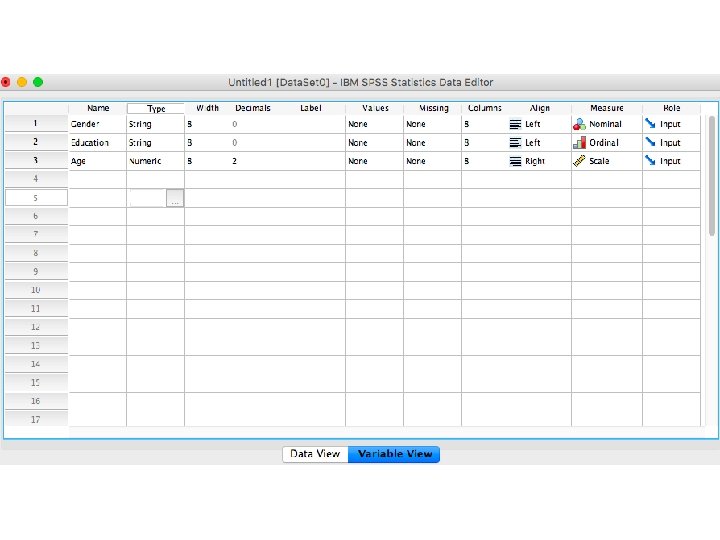
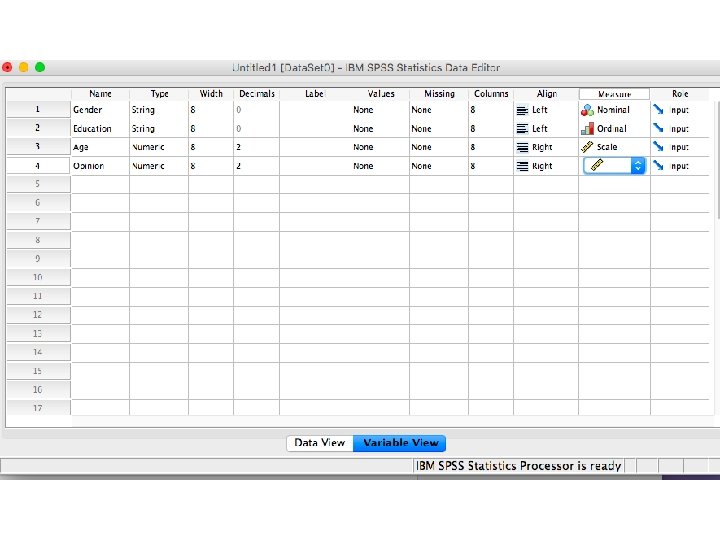
Creating metric and non-metric variables by SPSS Package Program
Let’s assume that we have 20 costumers and we collected some basic information about their gender, education, age and opinion about our service. How can we design the database by using SPSS Package Program?
Creating metric and non-metric variables by EViews Package Program
The Title Bar The title bar, labeled EViews, is at the very top of the main window. When EViews is the active program in Windows, the title bar has a color and intensity that differs from the other windows (generally it is darker). The Main Menu Just below the title bar is the main menu. If you move the cursor to an entry in the main menu and click on the left mouse button, a drop-down menu will appear. Clicking on an entry in the drop-down menu selects the highlighted item.
For example, here we click on the Object entry in the main menu to reveal a drop-down menu. Notice that some of the items in the drop-down menu are listed in black and others are in gray. In menus, black items may be executed while the gray items are not available. In this example, you cannot create a New Object or Store an object, but you can Print and View Options.
Below the menu bar is an area called the command window. EViews commands may be typed in this window. The area in the middle of the window is the work area where Eviews will display the workfile window the various other windows that it creates.
Getting Data into Eviews: you may use the File/Open/Foreign Data as Workfile. . . dialog, selecting Files of type Excel and selecting the desired file.
When EViews opens “Demo. XLS”, it determines that the file is in Excel file format, analyzes the contents, and opens the Excel Read wizard.
The first page of the wizard includes a preview of the data found in the spreadsheet. In most cases, you need not worry about any of the options on this page. In more complicated cases, you may use the options on this page to provide a custom range of cells to read, or to select a different sheet in the workbook. The second page of the wizard contains various options for reading the Excel data. These options are set at the most likely choices given the EViews analysis of the contents of your workbook. In most cases, you should simply click on Finish to accept the default settings. In other cases where the preview window does not correctly display the desired data, you may click on Next and adjust the options that appear on the second page of the wizard. In our example, the data appear to be correct, so we simply click on Finish to accept the default settings.
When you accept the settings, EViews automatically creates a workfile that is sized to hold the data, and imports the series into the workfile. The workfile ranges from 1952 quarter 1 to 1996 quarter 4, and contains five series (GDP, M 1, OBS, PR, and RS) that you have read from the Excel file. There also two objects, the coefficient vector C and the series RESID, that are found in all EViews workfiles.
Select all of the series, right-click, and select Open/as Group. EViews will open the selected series in spreadsheet view.
Examining the Data: Now that you have your data in an EViews workfile, you may use basic EViews tools to examine the data in your series and groups in a variety of ways.
First, we examine the characteristics of individual series. To see the contents of the M 1 series, simply double click on the M 1 icon in the workfile window, or select Quick/Show… in the main menu, enter m 1, and click on OK. EViews will open the M 1 series object and will display the default spreadsheet view of the series. Note the description of the contents of the series (“Series: M 1”) in the upper leftmost corner of the series window toolbar, indicating that you are working with the M 1 series.
You will use the entries in the View and Proc menus to examine various characteristics of the series. Simply click on the buttons on the toolbar to access these menu entries, or equivalently, select View or Proc from the main menu. To compute, for example, a table of basic descriptive statistics for M 1, simply click on the View button, then select Descriptive Statistics & Tests/Stats Table. EViews will compute descriptive statistics for M 1 and change the series view to display a table of results.