Introduction to Connectivity restingstate and PPI Josh Kahan

- Slides: 32
Introduction to Connectivity: resting-state and PPI Josh Kahan Slides adapted from Mf. D 2013 by Dana Boebinger & Lisa Quattrocki Knight (Thanks guys) Wednesday 5 th March 2014
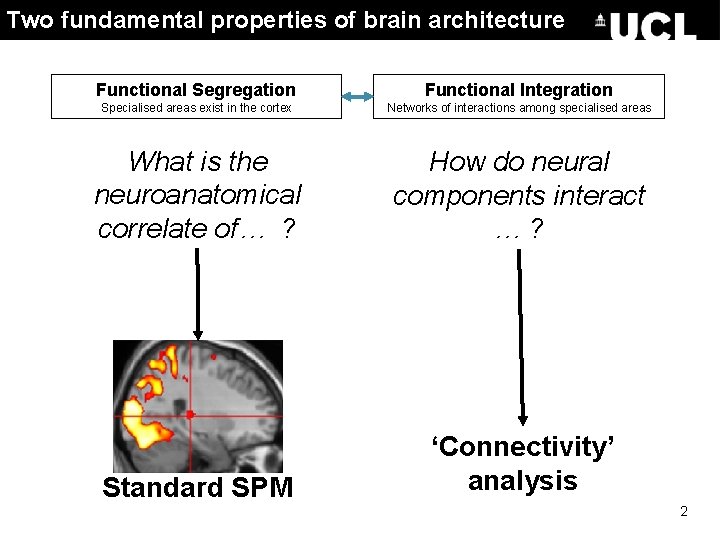
Two fundamental properties of brain architecture Functional Segregation Functional Integration Specialised areas exist in the cortex Networks of interactions among specialised areas What is the neuroanatomical correlate of… ? How do neural components interact …? Standard SPM ‘Connectivity’ analysis 2
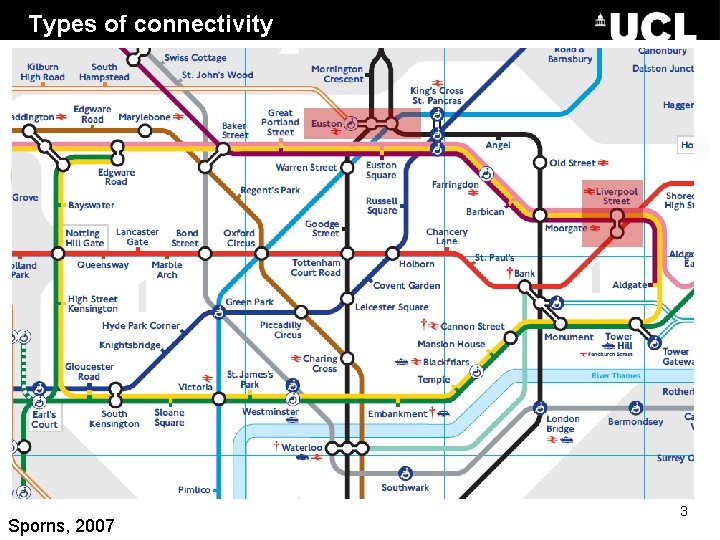
Types of connectivity Anatomical/structural connectivity presence of axonal connections � example: tracing techniques, DTI Is there a detectable physical connection between…? Sporns, 2007 3
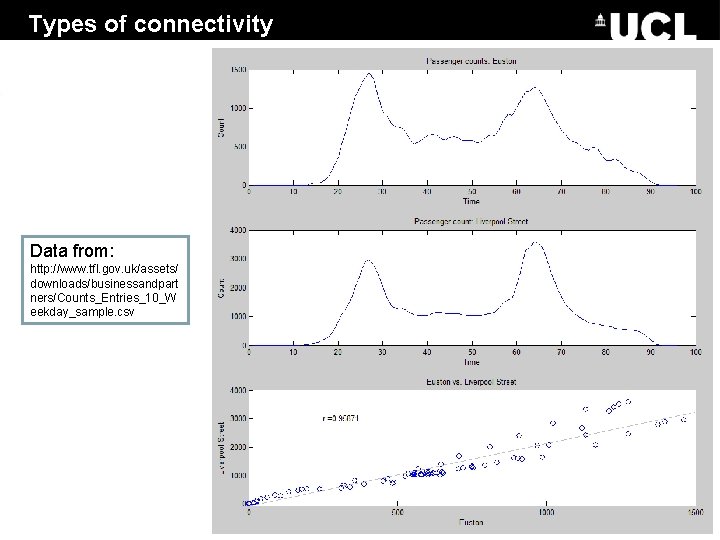
Types of connectivity Data from: http: //www. tfl. gov. uk/assets/ Functional connectivity statistical dependencies between regional time series downloads/businessandpart - ners/Counts_Entries_10_W Simple temporal correlation between activation of remote neural areas Descriptive in nature; establishing whether correlation between areas is significant example: seed voxel, eigen-decomposition (PCA, SVD), independent component analysis (ICA) eekday_sample. csv - Is activity here correlated with activity there? Sporns, 2007 4
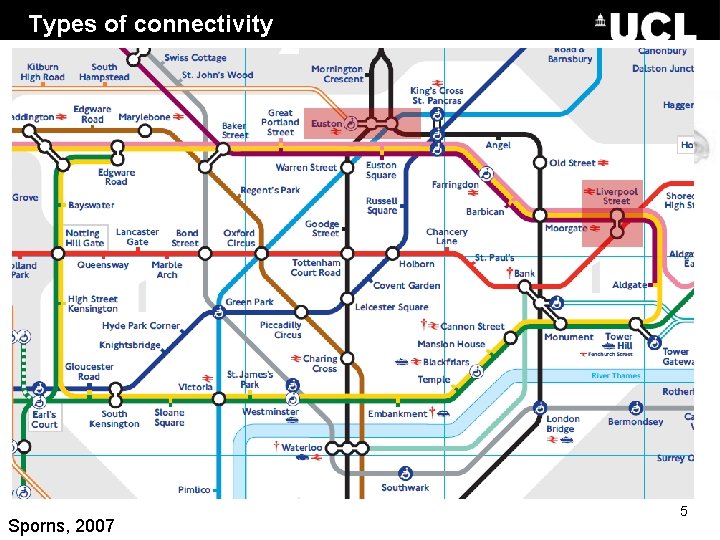
Types of connectivity Effective connectivity causal/directed influences between neurons or populations - The influence that one neuronal system exerts over another (Friston et al. , 1997) Model-based; analysed through model comparison or optimisation examples: PPIs - Psycho-Physiological Interactions SEM - Structural Equation Modelling GCM - Granger Causality Modelling DCM - Dynamic Causal Modelling Does activity here cause activity there? Sporns, 2007 5
“Resting-state” f. MRI 6
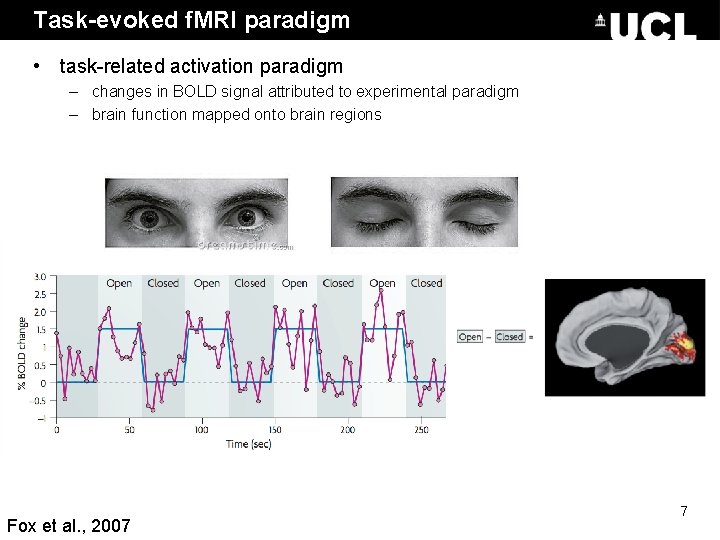
Task-evoked f. MRI paradigm • task-related activation paradigm – changes in BOLD signal attributed to experimental paradigm – brain function mapped onto brain regions Fox et al. , 2007 7
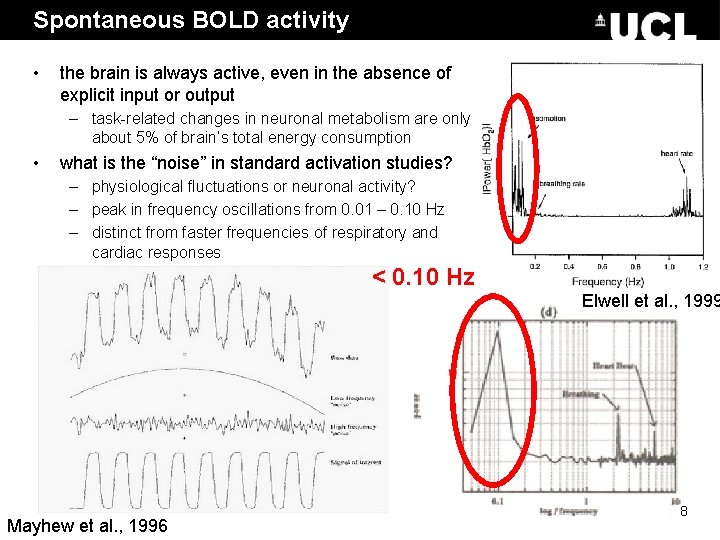
Spontaneous BOLD activity • the brain is always active, even in the absence of explicit input or output – task-related changes in neuronal metabolism are only about 5% of brain’s total energy consumption • what is the “noise” in standard activation studies? – physiological fluctuations or neuronal activity? – peak in frequency oscillations from 0. 01 – 0. 10 Hz – distinct from faster frequencies of respiratory and cardiac responses < 0. 10 Hz Elwell et al. , 1999 Mayhew et al. , 1996 8
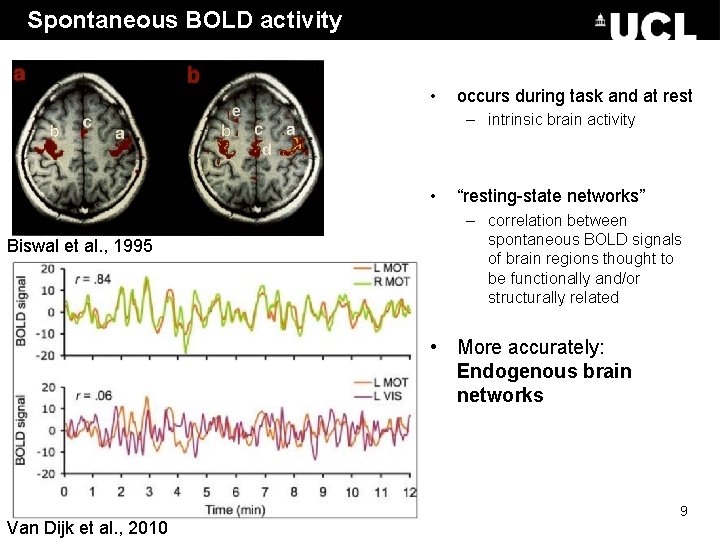
Spontaneous BOLD activity • occurs during task and at rest – intrinsic brain activity • Biswal et al. , 1995 “resting-state networks” – correlation between spontaneous BOLD signals of brain regions thought to be functionally and/or structurally related • More accurately: Endogenous brain networks Van Dijk et al. , 2010 9
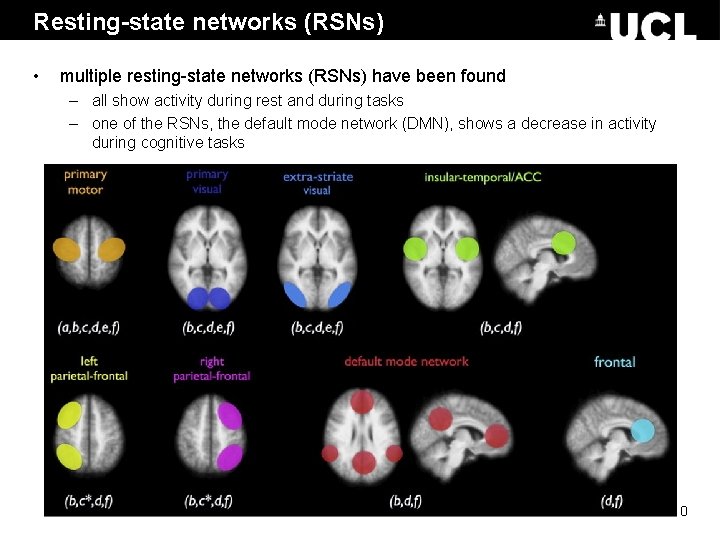
Resting-state networks (RSNs) • multiple resting-state networks (RSNs) have been found – all show activity during rest and during tasks – one of the RSNs, the default mode network (DMN), shows a decrease in activity during cognitive tasks 10
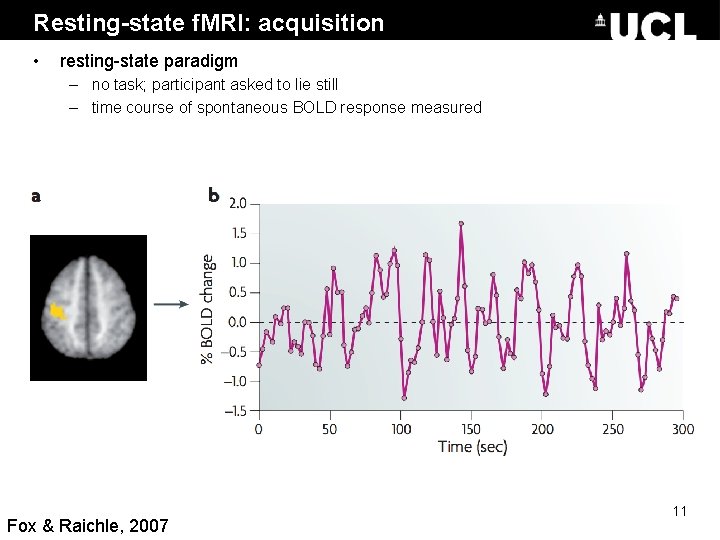
Resting-state f. MRI: acquisition • resting-state paradigm – no task; participant asked to lie still – time course of spontaneous BOLD response measured Fox & Raichle, 2007 11
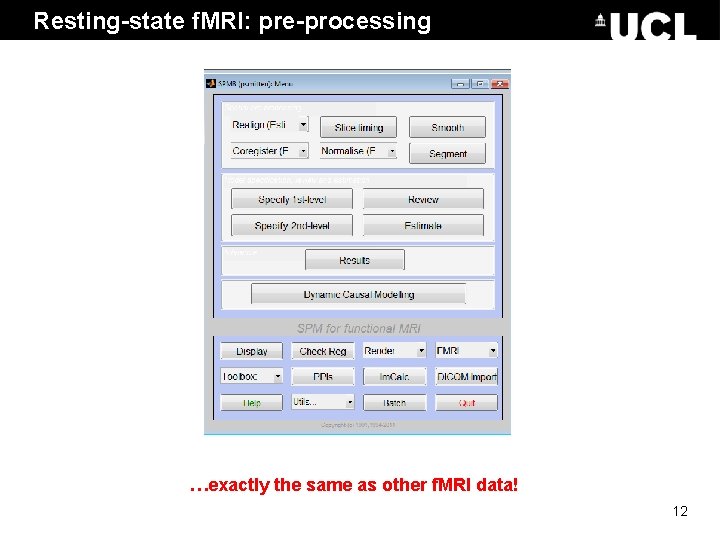
Resting-state f. MRI: pre-processing …exactly the same as other f. MRI data! 12
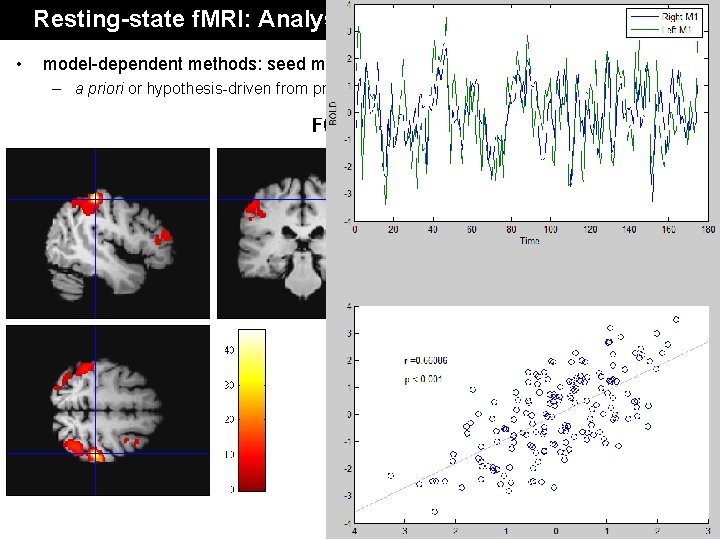
Resting-state f. MRI: Analysis • model-dependent methods: seed method – a priori or hypothesis-driven from previous literature Data from: Single subject, taken from the FC 1000 open access database. Subject code: sub 07210 13
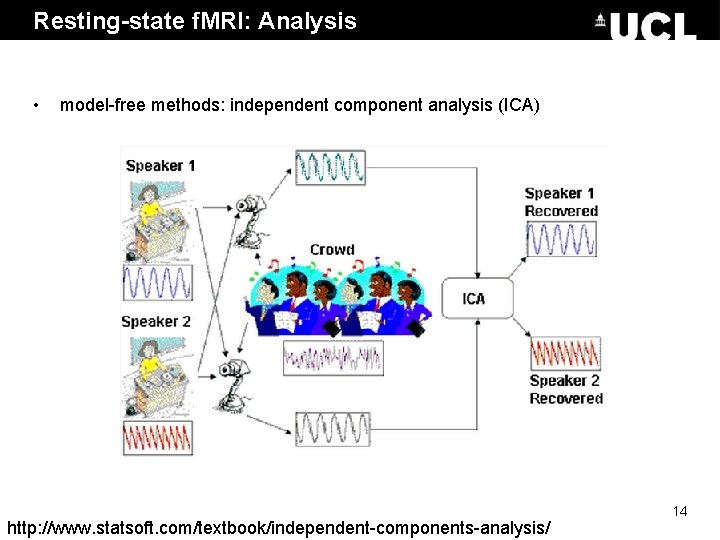
Resting-state f. MRI: Analysis • model-free methods: independent component analysis (ICA) http: //www. statsoft. com/textbook/independent-components-analysis/ 14
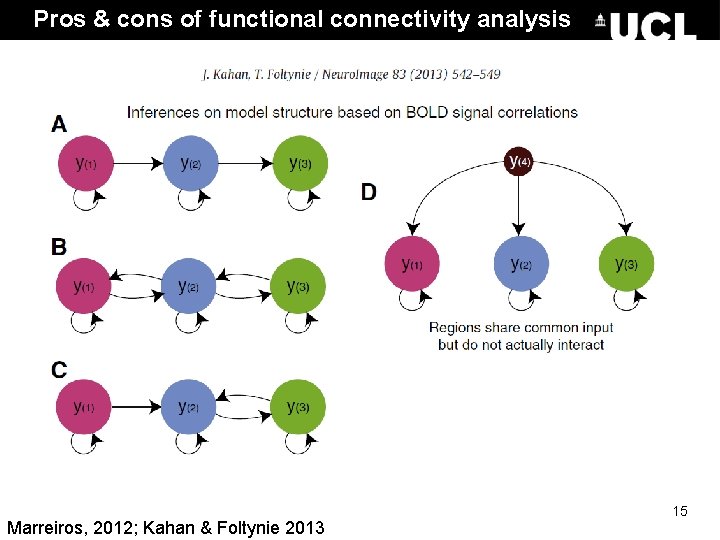
Pros & cons of functional connectivity analysis • Pros: – free from experimental confounds – makes it possible to scan subjects who would be unable to complete a task (i. e. Alzheimer’s patients, disorders of consciousness patients) – useful when we have no experimental control over the system of interest and no model of what caused the data (i. e. sleep, hallucinations, etc. ) • Cons: – merely descriptive – no mechanistic insight – usually suboptimal for situations where we have a priori knowledge / experimental control Effective connectivity Marreiros, 2012; Kahan & Foltynie 2013 15
Psychophysiological Interactions 16
Correlation vs. Regression • Continuous data • Assumes relationship between two variables is constant • Pearson’s r • No directionality • Continuous data • Tests for influence of an explanatory variable on a dependent variable • Least squares method Are two datasets related? Is dataset 1 a function of dataset 2? i. e. can we predict 1 from 2? 17 Adapted from D. Gitelman, 2011
Psychophysiological Interaction • Measures ‘effective’ connectivity: how psychological variables or external manipulations change the coupling between regions. • A change in the regression coefficient between two regions during two different conditions determines significance. 18
PPI: Experimental Design Key question: How can brain activity be explained by the interaction between psychological and physiological variables? • Factorial Design • Plausible conceptual anatomical model or hypothesis: e. g. How can brain activity in V 5 (motion detection area) be explained by the interaction between attention and V 2 (primary visual cortex) activity? • Neuronal model 19
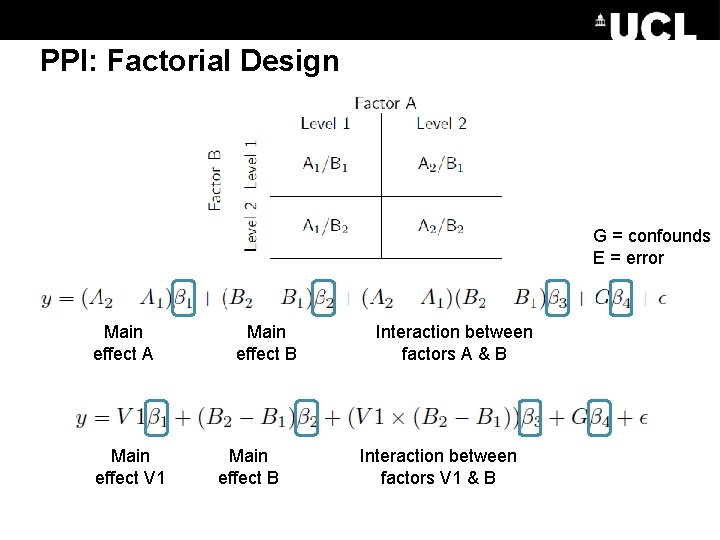
PPI: Factorial Design G = confounds E = error Main effect A Main effect V 1 Main effect B Interaction between factors A & B Interaction between factors V 1 & B
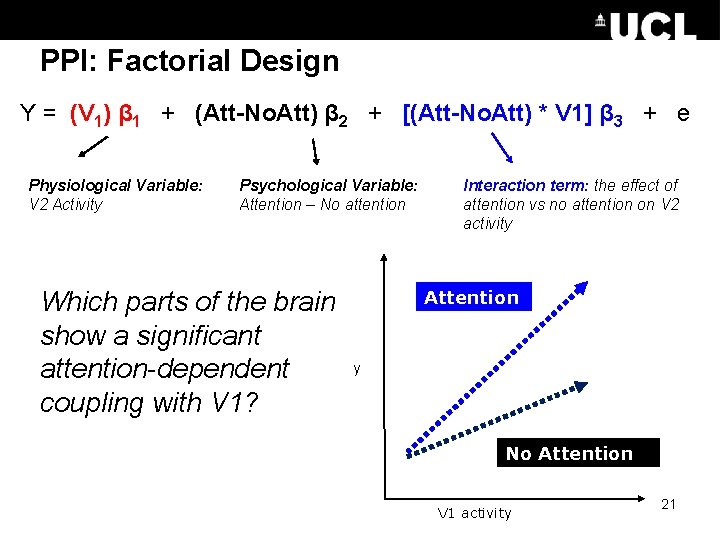
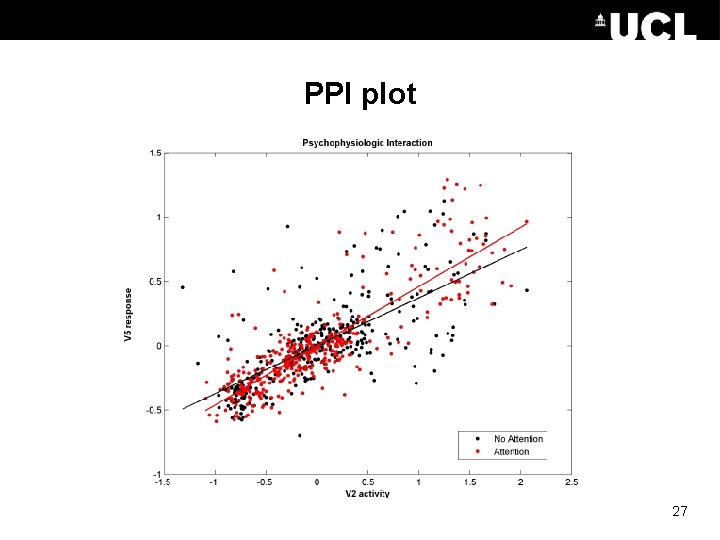
PPI: Factorial Design Y = (V 1) β 1 + (Att-No. Att) β 2 + [(Att-No. Att) * V 1] β 3 + e Physiological Variable: V 2 Activity Psychological Variable: Attention – No attention Which parts of the brain show a significant attention-dependent coupling with V 1? Interaction term: the effect of attention vs no attention on V 2 activity Attention y No Attention V 1 activity 21
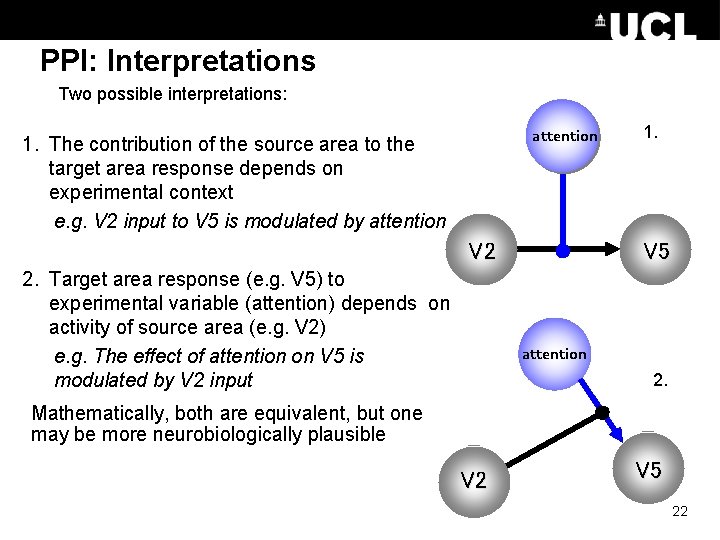
PPI: Interpretations Two possible interpretations: attention 1. The contribution of the source area to the target area response depends on experimental context e. g. V 2 input to V 5 is modulated by attention V 2 V 1 2. Target area response (e. g. V 5) to experimental variable (attention) depends on activity of source area (e. g. V 2) e. g. The effect of attention on V 5 is modulated by V 2 input 1. V 5 attention 2. Mathematically, both are equivalent, but one may be more neurobiologically plausible V 1 V 2 V 5 22
PPI: Deconvolve & create & reconvolve Don’t worry – SPM does this for you. . . 23
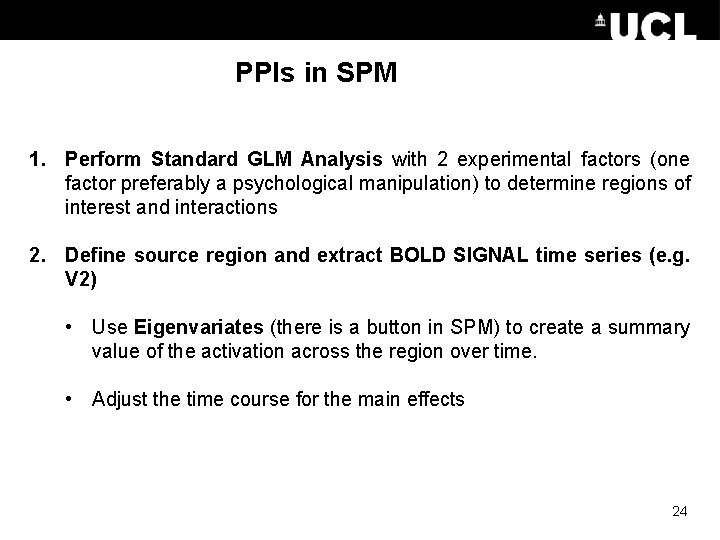
PPIs in SPM 1. Perform Standard GLM Analysis with 2 experimental factors (one factor preferably a psychological manipulation) to determine regions of interest and interactions 2. Define source region and extract BOLD SIGNAL time series (e. g. V 2) • Use Eigenvariates (there is a button in SPM) to create a summary value of the activation across the region over time. • Adjust the time course for the main effects 24
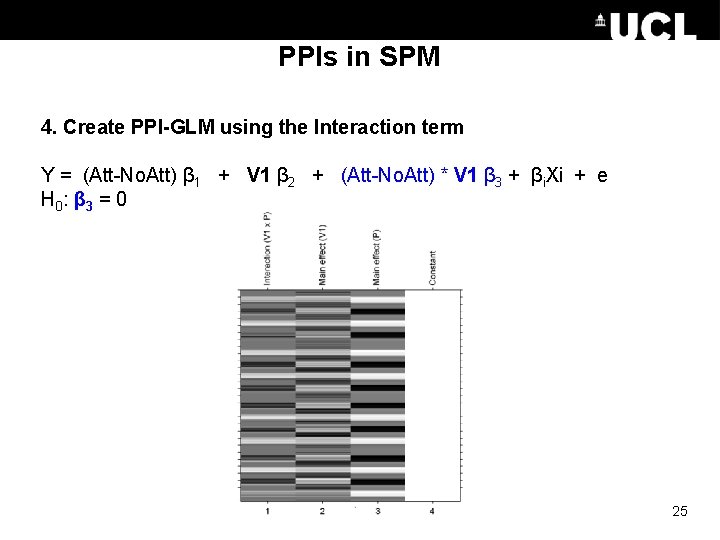
PPIs in SPM 4. Create PPI-GLM using the Interaction term Y = (Att-No. Att) β 1 + V 1 β 2 + (Att-No. Att) * V 1 β 3 + βi. Xi + e H 0 : β 3 = 0 25
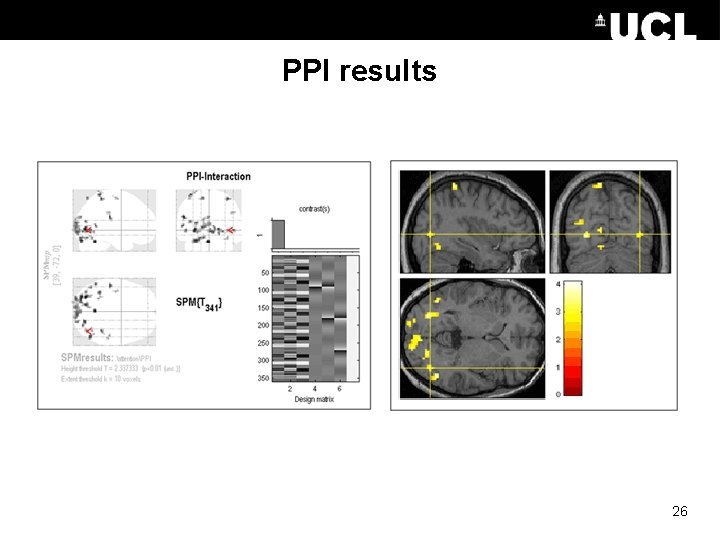
PPI results 26
PPI plot 27
PPI vs. Functional connectivity • PPI’s are based on regressions and assume a dependent and independent variables (i. e. , they assume causality in the statistical sense). • PPI’s explicitly discount main effects 28 Adapted from D. Gitelman, 2011
Pros & Cons of PPIs • Pros: – Given a single source region, PPIs can test for the regions context-dependent connectivity across the entire brain – Simple to perform • Cons: - Very simplistic model: only allows modelling contributions from a single area - Ignores time-series properties of data (can do PPI’s on PET and f. MRI data) • Inputs are not modelled explicitly • Interactions are instantaneous for a given context • Need DCM to elaborate a mechanistic model 29 Adapted from D. Gitelman, 2011
The End Many thanks to Sarah Gregory! & to Dana Boebinger & Lisa Quattrocki Knight for the slides! 30
References previous years’ slides, and… • Biswal, B. , Yetkin, F. Z. , Haughton, V. M. , & Hyde, J. S. (1995). Functional connectivity in the motor cortex of resting human brain using echo-planar MRI. Magnetic Resonance Medicine, 34(4), 537 -41. • Buckner, R. L. , Andrews-Hanna, J. R. , & Schacter, D. L. (2008). The brain’s default network: anatomy, function, and relevance to disease. Annals of the New York Academy of Sciences, 1124, 1– 38. doi: 10. 1196/annals. 1440. 011 • Damoiseaux, J. S. , Rombouts, S. A. R. B. , Barkhof, F. , Scheltens, P. , Stam, C. J. , Smith, S. M. , & Beckmann, C. F. (2006). Consistent resting-state networks, (2). • De Luca, M. , Beckmann, C. F. , De Stefano, N. , Matthews, P. M. , & Smith, S. M. (2006). f. MRI resting state networks define distinct modes of long-distance interactions in the human brain. Neuro. Image, 29(4), 1359– 67. doi: 10. 1016/j. neuroimage. 2005. 08. 035 • Elwell, C. E. , Springett, R. , Hillman, E. , & Delpy, D. T. (1999). Oscillations in Cerebral Haemodynamics. Advances in Experimental Medicine and Biology, 471, 57– 65. • Fox, M. D. , & Raichle, M. E. (2007). Spontaneous fluctuations in brain activity observed with functional magnetic resonance imaging. Nature reviews. Neuroscience, 8(9), 700– 11. doi: 10. 1038/nrn 2201 • Fox, M. D. , Snyder, A. Z. , Vincent, J. L. , Corbetta, M. , Van Essen, D. C. , & Raichle, M. E. (2005). The human brain is intrinsically organized into dynamic, anticorrelated functional networks. Proceedings of the National Academy of Sciences of the United States of America, 102(27), 9673– 8. doi: 10. 1073/pnas. 0504136102 Friston, K. J. (2011). Functional and effective connectivity: a review. Brain connectivity, 1(1), 13– 36. doi: 10. 1089/brain. 2011. 0008 Greicius, M. D. , Krasnow, B. , Reiss, A. L. , & Menon, V. (2003). Functional connectivity in the resting brain: a network analysis of the default mode hypothesis. Proceedings of the National Academy of Sciences of the United States of America, 100(1), 253– 8. doi: 10. 1073/pnas. 0135058100 Greicius, M. D. , Supekar, K. , Menon, V. , & Dougherty, R. F. (2009). Resting-state functional connectivity reflects structural connectivity in the default mode network. Cerebral cortex (New York, N. Y. : 1991), 19(1), 72– 8. doi: 10. 1093/cercor/bhn 059 Kalthoff, D. , & Hoehn, M. (n. d. ). Functional Connectivity MRI of the Rat Brain The Resonance – the first word in magnetic resonance. Kahan & Foltynie (2013). Understanding DCM: Ten simple rules for the clinician Neuro. Image 83 (2013) 542– 549 Marreiros, A. (2012). SPM for f. MRI slides. Smith, S. M. , Miller, K. L. , Moeller, S. , Xu, J. , Auerbach, E. J. , Woolrich, M. W. , Beckmann, C. F. , et al. (2012). Temporally-independent functional modes of spontaneous brain activity. Proceedings of the National Academy of Sciences of the United States of America, 109(8), 3131– 6. doi: 10. 1073/pnas. 1121329109 Friston KJ, Buechel C, Fink GR et al. Psychophysiological and Modulatory Interactions in Neuroimaging. Neuroimage (1997) 6, 218 -229 Buchel C & Friston KJ. Assessing interactions among neuronal systems using functional neuroimaging. Neural Networks (2000) 13; 871 -882. Gitelman DR, Penny WD, Ashburner J et al. Modeling regional and neuropsychologic interactions in f. MRI: The importance of hemodynamic deconvolution. Neuroimage (2003) 19; 200 -207. http: //www. fil. ion. ucl. ac. uk/spm/data/attention/ http: //www. fil. ion. ucl. ac. uk/spm/doc/mfd/2012/ http: //www. fil. ion. ucl. ac. uk/spm/doc/manual. pdf http: //www. neurometrika. org/resources 31 Graphic of the brain is taken from Quattrocki Knight et al. , submitted. Several slides were adapted from D. Gitelman’s presentation for the October 2011 SPM course at MGH • • • •
PPI Questions • How is a group PPI analysis done? – The con images from the interaction term can be brought to a standard second level analysis (onesample t-test within a group, two-sample t-test between groups, ANOVA’s, etc. ) 32 Adapted from D. Gitelman, 2011