Inequality and Childrens Life Chances Mary Clare Lennon


 Pursuing the American Dream: Economic")

 obscures what is happening at the")


. ‘Fairness for Children:")
 Note USA’s position 12")


 • The Neighborhood Change Database (NCDB) contains data from the")


")
 Policy implications § Reducing exposure to poverty in childhood requires both investment in")
 Research implications § While the evidence linking poverty and child well-being is convincing,")
 Additional references Becker, G. (1991). A Treatise on the Family, Cambridge, MA: Harvard")
- Slides: 41
Inequality and Children’s Life Chances Mary Clare Lennon The Graduate Center, CUNY Inequality by the Numbers June 10, 2014
Inequality is multi- dimensional • Inequality is multi-dimensional and includes differential access to resources based on the child’s economic circumstances, race, caste, ethnicity, age and gender, among other characteristics. • Forms of inequality affect children from their early years and shape their future life chances. • Today’s talk will focus on the economic dimensions of inequality in childhood and their association with well-being both in childhood and into adulthood. • I focus on two dimensions of economic inequality: household poverty and neighborhood economic disadvantage, both of which are shaped by economic inequality and affect child development and transitions into adulthood. 2
Rising inequality can reduce children’s opportunities for mobility According to The OECD: Rising income inequality “can stifle upward social mobility, making it harder for talented and hard-working people to get the rewards they deserve. Intergenerational earnings mobility is low in countries with high inequality such as Italy, the United Kingdom, and the United States, and much higher in the Nordic countries, where income is distributed more evenly. ” Source: OECD (2011) Divided we stand: Why inequality keeps rising. Paris: Organization for Economic Cooperation and Development, . 3
Income mobility across generations Source: Pew Charitable Trust (2012) Pursuing the American Dream: Economic Mobility Across Generations 4
The growing gap between the top 10% and the bottom 10% is well documented 50% Top 10% Income Share 45% 40% 35% 30% Excluding capital gains Including capital gains 2007 2002 1997 1992 1987 1982 1977 1972 1967 1962 1957 1952 1947 1942 1937 1932 1927 1922 1917 25% Source: Piketty & Saez (2009): http: //www. econ. berkeley. edu/~saez/Tab. Fig 2007. xls 5
The focus on the top 10% (or 1%) obscures what is happening at the bottom Less well studied is how those in the bottom half of the distribution are faring under growing inequality. Their situation has become worse after the Great Recession for several reasons, including Ø Fewer “good jobs” available Ø Decline in real wages Ø Weakened governmental redistribution policies 6
Measuring household economic circumstances Various measures have been proposed to assess children’s economic circumstances There are two basic approaches: – Relative: defined in terms of the society in which an individual lives (e. g, poverty as 50%nor 60% of a country’s median income); it differs between countries and over time – Absolute: defined in terms of a fixed standard (e. g. living on less than $1. 90 person per day [World Bank definition]); it is the same in all countries and does not change over (short periods of) time. 7
Relative measures of poverty Relative measures have the advantage of taking into account each country’s standard of living. According to Peter Townsend, relative poverty measures indicate that a household has "resources that are so seriously below those commanded by the average individual or family that they are, in effect, excluded from ordinary living patterns, customs and activities” In Europe the standard definition of income poverty is having equivalized disposable income below 60 % of the national median equivalized disposable income (after social transfers). Source: Townsend, P. (1979) Poverty in the United Kingdom, London, Allen Lane and Penguin Books, p. 31. 8
Relative measures of poverty In a study of income inequality among children in rich nations, UNICEF used two relative indicators: 1. The gap between the incomes of children in the 10 th poorest quintile and the median income in that country, defined as a percentage of the median. 2. The proportion of children in households with less than 50% of their country’s median income UNICEF Office of Research (2016). ‘Fairness for Children: A league table of inequality in child well-being in rich countries’, Innocenti Report Card 13, UNICEF Office of Research – Innocenti, Florence. 9
Finland Norway Denmark Netherlands Czech Republic Iceland Ireland Switzerland Germany Republic of Korea Slovenia France Sweden Cyprus United Kingdom Australia Austria Belgium New Zealand Estonia Luxembourg Slovakia Malta Poland Croatia Hungary Japan Latvia Canada Portugal Italy Lithuania United States Spain Greece Turkey Bulgaria Romania Mexico Chile Israel Relative income gap: Rich countries 30. 0 25. 0 20. 0 15. 0 10. 0 5. 0 0. 0 Source: UNICEF Office of Research (2016). ‘Fairness for Children: A league table of inequality in child well-being in rich countries’, Innocenti Report Card 13, UNICEF Office of Research – Innocenti, Florence. 10
Relative child poverty: Rich countries Source: UNICEF Office of Research (2016). ‘Fairness for Children: A league table of inequality in child wellbeing in rich countries’, Innocenti Report Card 13, UNICEF Office of Research – Innocenti, Florence. 11
Child poverty and child well -being (2009) Note USA’s position 12
Issues with relative measures of poverty • One disadvantage of relative measures is that countries or states in the US have vastly different income distributions. Thus, according to the ACS, the median income in the US was $53, 482 in 2014 (60% of median=$32, 089). If poverty were defined with that threshold, then many more poor individuals would be identified in Albany than in Manhattan which has a higher median income but much greater the cost of living. • Another disadvantage is that as income changes, the threshold for poverty changes. Thus, when incomes fall (as they have for many after the Great Recession), a relative indicator of poverty would show that poverty declines over time. Sources: www. census. gov/acs/www/data-tables-and-tools/data-profiles/2014/; http: //money. cnn. com/calculator/pf/cost-of-living/ 13
Absolute measures of poverty Absolute measures use the same standard across countries. They are designed to indicate an income level below which a person’s minimum nutritional, clothing, and shelter needs cannot be met. • The World Bank used poverty lines from the poorest countries in the world and converted them to a common currency by using purchasing power parity (PPP) exchange rates. The PPP exchange rates are constructed to ensure that the same quantity of goods and services is priced equivalently across countries. In 2012, the PPP standard for extreme poverty was defined as less than $1. 90 person per day. • While the World Bank’s data do not include the US, recent research by Edin and Shaefer finds that since welfare reform in the US, there has been a dramatic rise in the number of households with children that live on cash incomes of $2 person per day. Using national data from the SIPP, they estimate the number to be one and a half million American households, including about three million children. They also conducted an ethnographic study that describes the vast difficulties that the extremely poor face. Sources: -Ferreira, F. H. G. , et al. 2015. A Global Count of the Extreme Poor in 2012: Data Issues, Methodology and Initial Results. Manuscript. Washington, DC: The World Bank. -Edin, Kathy & Shaefer, H. Luke. 2015. $2. 00 a Day: Living on Almost Nothing in America. NY: Houghton, Mifflin, Harcourt. 14
Absolute measures of poverty: US Census Bureau In the United States, a poverty standard was developed in the early 1960’s by an economist in the SSA, Mollie Orshansky, and was used to measure progress in the “War Against Poverty”. The “Oshanshy index” was based on an estimate of the amount of after-tax income families of different sizes needed for food. For example, since the Dept. of Agriculture found that families of three or more persons spent about one third of their after-tax income on food, for these families, poverty thresholds were set at three times the cost of the economy food plan. This is the basis for the federal government’s “official poverty” measure and it has been adjusted for inflation ever since. 15
Absolute measures of poverty: US Census Bureau 16
Trends in Child Poverty: 1959 -2014 Source: Child Trends Data Bank, Children in Poverty, December 2015 www. childtrends. org/? indicators=children-in-poverty 17
Issues with absolute measures of poverty Defining a threshold is difficult and arbitrary. • In Argentina, for example, $1. 90 person per day is an extremely low threshold, with just 4% of the population living with that little income. In Liberia, by contrast, more than two-thirds of the population is poor (68. 6%) but it is unlikely that Argentina has only 6% the poverty rate of Liberia (http: //povertydata. worldbank. org/poverty/home/) • The US poverty thresholds are the same for those living in Manhattan as they are for those in Utica NY where costs are much lower • When the US official poverty threshold was established, food was more expensive than it is now constituting 1/3 of household spending; today, food costs are relatively less, while housing takes a disproportionate share of family budgets than in the 1960’s when the measure was developed. 18
Issues with absolute measures of poverty • The US poverty threshold does not take into account governmental transfers, such as the EITC or Food Stamps, which reduce poverty. • Nor does the US poverty threshold take cost of living into account • To account for the problems with the official poverty measure, the government now includes a supplemental measure that takes the cost of living into account, as well as governmental transfers (cash and non-cash). (see, Short, K. 2015. The Supplemental Poverty Measure: 2014, Current Population Reports, P 60 -254, U. S. Census Bureau 19
Trends in child poverty: Official and supplemental measures http: //www. childtrends. org/child-poverty-in-the-aftermath-of-the-great-recession/ 20
Poverty and child outcomes “Aw, great. Humble beginnings. ”
Poverty and child outcomes Most research in the US on poverty and children’s life chances use the official government’s poverty thresholds, both to characterize family poverty and neighborhood-level poverty. • In the next set of slides I will first describe the association of growing income inequality with growing child poverty • I will then briefly examine evidence on how household poverty affects child well-being, focusing on behavioral and cognitive outcomes in childhood and on employment and education in adulthood. • Then, I will discuss the influence of neighborhood-level poverty in childhood and beyond
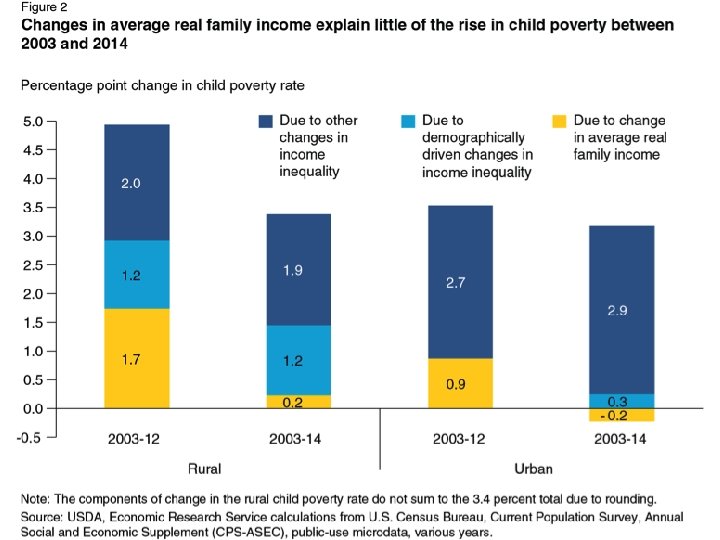
Increased child poverty associated with increased income inequality Using data from the Current Population Survey, the US Department of Agriculture evaluated the contribution of the following 3 factors to the increase in child poverty between 2003 and 2014: – Changes in inequality – Changes in demographic factors linked to inequality (e. g. , marital status, age distribution) – Changes in real income Hertz, Thomas and Tracey Farrigan. Understanding the Rise in Rural Child Poverty, 2003 -2014, ERR 208, U. S. Department of Agriculture, Economic Research Service, May 2016. www. ers. usda. gov/media/2088379/err 208 a. pdf 23
Poverty and child outcomes Two theoretical models like poverty in childhood to educational, behavioral, and health problems. According to social stress frameworks, poverty exposes families to various stressors, at times, taxing their ability to cope. In considering effects on children, the family stress model posits that a parent’s capacity to interact positively with her or his child may be undermined when the parent is exposed to stressful conditions (Conger & Elder, 1994). Ultimately, children in such circumstances develop behavioral and school problems. In addition, children’s own exposure to the stress of poverty may affect their brain development, reducing their ability to deal with future stressful events (Shonkoff, et al, 2102). Parental investment frameworks argue that parents invest their time and money in their children, buying, for example, housing in good areas, learning experiences, high-quality childcare and spending time cultivating children’s learning. Poor families have limited resources to devote to their children, and, hence, children fall behind socially and academically.
Poverty and child outcomes: School readiness at age 5 Note: School readiness is a composite measure of math and reading skills, health, and behavioral problems http: //www. brookings. edu/research/papers/2012/03/19 -school-disadvantage-isaacs.
Poverty and child outcomes: High school dropout Source: Chapman, C. , Laird, J. Ifnil, N. and Kewal. Ramani, A. (2011) Trends in high school dropout and completion rates in the United states: 1972 -2009 (NCES 2012 -06) US Dept. of education. Washington, DC: National Center for Education Statistics. http: //nces. ed. gov/pubsearch. Note: low income=bottom quintile; high income=top quintile
Poverty and child outcomes: Mental, emotional and behavioral problems A large body of research documents associations of poverty with child psychological and physical health and behavior problems (see Yoshikawa, et al. , 2102). Poor children and adolescents show: more symptoms of depression more acting-out problems and delinquency worst physical health There is strong evidence from both randomized and natural experiments that reducing poverty improves childwell being. (for reviews, see Magnuson & Votruba-Drzal, 2009). The evidence suggests that effects of increasing income are strongest when they start in early childhood
Childhood poverty trajectories Source: Wagmiller, R. , Lennon, M. C. , Kuang, L. , Alberti, P. and Aber, J. L. 2006. The dynamics of economic disadvantage and children’s life chances. American Journal of Sociology, 71(5): 847 -866
Childhood poverty trajectories: h. s. graduation and employment
Inequality and neighborhood disadvantage § In the US, disparities between the rich and poor and between neighborhoods have increased, especially for families with children § These developments have widen the gap in opportunities for children § Neighborhoods largely determine the type of schools that children will attend, the types of adults and peers they will encounter, the quality of air they will breath, the services they will have access to, the food they will eat, and the playgrounds they have available, all of which shape children’s life chances
Neighborhood poverty has increased in the US • Increased income inequality has meant greater separation between poor and wealthier neighborhoods • Just as child poverty has grown in the US, neighborhood poverty has grown as well • In the past 4 decades, there has been a growth in poor areas, areas that initially were not poor that became poor over time
From: http: //cityobservatory. org/how-poverty-has-deepened-pt-1/33
Neighborhood Change Database (NCDB) • The Neighborhood Change Database (NCDB) contains data from the US Census with tract identifiers that have been harmonized across time • We use NCBD data from decennial censuses in 1970, 1980, 1990 and 2000 and append census data from the American Community Survey (2005 -2009) • Use statistical modeling to assess linear and non-linear change within tract over time • Classify together neighborhoods with similar patterns of change over time 34
Probability of Poverty Neighborhood poverty trajectories: 1970 -2007 1. 0 0. 9 0. 8 0. 7 0. 6 0. 5 0. 4 0. 3 0. 2 0. 1 0. 0 1970 Persistently poor, 6. 3% Moved into poverty, 5. 3% Persistently non-poor, 88. 4% 1980 1990 Axis Title 2000 2007 35
Correlates of neighborhood poverty trajectories We appended these trajectories to data from the Fragile Families and Child Wellbeing Study that contains data for children at birth, and ages 1, 3 and 5. Our preliminary results are that: • • Household income was associated with living in a non-poor area; Parents who experienced job loss were found in persistently poor areas rather than ones that were newly poor or non-poor; Race was highly determinative of neighborhoods. Black and Hispanic children were far more likely to live in persistently poor areas and newly poor areas Public housing residents and those in subsidized housing were in areas of persistent poverty or newly poor areas. In general, children in persistently poor areas show worse cognitive skills and behavior than children in non-poor areas but these differences are largely accounted for by family structure, employment and housing. Children in newly poor areas show somewhat better behavioral outcomes and verbal skills than do children in poor areas but these differences are also accounted for by family structure, employment, and housing. 36
Neighborhoods and child outcomes § Recent research documents the importance of neighborhood environments for children’s life chances § Residing in a poor area is associated with more behavior problems among children, poorer school readiness, and more health problems § These effects are seen in young children; they are also apparent during early adulthood among children raised in disadvantaged areas § However, it is unclear to what extent these effects are causal or reflect neighborhood selection
Neighborhoods and child outcomes § Until recently, results from the Moving to Opportunity (MTO) program, an important randomized trial of neighborhood exposure in the US, showed little effect of neighborhood poverty levels on many child and family outcomes (Ludwig et al. 2013) § A new follow-up analysis of MTO suggests that long-term exposure to neighborhood poverty has strong effects on cognitive and educational outcomes and teen pregnancy by the time children are in their mid-20’s (Chetty, Hendren, and Katz 2015) Children who moved before age 13 had an 31% higher annual income than the control group who lived in much poorer areas Children who moved when older than 13 showed no such benefit of being in a lower poverty area
(Some) Policy implications § Reducing exposure to poverty in childhood requires both investment in policy and in interventions § Policies directed at reducing children’s exposure to poverty include enhancing the EITC, increasing the minimum wage, increasing the child tax credit, improving neighborhoods and reducing exposure to high poverty neighborhoods. In-kind transfers, such as nutrition and health care programs, can help reduce some of the negative effects of poverty, as well. § Interventions include high quality early child care and prekindergarten programs. The evidence suggests that such interventions work best when delivered early (e. g. , (Gennetian & Miller, 2000)
(Some) Research implications § While the evidence linking poverty and child well-being is convincing, less is known about how growing inequality affects this relationship. § The size of effects remains to be established, as studies use different populations, measurements, and variables. § Mechanisms linking poverty to child well-being have been investigated but less is known about whether these mechanisms are casual. § More research is needed on income inequality, neighborhood poverty, and child well-being to determine causality and long-term effects of exposure to neighborhood poverty in childhood.
(Some) Additional references Becker, G. (1991). A Treatise on the Family, Cambridge, MA: Harvard University Press. Conger, R. D. , & Elder, G. H. (1994). Families in Troubled Times: Adapting to Change in Rural America. New York, NY: Aldine de Gruyter. Duncan, G. , et al (2014). Boosting family income to promote child development. The Future of Children, 24(1). Gennetian, L. , & Miller, C. (2000). Reforming welfare and rewarding work: Final report on the Minnesota Family Investment Program: Vol. 2. Effects on children. New York, NY: MDRC. Retrieved from http: //www. mdrc. org/publications/206/full. pdf Leventhal, T. & Brooks-Gunn, J. (2000). The neighborhoods they live in: The effects of neighborhood residence on child and adolescent outcomes. Psychological Bulletin®, 126, 309 -337. Magnuson, K. & Votruba-Drzal, E. (2009). Enduring influences of childhood poverty, ” in Changing Poverty, Changing Policies, eds. M. Cancian and S. Danziger, New York: Russell Sage Foundation. National Research Council and Institute of Medicine (2000) From Neurons to Neighborhoods: The Science of Early Childhood Development. Committee on Integrating the Science of Early Childhood Development. Jack P. Shonkoff and Deborah A. Phillips, eds. Board on Children, Youth, and Families, Commission on Behavioral and Social Sciences and Education. Washington, D. C. : National Academy Press. OECD (2112). Education at a Glance 2012: OECD Indicators. Paris: OECD Publishing. Rumberger, R. W. (2011). Dropping out: Why students drop out of high school and what can be done about it. Cambridge, Mass. : Harvard University Press. Sampson, R. J. , Morenoff, J. D. , & Gannon-Rowley, T. (2002). Assessing "neighborhood effects": Social processes and new directions in research. Annual Review of Sociology, 28, 443 -478. Schindler, H. S. , et al. (2015). Maximizing the potential of early childhood education to prevent externalizing behavior problems: A metaanalysis. J Sch Psychol. , 243 -63. Schindler, H. S. , et al. (2012). The lifelong effects of early childhood adversity and toxic stress. Pediatrics, 129, e 232 -e 246. Shonkoff, J. P. et al. (2012). Leveraging the Biology of Adversity to Address the Roots of Disparities in Health and Development. PNAS, 109 (Suppl. 2), 17302 -17307. Yoshikawa, H. , Aber, J. L. , & Beardslee, W. R. (2012). The effects of poverty on the mental, emotional, and behavioral health of children and youth: Implications for prevention, American Psychologist, 67, 4, 272– 284 41