Identify Parameters Important to Predictions using PPR Identify


- Slides: 27
Identify Parameters Important to Predictions using PPR & Identify Existing Observation Locations Important to Predictions using OPR
PPR Statistics for Exercise 8. 1 c • Files are provided for 2 analyses : 1. MODE=PPR, PARGROUPS=NO – If we could obtain data on any one parameter, which should it be? 2. MODE=PPR, PARGROUPS=YES, 2 parameters per group – If we could obtain data on any pair of parameters, which should they be?
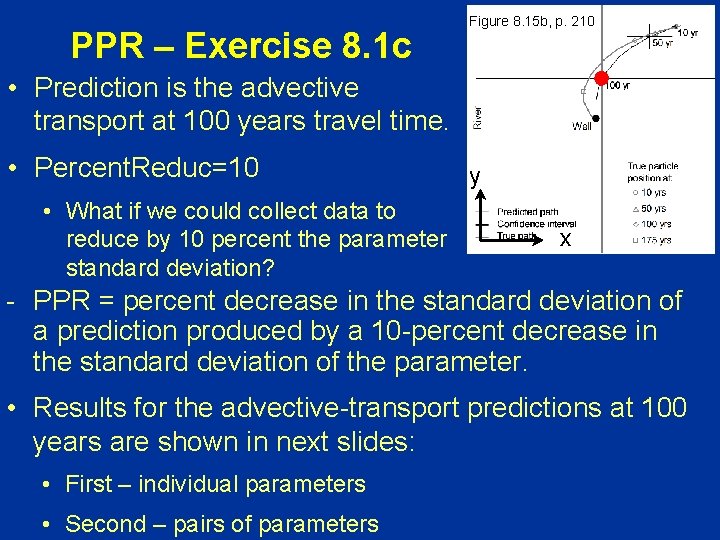
PPR – Exercise 8. 1 c Figure 8. 15 b, p. 210 • Prediction is the advective transport at 100 years travel time. • Percent. Reduc=10 • What if we could collect data to reduce by 10 percent the parameter standard deviation? y x - PPR = percent decrease in the standard deviation of a prediction produced by a 10 -percent decrease in the standard deviation of the parameter. • Results for the advective-transport predictions at 100 years are shown in next slides: • First – individual parameters • Second – pairs of parameters
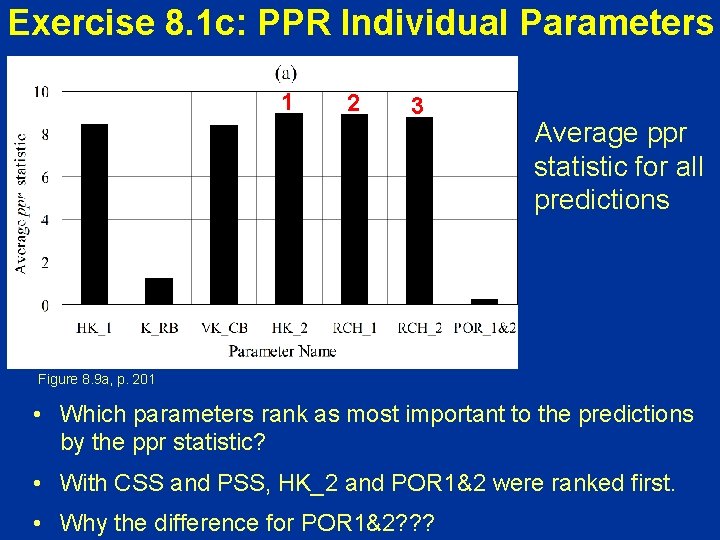
Exercise 8. 1 c: PPR Individual Parameters 1 2 3 Average ppr statistic for all predictions Figure 8. 9 a, p. 201 • Which parameters rank as most important to the predictions by the ppr statistic? • With CSS and PSS, HK_2 and POR 1&2 were ranked first. • Why the difference for POR 1&2? ? ?
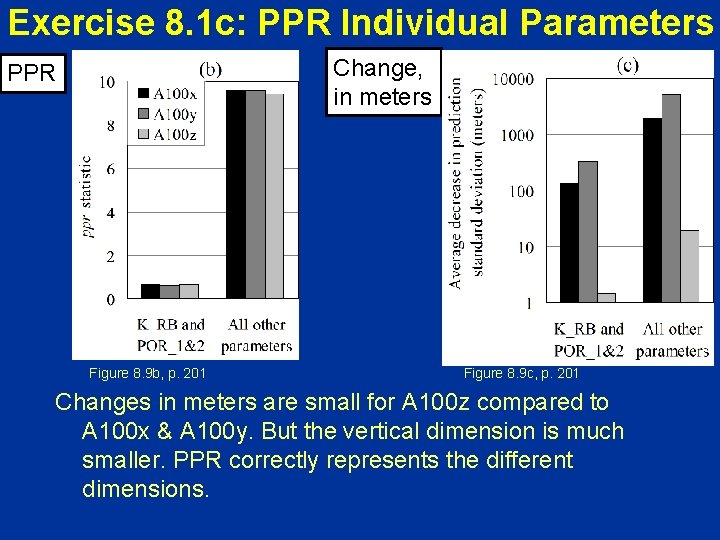
Exercise 8. 1 c: PPR Individual Parameters Change, in meters PPR Figure 8. 9 b, p. 201 Figure 8. 9 c, p. 201 Changes in meters are small for A 100 z compared to A 100 x & A 100 y. But the vertical dimension is much smaller. PPR correctly represents the different dimensions.
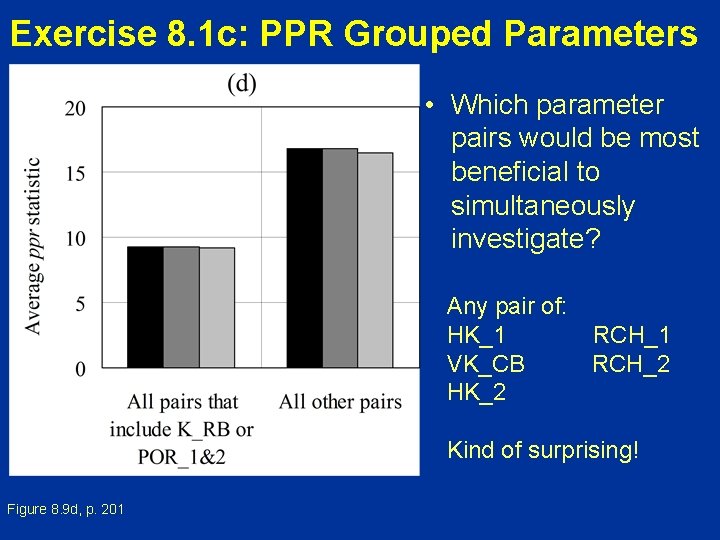
Exercise 8. 1 c: PPR Grouped Parameters • Which parameter pairs would be most beneficial to simultaneously investigate? Any pair of: HK_1 RCH_1 VK_CB RCH_2 HK_2 Kind of surprising! Figure 8. 9 d, p. 201
How is PPR calculated? ? ? • OPR and PPR statistics are based on the calculation of prediction standard deviation, a measure of prediction uncertainty
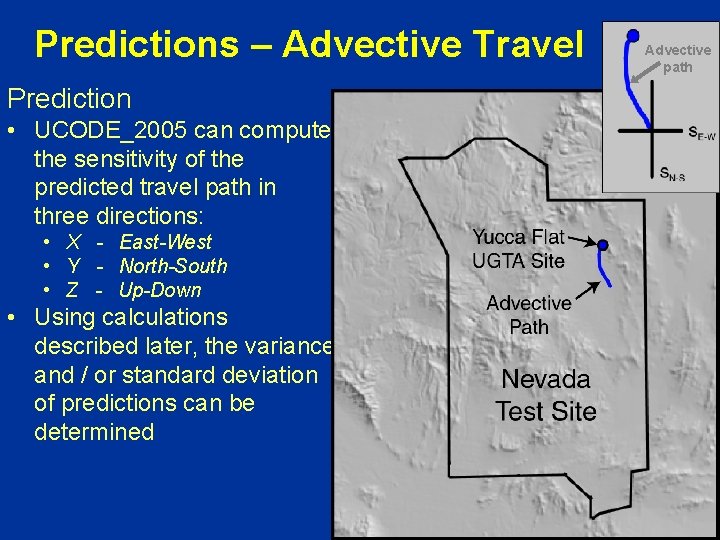
Predictions – Advective Travel Prediction • UCODE_2005 can compute the sensitivity of the predicted travel path in three directions: • X - East-West • Y - North-South • Z - Up-Down • Using calculations described later, the variance and / or standard deviation of predictions can be determined Advective path
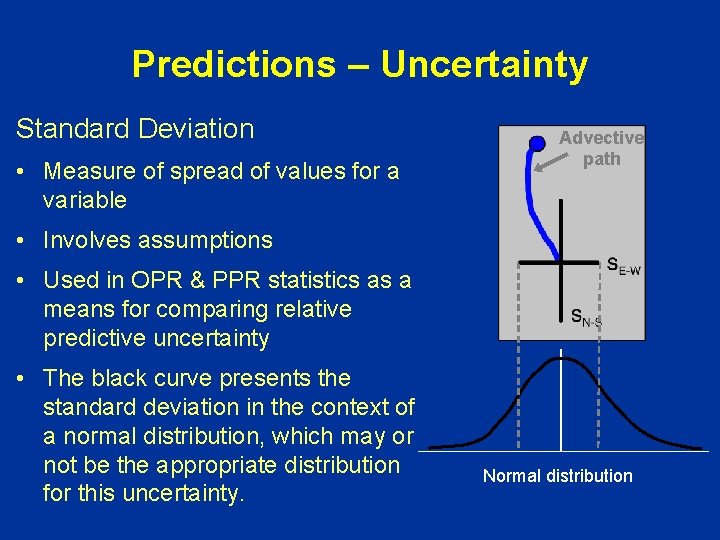
Predictions – Uncertainty Standard Deviation • Measure of spread of values for a variable Advective path • Involves assumptions • Used in OPR & PPR statistics as a means for comparing relative predictive uncertainty • The black curve presents the standard deviation in the context of a normal distribution, which may or not be the appropriate distribution for this uncertainty. Normal distribution
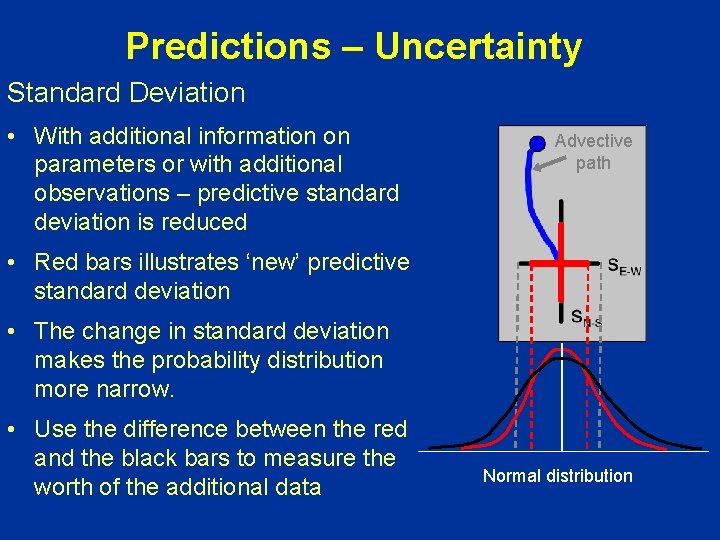
Predictions – Uncertainty Standard Deviation • With additional information on parameters or with additional observations – predictive standard deviation is reduced Advective path • Red bars illustrates ‘new’ predictive standard deviation • The change in standard deviation makes the probability distribution more narrow. • Use the difference between the red and the black bars to measure the worth of the additional data Normal distribution
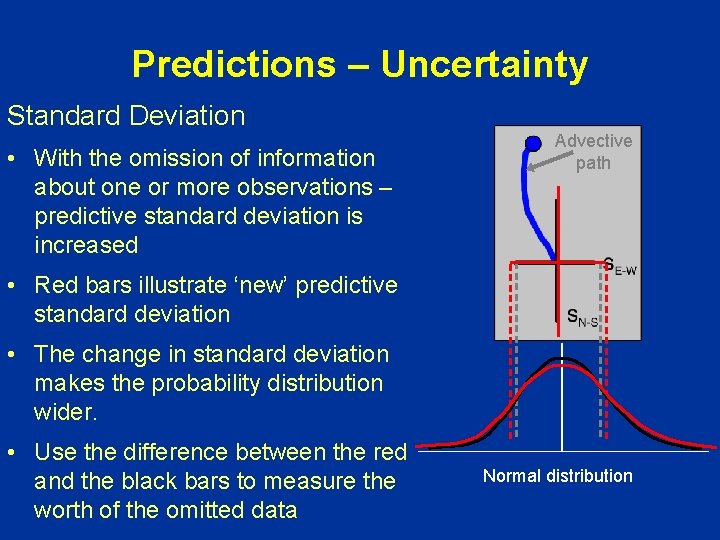
Predictions – Uncertainty Standard Deviation • With the omission of information about one or more observations – predictive standard deviation is increased Advective path • Red bars illustrate ‘new’ predictive standard deviation • The change in standard deviation makes the probability distribution wider. • Use the difference between the red and the black bars to measure the worth of the omitted data Normal distribution
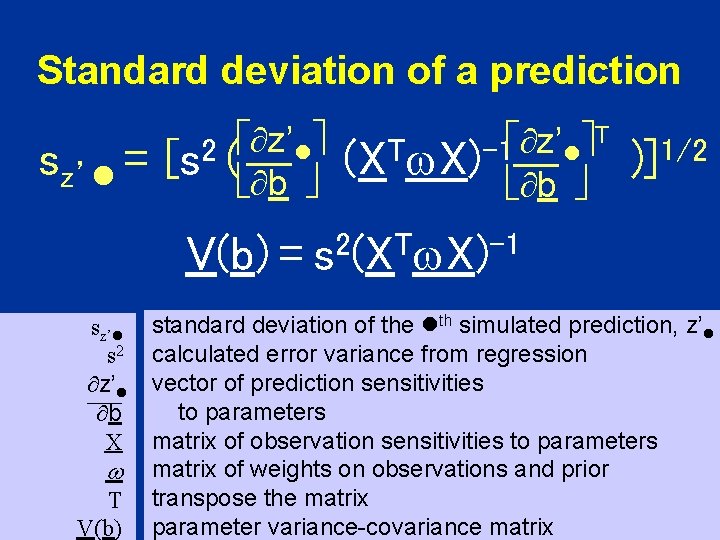
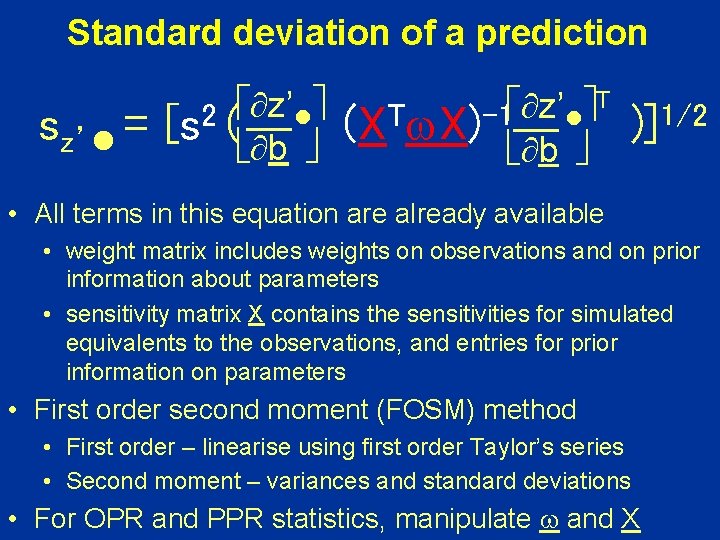
Standard deviation of a prediction sz’ = z’ 2 [s ( b V(b) = sz’ s 2 z’ b X w T V(b) T z’ (XTw. X)-1 b )]1/2 2 T -1 s (X w. X) standard deviation of the th simulated prediction, z’ calculated error variance from regression vector of prediction sensitivities to parameters matrix of observation sensitivities to parameters matrix of weights on observations and prior transpose the matrix parameter variance-covariance matrix
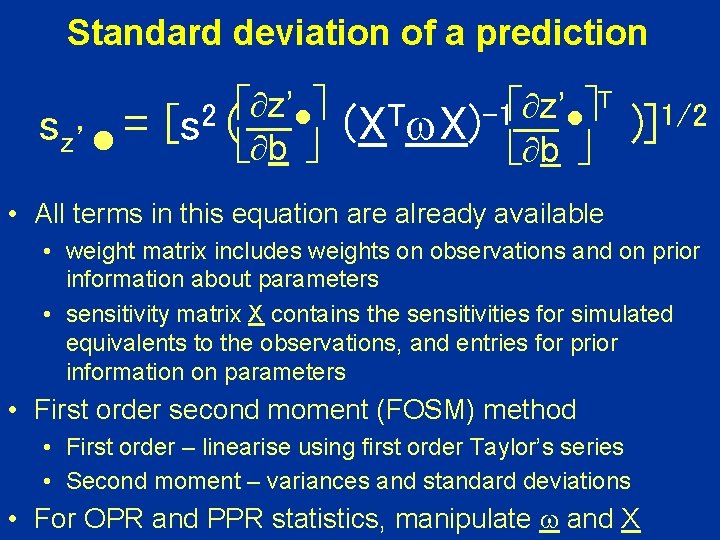
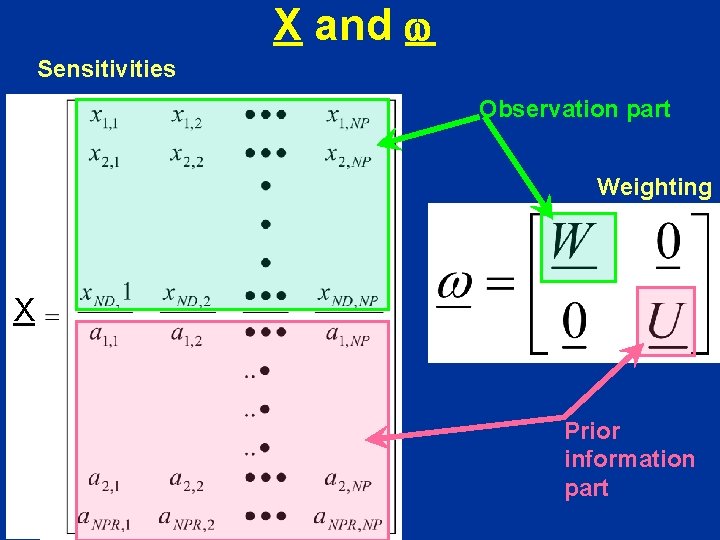
Standard deviation of a prediction sz’ = z’ 2 [s ( b T z’ T -1 (X w. X) b 1/2 )] • All terms in this equation are already available • weight matrix includes weights on observations and on prior information about parameters • sensitivity matrix X contains the sensitivities for simulated equivalents to the observations, and entries for prior information on parameters • First order second moment (FOSM) method • First order – linearise using first order Taylor’s series • Second moment – variances and standard deviations • For OPR and PPR statistics, manipulate w and X
Standard deviation of a prediction sz’ = z’ 2 [s ( b T z’ T -1 (X w. X) b 1/2 )] • All terms in this equation are already available • weight matrix includes weights on observations and on prior information about parameters • sensitivity matrix X contains the sensitivities for simulated equivalents to the observations, and entries for prior information on parameters • First order second moment (FOSM) method • First order – linearise using first order Taylor’s series • Second moment – variances and standard deviations • For OPR and PPR statistics, manipulate w and X
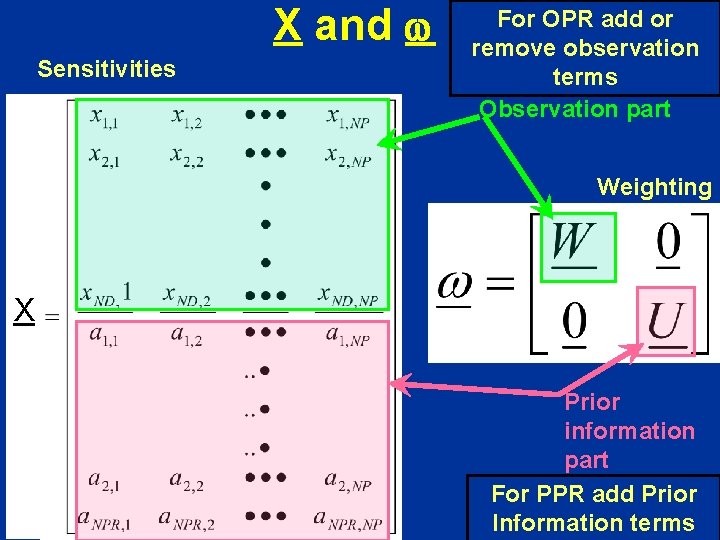
X and w Sensitivities Observation part Weighting X Prior information part
X and w Sensitivities For OPR add or remove observation terms Observation part Weighting X Prior information part For PPR add Prior Information terms
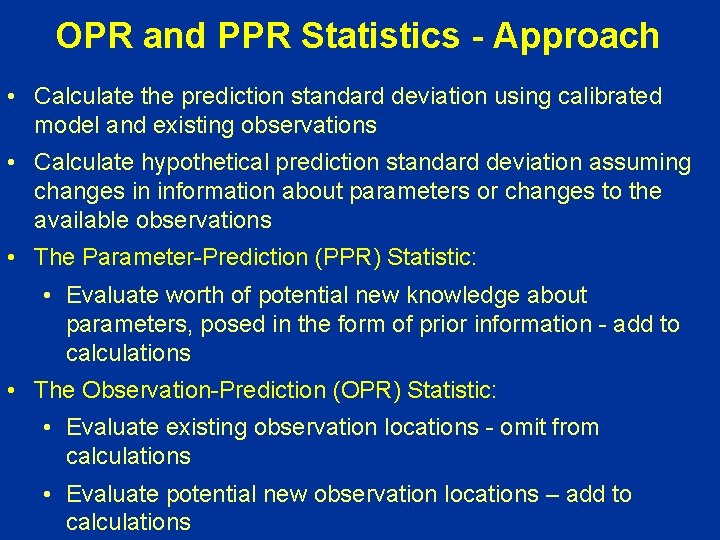
OPR and PPR Statistics - Approach • Calculate the prediction standard deviation using calibrated model and existing observations • Calculate hypothetical prediction standard deviation assuming changes in information about parameters or changes to the available observations • The Parameter-Prediction (PPR) Statistic: • Evaluate worth of potential new knowledge about parameters, posed in the form of prior information - add to calculations • The Observation-Prediction (OPR) Statistic: • Evaluate existing observation locations - omit from calculations • Evaluate potential new observation locations – add to calculations
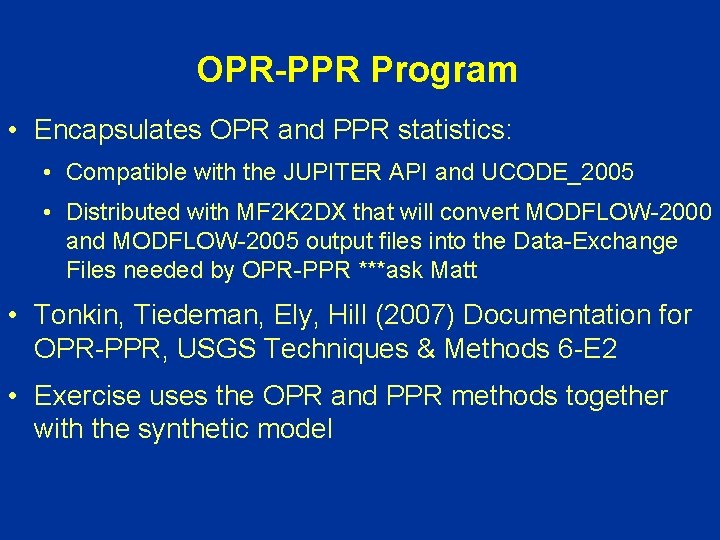
OPR-PPR Program • Encapsulates OPR and PPR statistics: • Compatible with the JUPITER API and UCODE_2005 • Distributed with MF 2 K 2 DX that will convert MODFLOW-2000 and MODFLOW-2005 output files into the Data-Exchange Files needed by OPR-PPR ***ask Matt • Tonkin, Tiedeman, Ely, Hill (2007) Documentation for OPR-PPR, USGS Techniques & Methods 6 -E 2 • Exercise uses the OPR and PPR methods together with the synthetic model
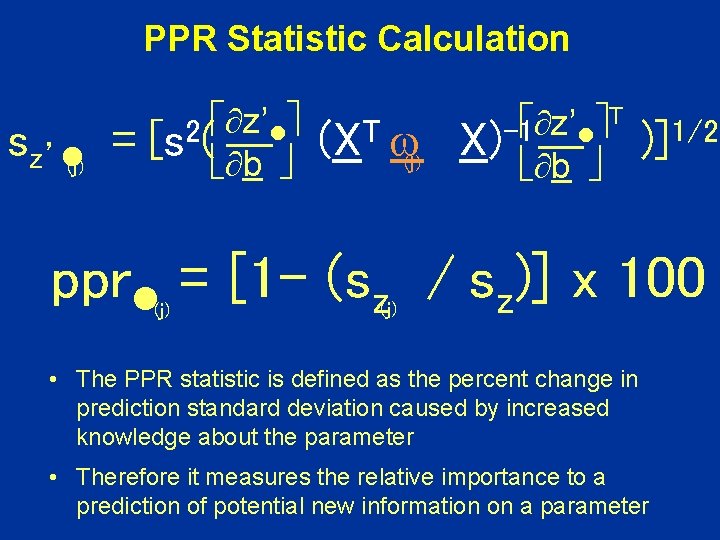
PPR Statistic Calculation sz’ (j) = z’ 2 [s ( b T (X w(j) T z’ -1 X) b 1/2 )] ppr = [1 - (sz / sz)] x 100 (j) • The PPR statistic is defined as the percent change in prediction standard deviation caused by increased knowledge about the parameter • Therefore it measures the relative importance to a prediction of potential new information on a parameter
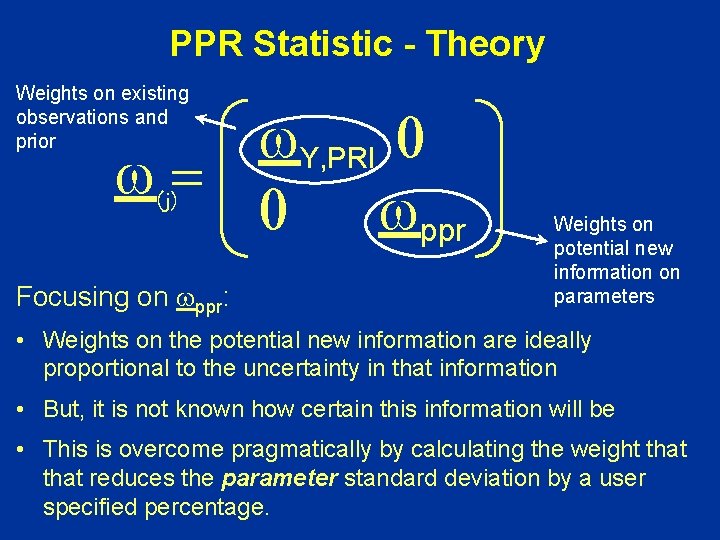
PPR Statistic - Theory Weights on existing observations and prior w. Y, PRI 0 w= 0 wppr (j) Focusing on wppr: Weights on potential new information on parameters • Weights on the potential new information are ideally proportional to the uncertainty in that information • But, it is not known how certain this information will be • This is overcome pragmatically by calculating the weight that reduces the parameter standard deviation by a user specified percentage.
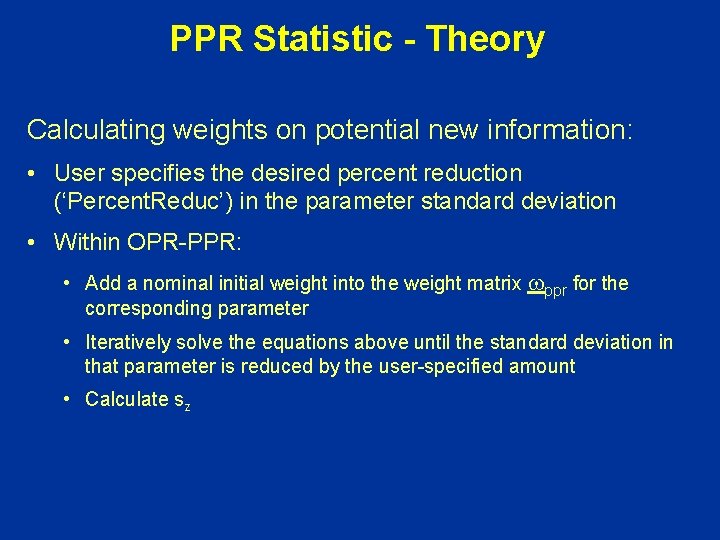
PPR Statistic - Theory Calculating weights on potential new information: • User specifies the desired percent reduction (‘Percent. Reduc’) in the parameter standard deviation • Within OPR-PPR: • Add a nominal initial weight into the weight matrix wppr for the corresponding parameter • Iteratively solve the equations above until the standard deviation in that parameter is reduced by the user-specified amount • Calculate sz
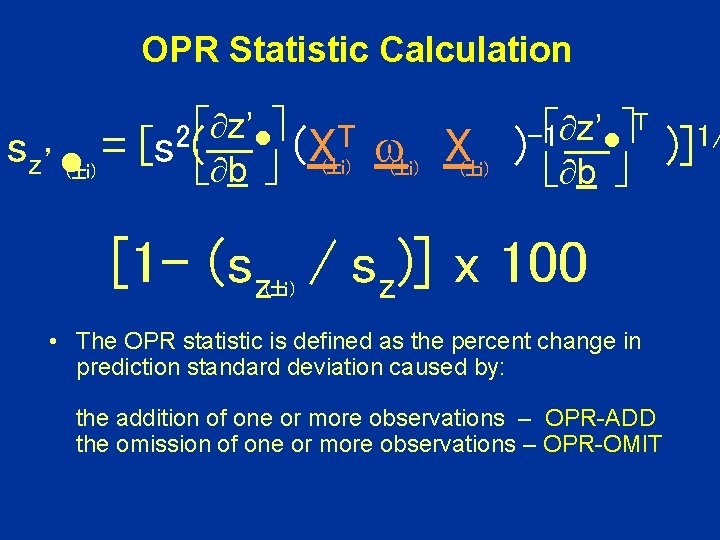
OPR Statistic Calculation sz’ ( i) = z’ T 2 [s ( b (X( i) w( i) X( i) T z’ -1 ) b [1 - (sz / sz)] x 100 ( i) • The OPR statistic is defined as the percent change in prediction standard deviation caused by: the addition of one or more observations – OPR-ADD the omission of one or more observations – OPR-OMIT 1/ )]
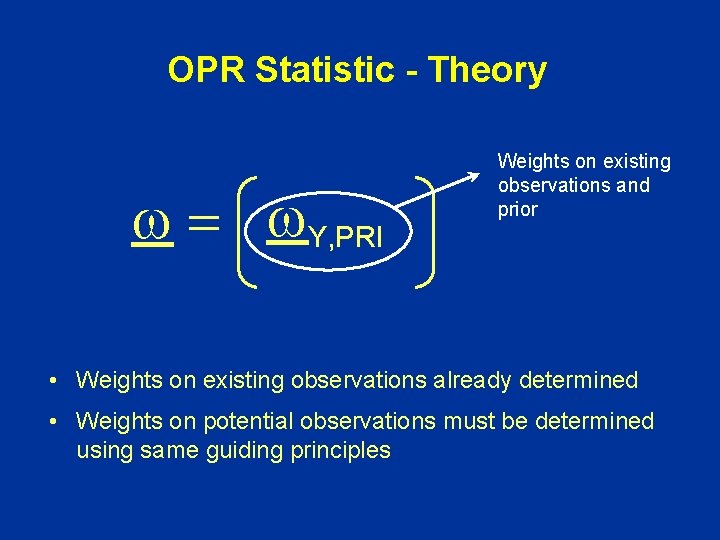
OPR Statistic - Theory w = w. Y, PRI Weights on existing observations and prior • Weights on existing observations already determined • Weights on potential observations must be determined using same guiding principles
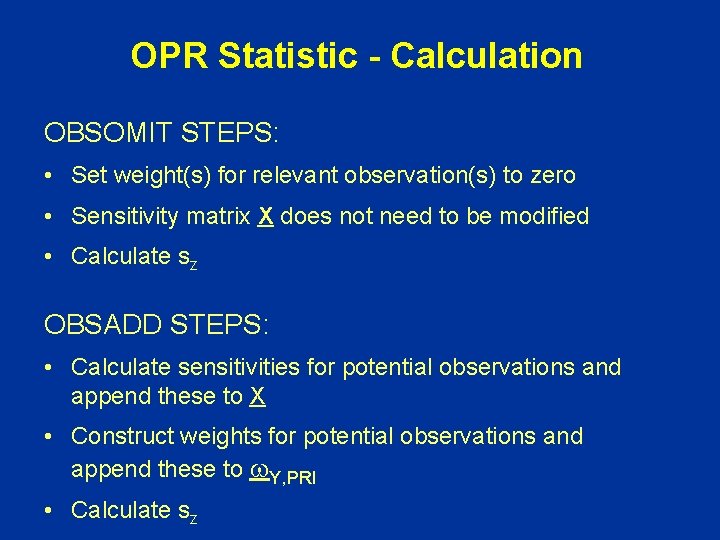
OPR Statistic - Calculation OBSOMIT STEPS: • Set weight(s) for relevant observation(s) to zero • Sensitivity matrix X does not need to be modified • Calculate sz OBSADD STEPS: • Calculate sensitivities for potential observations and append these to X • Construct weights for potential observations and append these to w. Y, PRI • Calculate sz
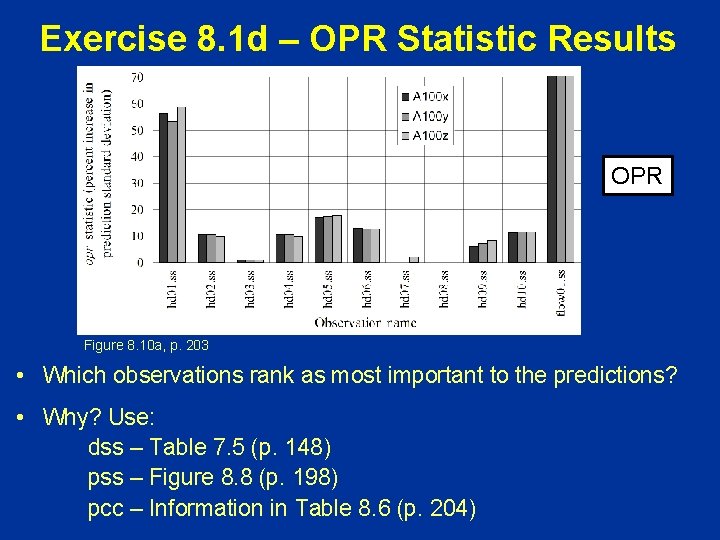
Exercise 8. 1 d: OPR Statistic Use MODE=OPROMIT, OBSGROUPS=NO to analyze the individual omission of the existing head and flow observations and identify which of these observations are most important to the predictions.
Exercise 8. 1 d – OPR Statistic Results OPR Figure 8. 10 a, p. 203 • Which observations rank as most important to the predictions? • Why? Use: dss – Table 7. 5 (p. 148) pss – Figure 8. 8 (p. 198) pcc – Information in Table 8. 6 (p. 204)
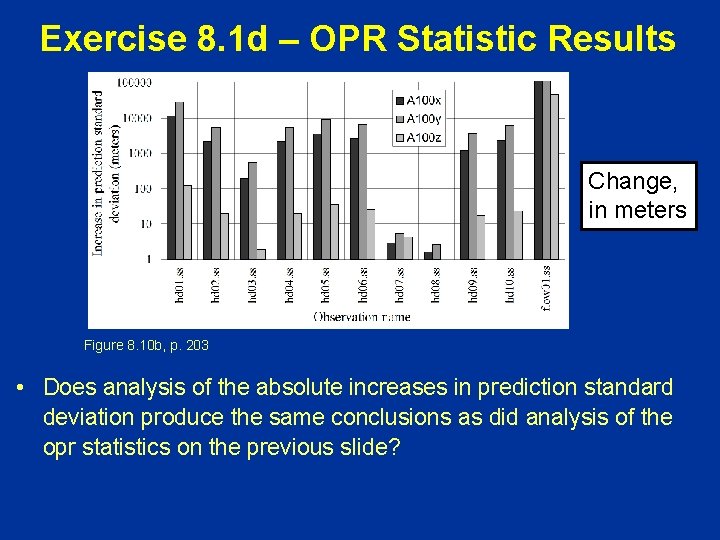
Exercise 8. 1 d – OPR Statistic Results Change, in meters Figure 8. 10 b, p. 203 • Does analysis of the absolute increases in prediction standard deviation produce the same conclusions as did analysis of the opr statistics on the previous slide?