Ice Ages Pleistocene 2 58 0 0117 M


 Cold winters but hot")
: Cycles en. wikipedia. org/wiki/Image: Milankovitch_Variations. png • Milanković added up all the")


- Slides: 34
氷河時代 Ice Ages Pleistocene 更新世 2. 58〜 0. 0117 M. y. 特に この時代をここでは。 Permian 250 -220 M. y. Ordovician 450 M. y. Precambrian 900 -650 M. y. (Snowball Earth) 2300 M. y.
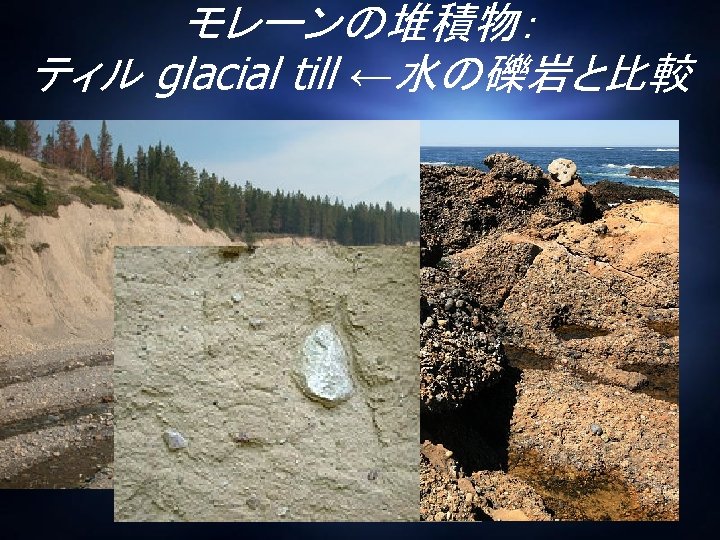
氷河時代の証拠 1: 氷礫岩tillite www. eriding. net/media/photos/geograp/_geo_lpp_007_boulder_clay. jpg www. scottishgeology. com/gallery/image 02. html boulder
続 Gowganda tillite, Ontario Rock record of glaciation, this one ~2. 3 billion years ago!
氷河時代の証拠 1’: 氷河性堆積物の再現 • In the early 1800 s Jean de Charpentier observed the advance and retreat of glaciers in the Alps and studied the kind of deposits they left behind. 1820 s 1850 s Glacial retreat en. wikipedia. org/wiki/Image: Johann_von_Charpentier. jpg
氷河時代の証拠2: 氷河地形 www. swisseduc. ch/glaciers/earth_icy_planet/glaciers 15 -en. html? id=15 Parallel marks show former level of an ice-dammed lake Glen Roy, Scotland • Agassiz amassed more evidence from landforms and boulder clays to support his idea of a Great Ice Age in recent times. www. geo. umn. edu/courses/4703/Spring 00/5 -North. Shore/images/striations. jpg
氷河時代の証拠 2’: 擦痕 • In 1840, Louis Agassiz observed similar glacial features in Scotland. • He found scratches on a rocky hillside near Edinburgh like those made by glaciers. ice scratches en. wikipedia. org/wiki/Image: Louis_Agassiz-2. jpg • He argued that Scotland had recently been covered in a thick ice sheet.
氷河時代の証拠 3: 化石 www. colby. edu/geology/gifs/M. nelsoni. jpg • Fossil discoveries also suggested that climate had recently been much colder. Pollen www. aip. org/history/climate/images/Dryas_octopetala. pollengrain. jpg en. wikipedia. org/wiki/Image: Mammoth_mg_2791. jpg Beetles Mammoth • Beetles and pollen grains found in sediments associated with the boulder clays were identified as types known only from the Arctic tundra today. • Woolly mammoths found deep frozen in Siberia had fur adapted to tundra life.
仮説:ミランコヴィッチサイクル Milankovich Cycles Cool Summers More Important Than Cold Winters 自転軸の傾き Tilt of Axis 公転軌道の離心率 Shape of Orbit 自転軸の歳差運動 Precession
ミルティン・ミランコビッチ Milutin Milanković 1920年,太陽の放 射による熱現象の 数学理論 Théorie mathématique des phénomènes thermiques produits par la radiation solaire
Axis Tilt Small Axis Tilt: Mild winters but cool summers. Favors Ice Age Large Axis Tilt: Cold winters but hot summers. Favors Interglacial
Precession: 26, 000 year cycle
Shape of Orbit + Precession Summer at Perihelion (Eccentric Orbit) Cold winters but hot summers. Favors Interglacial Summer at Aphelion (Eccentric Orbit) Near-circular Orbit Mild winters but cool summers. Favors Ice Age
Cause (4): Cycles en. wikipedia. org/wiki/Image: Milankovitch_Variations. png • Milanković added up all the orbital wobbles and predicted that ice ages should occur in regular cycles - probably happening every hundred thousand years or so.
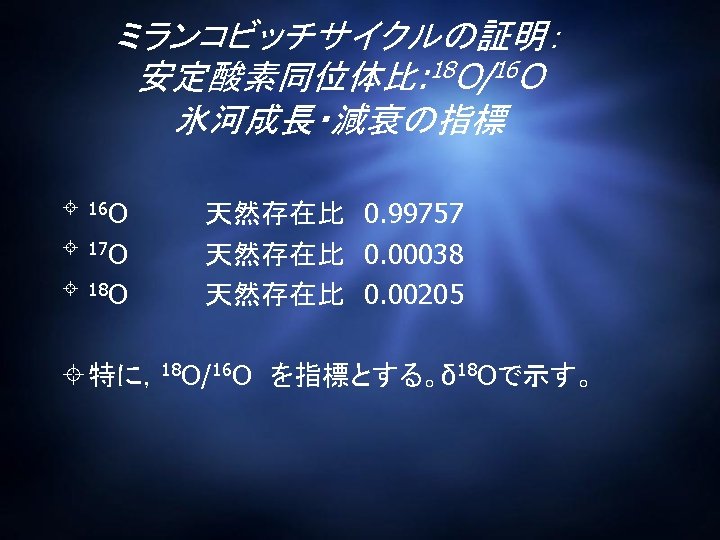
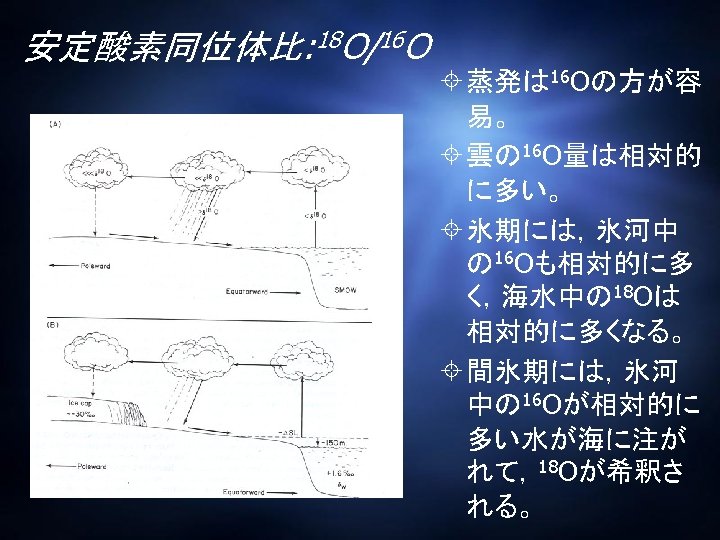
If we collect a shell made out of Ca. CO 3, we can analyze the O 18: O 16 ratio by the following formula: delta O 18= [ (O 18/O 16 sample) / (O 18/O 16 standard) -1 ] x 1000 The standard that your sample is compared to is either one prepared from ocean water or from a fossil standard. Positive delta O 18 values mean that your sample is enriched in the heavy O isotope; negative delta O 18 values mean it’s depleted in the heavy O 18.
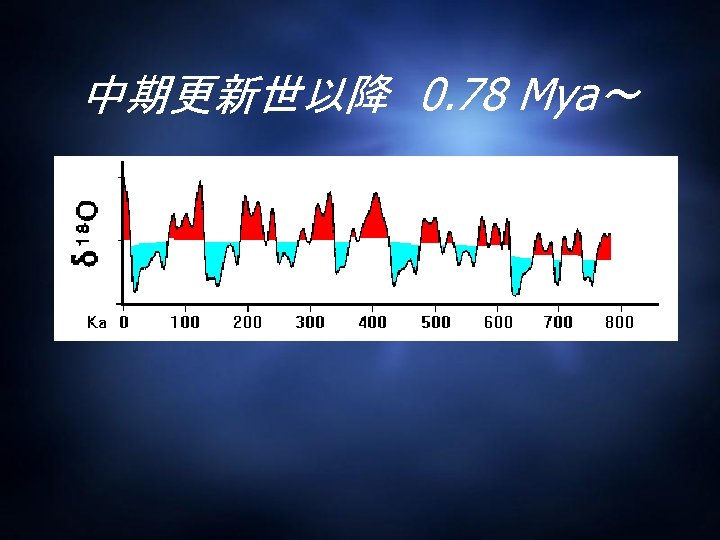
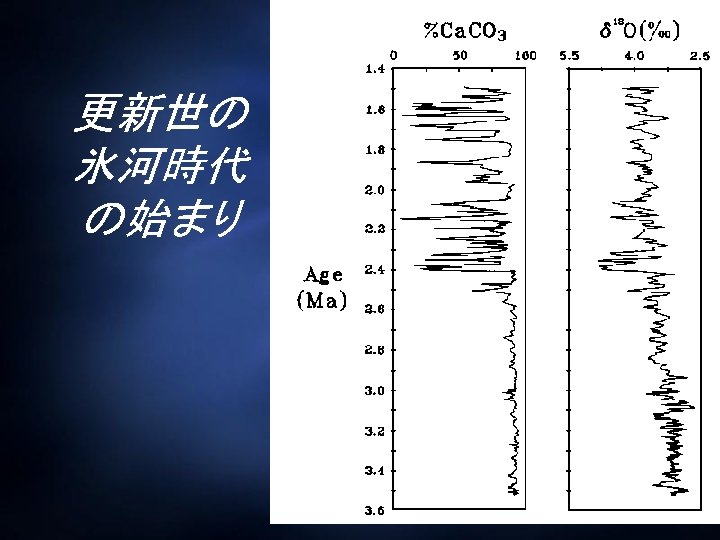
Curve of average O 18 isotope variation over the past 2 my based on analysis of deep sea sediment The curve illustrates changes in global ice volume in successive glacial (blue) and interglacial (green) cycles of the Quaternary Period. Note that this graph does not show fluctuating temperatures, but changes in the dilution of sea water as a result of freshwater influx from melting glacial ice, i. e. , this is a climate proxy
U字谷と氷河 Franz Josef Glacier
ホルン Ost- und Nordwand des Matterhorns, an der Licht /Schattengr enze der Hörnligrat
周氷河地形: 構造土 frost hexagons A blockfield around 4000 m on Mount Kenya 凍結融解作用