HR Diagram L vs T Ages of Stellar
")


 Embedded in the dark Orion Molecular Cloud")

")


 • Very low densities: ~ 1 particle per cm 3 •")

![Nebular Spectra Emission spectrum of Crab nebula [OII] lines in the blue ~3700 Angstroms](https://slidetodoc.com/presentation_image/6a6b8e07625ee5e15c989a592291ad02/image-20.jpg "Nebular Spectra Emission spectrum of Crab nebula [OII] lines in the blue ~3700 Angstroms")


")
 objects")
")
 follow magnetic")


- Slides: 35
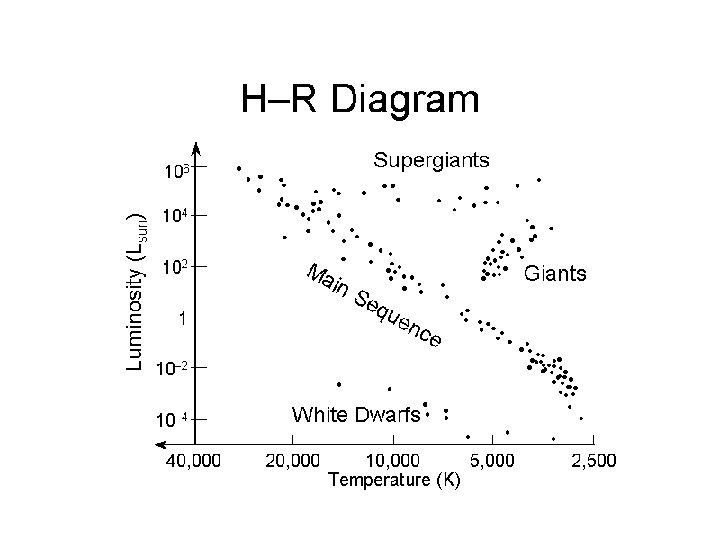
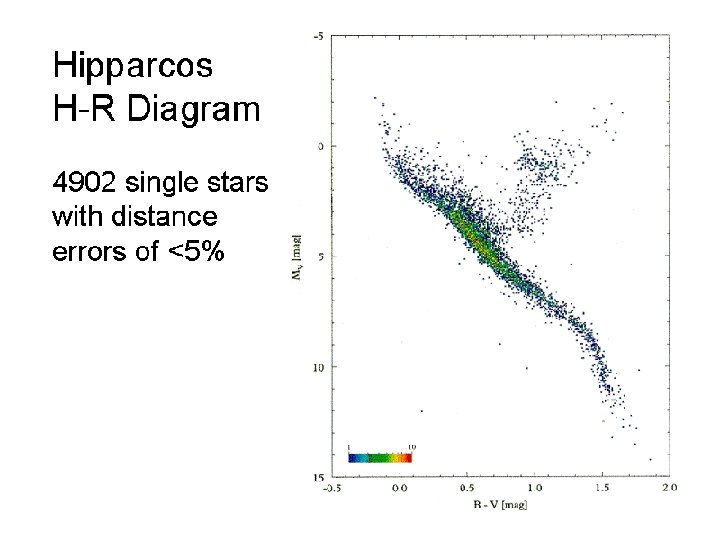
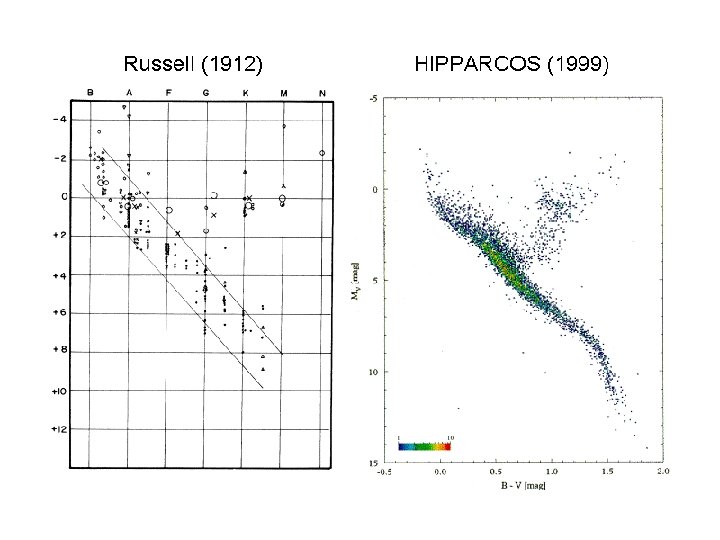
H-R Diagram (L vs. T)
Ages of Stellar Clusters Stars in a cluster are born at the same time but with different stellar masses, spectral types and luminosity, and then age differently
The Pleiades Star Cluster
H-R diagram of Pleiades Same age, different masses and color-temperatures
Stellar Luminosity and Mass
Stellar Evolution and Lifetime • Luminosity depends on the rate at which star generates and emits energy • Mass provides fuel for burning ! • From the luminosity-mass relation L ~ M 4 • Lifetime ~ M(star) / Luminosity ~ 1/M 3 • Lifetime decreases rapidly with mass • The most massive stars live only tens of millions of years • O and B stars are ~10 times M(Sun)
Interstellar Medium and Nebulae • How do stars form? • Cold and dark gas clouds coalesce gravitationally • Temperatures and densities rise to those needed for nuclear fusion • Stars are born and ionize nearby regions • Nebulae are regions ionized (electron and ions) by stars, with surrounding neutral gas and dust and grains (heavy elements)
Nebulae are Stellar Nurseries Dark Molecular Cloud Gravitational Contraction Birth of Stars Bright Nebula
Orion Nebula – Stellar Formation
Young Stars in Orion Nebula (The Trapezium) Embedded in the dark Orion Molecular Cloud Hot stars emit UV radiation Ionize HI HII and other Elements (e. g. OI OII, OIII) Ions emit bright emission lines Emission nebula
Stars in Orion Nebula
Star Forming Regions – HST (Time magazine cover photo)
Supernova shock waves and star formation
Interstellar Reddening: Dust scatters blue light so object appear redder Why does the Sunset appears red ?
Interstellar Medium (ISM) • Very low densities: ~ 1 particle per cm 3 • But vast distances so light (spectral lines) traveling through ISM needs to be corrected for reddening • Recall the distance to the nearest star Alpha Centauri ~ 4. 3 pc or ~ 15 Lys • A column of 1 sq cm would contain > 1018 particles up to the Earth
Emission Nebulae • Ionized H+ or HII regions with bright emission lines • Te ~ 10, 000 K, Ne ~ 1000 electrons/cc • Atomic Ions: O+ (OII), O++ (OIII), S+ (SII), etc. • Spectral Line intensities yield physical conditions: temperature, density, etc. • Orion nebula: brightest HII region with young, hot stars • Crab nebula created after a supernova
Nebular Spectra Emission spectrum of Crab nebula [OII] lines in the blue ~3700 Angstroms [SII] lines in the red ~6700 A [OIII] line in the middle ~5000 A [. . ] means “forbidden” lines from transitions between closely spaced low-lying levels with low quantum mechanical probability (Pradhan and Nahar , 2011)
Birth of Stars • • Collapsing molecular clouds Fragmentation into varying masses Protostars Protostellar disk Forms star and planets When H-burning initiates, star is born Reaches Main Sequence (Zero-Age-Main. Sequence or ZAMS)
Mass and Stellar Type at Birth Pre-Main Sequence Evolution O, B Super. Giants Red Dwarfs Stellar formation begins on the so-called Hayashi Track where pre-stellar masses begin to contract and eventually light up due to H-fusion and reach the MS
H-R Diagram of Pre-MS Stellar Cluster Many stars have not yet arrived on the MS
Young Pre-MS Stellar Cluster (varying masses, many not yet on the MS)
Proto-star Rotating proto-star disks called Herbig-Haro (HH) objects
Proto-star, disk, and jet (proto-planetary disks form planets)
Magnetic field lines and activity in protostars Charged particles (electrons, protons, ions) follow magnetic field lines as the plasma condenses into a star
Stellar Structure and Interiors • • Recall the 3 different zones in the Sun Core, Radiative Zone, Convection Zone Energy is transported across the interior Stellar structure depends on rate of temperature variation along stellar radius, which determines whether radiative diffusion or convection is to be the primary mode of radiation transport
Structure of the Sun: Three Zones Core, Radiative, Convective
Massive Stars
Solar-Type Stars
Low-Mass Stars
Star Formation in Galaxies
Spiral Galaxy and Arms
Stellar Formation in Spiral Arms