FOOD STORAGE AT LOW TEMPERATURES INFLUENCE OF STORAGE


 Temperature control by")


 STORAGE 1) Respiration Fruits and vegetables continue their metabolic activity after")


 and b")
 Controlled Atmosphere (CA) Gas Composition CA storage has been used successfully with apples")


 and Packaging (MAP) Modified atmosphere (MA) and CA are similar")


 Time temperature integrator or indicator can be defined")


- Slides: 39
FOOD STORAGE AT LOW TEMPERATURES
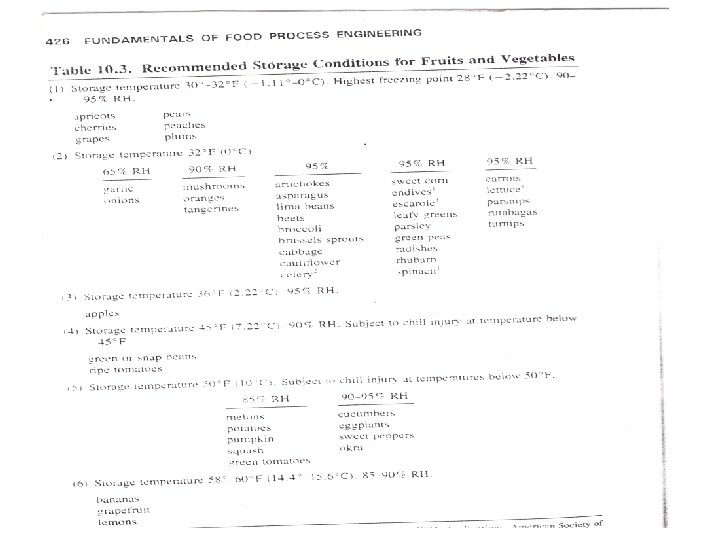
INFLUENCE OF STORAGE CONDITIONS ON THE PRODUCT Food being stored may become spoiled by three mechanisms: 1) Living organisms (e. g. , insects, fungi, bacteria, etc. ) may feed on the food and contaminate it, 2) Biochemical activity within the food itself (e. g. , respiration, staling, browning and rancidity development) may in time diminish its quality and usefulness, 3) Physical processes (e. g. , bursting and spillage of the contents of packages or recrystallization phenomena in sugar confectionary, fats and frozen products) may have the same effect. The three main factors of the storage environment which influence the storage life of a particular commodity are; 1) Temperature 2) Humidity 3) Composition of the storage atmosphere. In addition, rough handling, careless packing or unsuitable packaging can reduce storage life. The following table shows the temperature and humidity recommended for storage of various fruits and vegetables:
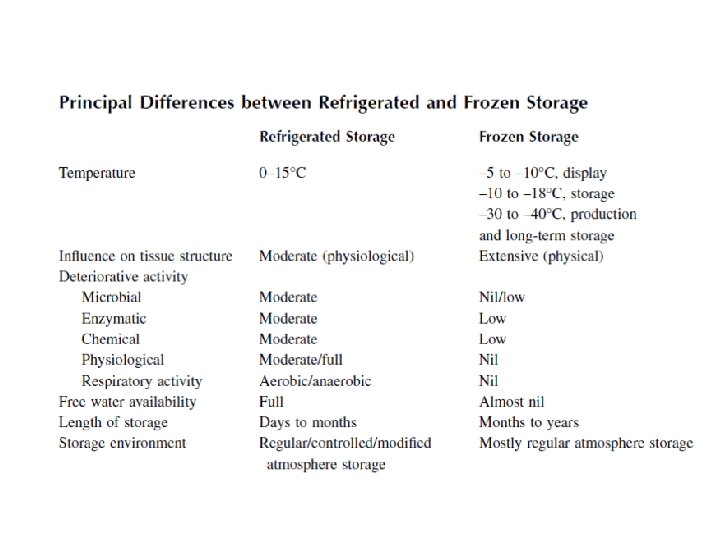
Low-Temperature Preservation Most food products benefit from a reduction in the storage temperature provided that no freezing occurs. Reduced temperature reduces the rate of chemical reactions that cause the product to deteriorate and reduce microbiological activity. Freezing damages the cellular structure of fruits and vegetables and severely reduces their acceptability. Low-temperature preservation, which implies shelf-life extension through lowering of temperature, generally encompasses two distinct techniques for the storage of foods: refrigerated storage and frozen storage. The refrigerated storage generally encompasses a temperature range of – 2 to about 15°C, whereas frozen storage operates at temperatures of – 10°C or less. Refrigerated storage does not induce significant structural changes in the stored commodities, whereas in frozen storage, the moisture in the food undergoes a phase transformation resulting in tissue breakdown and softening. Refrigerated storage does not stop the activity of microorganisms, whereas frozen storage suppresses their activity.
PLANT FOODS Plant foods are alive and continue to respire even after harvest. And they must be kept alive and allowed to respire in order to maintain their defense system against the various causes of spoilage. However, in order to prolong their shelf life, the respiratory activity must be kept to a minimum, Respiration The primary physiological activity in the fruit and vegetable tissues is “respiration”, which is a complex process of oxidation of organic matter (starch, sugars, acids, fats, proteins, etc. ) to simpler molecules such as CO 2 and H 2 O, with the concurrent production of energy and other intermediate products.
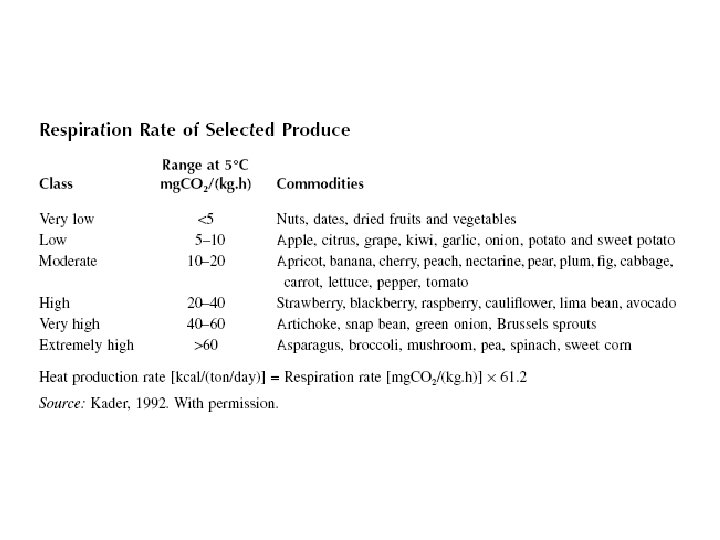
Respiration is the most important physiological activity and has a direct bearing on quality. The deterioration of produce quality increases rapidly with the respiration rate. Several factors influence produce respiration-temperature, commodity, variety, maturity, climacteric behavior, availability of oxygen, presence of carbon dioxide, ethylene, growth regulators, and others (stresses, injuries, etc. ). It is generally accepted that, as with chemical reactions, with every 10°C raise in temperature the rate of respiration is approximately doubled. This respiratory activity also produces heat, called the heat of respiration or vital heat. The refrigeration requirement must take into account this heat of respiration, because this can contribute a significant heat load. Table shows a classification of fruits and vegetables based on their respiration rate
Measures that can be taken to minimize respiratory losses include 1) Temperature control by a) harvesting at cool times; b) cooling down and transferring produce to cold store as fast as possible; c) maintaining lowest permissible temperature d) maintaining the cold storage properly (good air circulation and refrigeration); 2) harvesting vegetables at a stage appropriate for intended use and harvesting fruits at a mature but sufficiently preclimacteric stage; 3) reducing the availability of oxygen using controlled atmosphere (CA) storage (lowered oxygen level) or by applying appropriate wax coating; 4) increasing the CO 2 in the environment, again by the use of CA storage; 5) eliminating ethylene from the system and handling the produce with care to minimize mechanical injuries.
Transpiration means loss of water from the produce due to evaporation. Any moist material would lose moisture when exposed to air that is not saturated. This moisture loss from the produce occurs through evaporation and vapor diffusion processes. Transpiration is the second most important factor with respect to quality loss during storage and transportation. Transpiration is an effective way of keeping the plant tissue cool.
Transpiration can be reduced by 1. Maintaining a high relative humidity in the storage chamber. 2. Maintaining a low temperature difference between the cooling coils and produce. This will reduce the chances of the cold air being cooled below its dew point. 3. Protecting the produce from mechanical and physical injuries. 4. Controlling the permeability of the produce tissue. Primarily, this is achieved by waxing (apples, citrus fruits, cucumbers, bell peppers, bananas, etc. ). 5. Packaging them in polymeric films. Perforations must be provided to allow gas escape, otherwise CO 2 gas will build up inside. Permeability of film to oxygen is important to keep the required minimum oxygen levels inside the package.
ANIMAL TISSUE Following the slaughter, the blood circulation ceases, and oxygen availability diminishes. Respiration takes on the anaerobic form. So, instead of aerobic oxidation of glucose to CO 2 , H 2 O, and energy in the presence of O 2, anaerobic glycolysis sets in, resulting in the formation of lactic acid. Formation of this acid causes the p. H of the muscle to drop from its physiological level of 7. 0. Within a few hours after the animal is killed, rigor mortis sets in with a contraction of muscle fibers, causing stiffening of the muscle tissue, increasing its toughness, and reducing its water-holding capacity. Rigor mortis refers to the rigidity of the body that occurs after death. The state of rigor usually lasts about 24 h or until muscle decomposition takes place by acid formation
REFRIGERATED STORAGE A cold storage is generally referred to as a storage system because of the need to control several components, such as temperature, RH, air velocity, air composition, etc. Temperature control is a key factor in post-harvest storage. Produce must be stored at the lowest permissible temperature. Some tropical produce could be chilling sensitive, and should not be stored at temperatures below which they are sensitive to cold injury. The optimum storage temperature for most temperate produce is 30 to 32°F (-1 to 0°C) for the nonchilling sensitive varieties and 38 to 40°F 8 (3 to 4°C) for the chillingsensitive varieties. For tropical produce, the desirable temperature ranges are 45 to 50°F (7 to 10°C) for nonchilling-sensitive) and 50 to 60°F (10 to 15°C) (chillingsensitive). Good air velocity is necessary for proper temperature distribution. Generally, air flow rates of 50 to 75 ( ft 3/m) is desirable. Higher flow rates will cause desiccation, especially when a large temperature difference exists between coil and produce. Lower flow rates will lead to temperature stratification and improper cooling of the produce.
Relative Humidity Relative humidity controls produce transpiration. Dry air picks up moisture from the produce and carries it to the cooling system as the refrigeration cycle repeats. Moisture loss can be reduced by narrowing the temperature difference between the coil and the air. Moisture loss can be reduced by narrowing the temperature fluctuation. Moisture loss can also be reduced by humidifying the air externally using a special techniques for storage such as the Filacell storage system (Cooling is achieved by forcing saturated cold air through stacks of palletised products), or Fog -spray system
Atmospheric Concentration/Composition In regular atmosphere systems, the atmospheric composition is not controlled. Excessive CO 2 and ethylene accumulation is prevented by scrubbing. In CA (controlled atmosphere)/MA (modified atmosphere) storage systems, the atmosphere is altered. Low oxygen levels and high CO 2 levels are intentionally created to reduce the rate of respiration and heat production. Removal of ethylene (C 2 H 4) is a must in these systems because presence of ethylene, even in trace quantities, can trigger accelerated ripening of some fruits. Ethylene is a natural plant hormone released in the form of a gas. It triggers cells to degrade, fruit to turn softer and sweeter, leaves to droop, and seeds or buds to sprout Sometimes, carbon monoxide (CO) is added as a CA supplement; it has been shown to inhibit discoloration of cut surfaces.
CONTROLLED ATMOSPHERE (CA) STORAGE 1) Respiration Fruits and vegetables continue their metabolic activity after harvest. Maintenance of this metabolic activity is essential in the preservation of quality. Metabolic activity is manifested by respiration, a process whereby the material consumes oxygen and emits carbondioxide. A major nutrient metabolized during respiration is carbohydrate. Since respiration depletes nutrients in a product after harvesting, the key to prolonging the shelf life of fruits and vegetables is reducing the rate of respiration. Studies on the relationship between respiration and quality established that storage life is inversely related to the rate of respiration and that for two products respiring at different rates, when the total quantity of CO 2 emtted by both product is equal, the products would have reached a comparable stage in their storage life.
Reduction of temperature is an effective means of of reducing the rate of respiration. However, for some products subjec to chill injury, the respiration rate may still be quite high even at the lowest safe storage temperature. Controlled atmosphere storage has been developed as a suplement to refrigeration in prolonging the storage life of actively respiring fruits and vegetables. The reaction involved in respiration is primarly the oxidation of carbohydrates. C 6 H 12 O 6 + 6 O 2 6 CO 2 + 6 H 2 O + ENERGY The respiratory quotient (RQ), defined as the ratio of CO 2 produced to O 2 consumed, is 1 for the reaction. Most products show respiratory quotients close to 1. The heat evolved during respiration has also been shown to be related to the quantity of CO 2 produced in the same manner as that released during the consumption of glucose (10. 7 J/mg CO 2). The rate of oxygen consumption and CO 2 evolution can be calculated from the heat of respiration and vice versa.
Controlled atmosphere storage is based on the premise that increasing the CO 2 level and decreasing the O 2 level in the storage atmosphere will result in a reduction of the rate of respiration. Heat of respiration of products in continuously flowing controlled atmosphere of the optimum composition for the given product has shown that controlled atmosphere can reduce the respiration rate to approximately one-third of the respiration rate in air at the same tepmerature. The heat of respiration of a produce can be calculated from the following equation at constant storage temperature: q : heat of respiration (m. W/kg) and b (1/ºC) are the constants. These constant are different for various food materials. T : storage temperature (ºC)
Heat Generation When Temperature of Storage is Changing Linearly a (m. W/kg) and b (1/°C) are constants, T 1 and T 2 are storage temperatures, t is the storage time, q is the heat generation (m. W/kg).
2) Controlled Atmosphere (CA) Gas Composition CA storage has been used successfully with apples and pears. Experimental results with CA storage of cabbage, head lettuce, broccoli and brussels sprouts have been very encouraging. Atmospheric modification of products containers during transit of vegetables is also gaining wider acceptance. CA is recommended when the transit time is 5 days or more. Reduction in the O 2 concentration in the storage atmosphere to 3 % or below has been shown to be most effective in reducing the respiration rate, with or without CO 2. Too low an O 2 concentration, however, leads to anaerobic respiration, resulting in the development of off-flavors, unwanted tastes and odours in the product and will cause the food to deteriorate. The O 2 concentration for the onset of anaerobic respiration ranges from 0. 8 % for spinach to 2. 3 % for asparagus.
The optimum CA composition varies from one product to another and among the varieties of a given product. CA compositions found to be effective for some products are shown in the following Table:
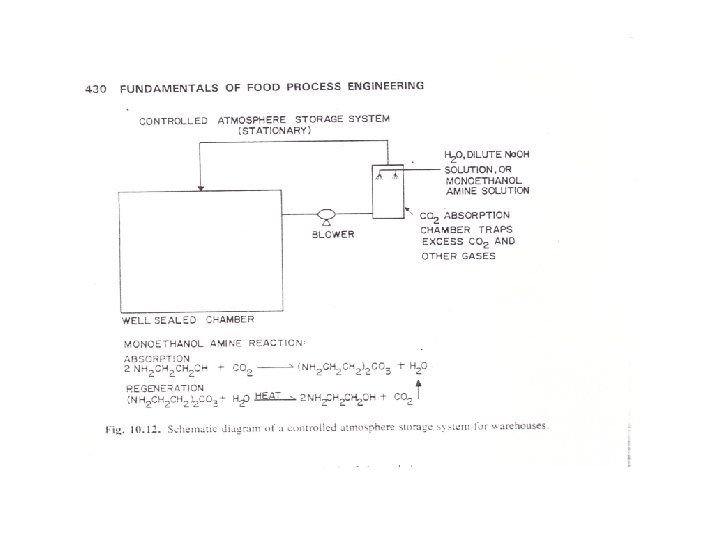
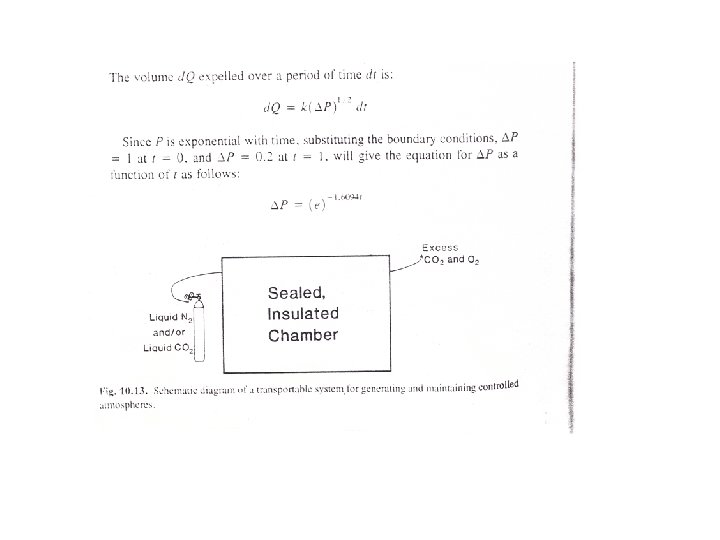
CA in storage warehouses is maintained at the proper composition by introduction of CO 2 and/or N 2 if product respiration is insufficient to raise CO 2 levels or lower O 2 levels. In a full, tightly sealed warehouse, ventillation with fresh air and scrubbing of CO 2 from the storage atmosphere may be necessary to maintain the correct CA composition and prevent anaerobic respiration. Successful operation of a CA storage facility necessitates regular monitoring and analysis of gas composition and making appropriate corrections when necessary. Figures 10. 12 and 10. 13 are schematic diagrams of CA storage systems for warehouses and for in-transit systems.
Modified Atmosphere Storage (MAS) and Packaging (MAP) Modified atmosphere (MA) and CA are similar and the terms are sometimes used interchangeably. A feature of CA is some type of control which maintains constant conditions within the storage atmosphere. MAP involves changing the gaseous atmosphere surrounding the product at the time of packaging and using barrier packaging materials to prevent gaseous exchange with the environment surrounding the package. Modified-atmosphere storage (MAS) and packaging (MAP) are the use of gases to replace air around non-respiring foods without further controls after storage or packing. In controlled-atmosphere storage (CAS) and packaging (CAP), the composition of gas around respiring foods is monitored and constantly controlled.
MA packaging is primarily designed to control the growth of microorganisms and in some cases enzyme activity in packaged uncooked or cooked foods. The atmosphere used, if the product itself is non-respiring, is usually 75 %CO 2, 15 % N 2 and 10 % O 2. Bakery products, which are generally of lower moisture content than most foods, can be preserved longer in 100 % CO 2. Dissolution of CO 2 and O 2 in the aqueous phase of the product is responsible for microbial inhibition. High CO 2 is inhibitory to most microorganisms. Although CO 2 lowers the p. H, the inhibitory affect results from more than the p. H reduction alone. The presence of O 2 has a slight inhibitory effect on aneerobes, resulting in slower growth compared to a 100 % CO 2 atmosphere.
Other gas combinations and the products on which they have been used are: 80 % CO 2 and 20 % N 2 meats, 100 % N 2 for cheese, 30 % CO 2 and 70 % N 2 for fresh poultry and fish, 30 % O 2, 30 % CO 2 and 40 % N 2 for red meats. Typically, MA packaging involves drawing a vacuum from the product in a highbarrier packaging material, displacing the vacuum with the modified atmosphere, and sealing the package.
SHELF-LIFE DETERMINATION Most food engineers and technologists like to model shelf-life based on the kinetics of deterioration. As most of the foregoing mechanisms follow either zero-order or first-order kinetics, the mathematical task of shelf-life modeling should be a simple exercise. However, given the multiplicity of deterioration mechanisms present, it is not surprising that kinetic data limitations make the exercise not only difficult but also in many cases impossible. Even when reaction rate constants are available, they have frequently been determined at temperatures well removed from those of frozen food storage conditions. Additionally, many foods may undergo more than one deterioration reaction and the combined effects of these would need to be assessed. So, many laboratory-based procedures have been introduced in an attempt to rectify the situation.
Open-Dating Techniques There are many possibilities in converting codes to open dates. The date could be a pack date, sell-by date, best-if-used-by date, or a combination of these. 1. “A pack date” is the day, month, and year the food product was processed or packaged for retail sale. It is of minimal value to consumers in that it provides little information as to freshness or how long products should remain at acceptable quality. A pack date is, however, the easiest and least expensive for industry to implement. 2. “A sell-by date” is the last date a food product should be sold in order to allow a “reasonable” length of time for consumer use. This date is appropriate for perishable foods such as milk and dairy products because they have a short shelf life. It is the most useful date for wholesalers and retailers in their inventory control, since it states the last day of sale. However, it does not indicate to the consumer when foods should be used. Because it is currently being used on many perishable foods, it could easily be implemented by industry for products with a short shelf life.
3. “Best-if-used-by date” is the date after which food is no longer at its most acceptable level of quality. It is the preferred single date by consumers and provides the most useful information on quality. It is more appropriate for foods that have a long shelf life. It is, however, the most difficult for wholesalers and retailers to use in inventory management because they must subjectively determine allowances for home storage in order to determine the last day of sale. This date is presently used on some semiperishable and long shelf-life foods. However, the full implementation of this kind of date may require as much as a 2 - year period to scientifically establish it for a given product at a cost of $200, 000 per product 4. “Combination dates” are preferred by consumers to single dates. They provide the most information, especially a sell-by and best-if-used-by combination. Combination dates, however, have all of the disadvantages of single dates.
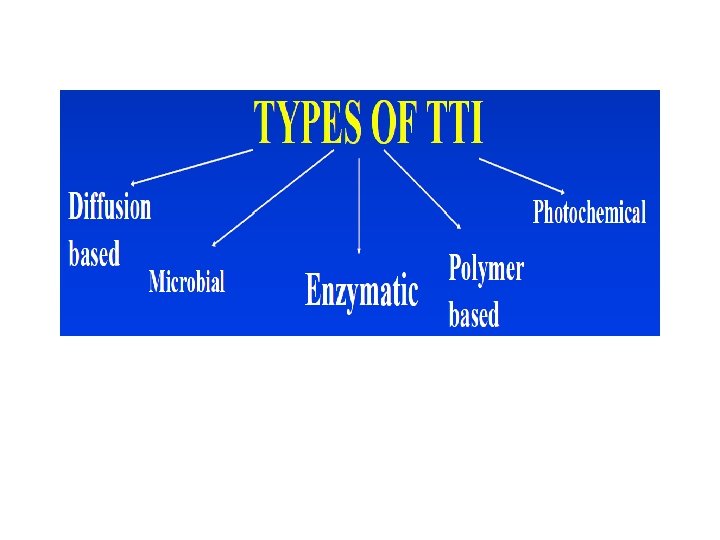
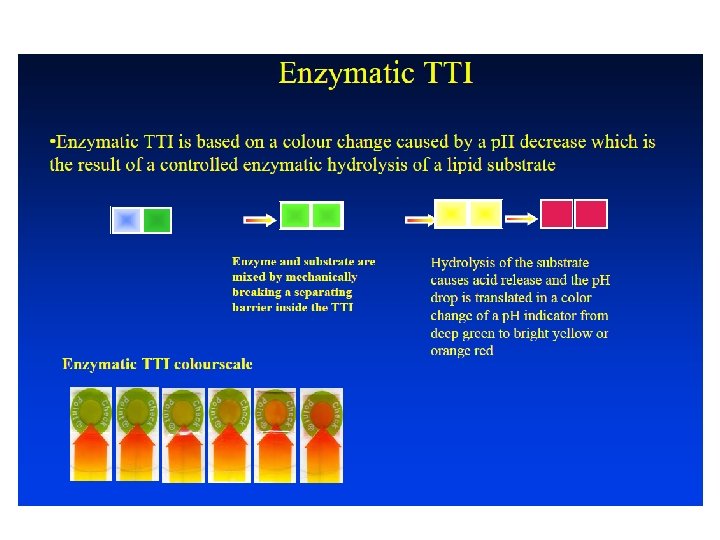
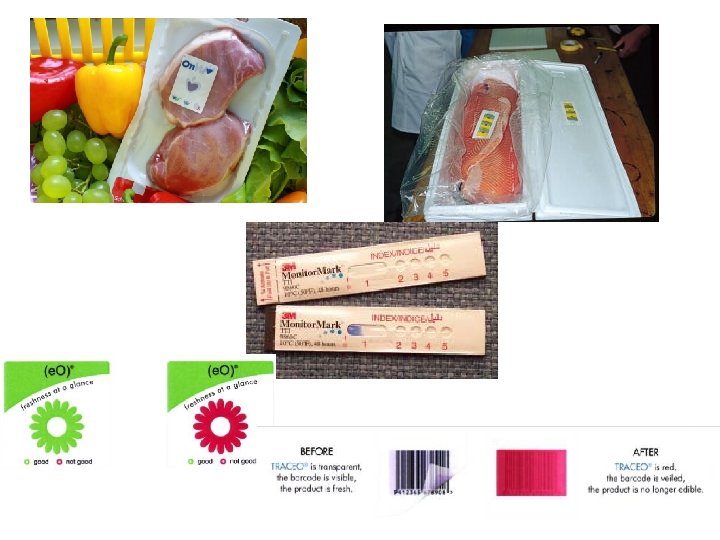
Time Temperature Integrator or Indicator (TTI) Time temperature integrator or indicator can be defined as a simple, inexpensive device that can show an easily measurable, time-temperature dependent change that reflects the full or partial temperature history of a food product to which it is attached. Time-temperature indicators, which are attached to food packages, allow one to determine if a food has been exposed to unsafe temperatures. Time temperature indicators usually have a clear bar that changes color as food is exposed to an unsafe temperature. Even if the food is returned to a safe temperature, the bar will still be colored in, showing that the food was temperature-abused. The principle of TTI operation is a mechanical, chemical, electrochemical, enzymatic or microbiological irreversible change usually expressed as a visible response, in the form of a mechanical deformation, colour development or colour movement. The rate of change is temperature dependent, increasing at higher temperatures. The visible response thus gives a cumulative indication of the storage conditions that the TTI has been exposed to.
Q 10 CONCEPT Within the physiological temperature range, the velocity of a biological reaction increases two- to three fold for every 10°C rise in temperature. The ratio of reaction rates at two dissimilar temperatures is called the temperature coefficient or Q 10 if the interval between the two temperatures is 10°C. To allow easy comparisons among Q 10 values obtained from measurements made over temperature intervals of not exactly 10°C, the Q 10 can be calculated by applying the following equation: Where, R 2 = rate of respiration at T 2 R 1 = rate of respiration at T 1 T 2 and T 1 = temperatures in °C If the difference between T 2 and T 1 is 10°C, then the Q 10 will be the quotient of the two rates.
The Q 10 concept allows calculation of expected respiration rates at a given temperature from a known rate at another temperature. Usually, Q 10 values range from 1 to 5, although higher values may occur. For most biological reactions, the Q 10 is between 2 and 3 for temperatures between 10 and 30°C. That means that the reaction rate will double or triple with every 10°C rise in temperature. While normally constant over a limited temperature range, the Q 10 of complex phenomena can change greatly over wide temperature fluctuations. These dramatic changes could be caused by different reactions dominating the overall reaction at different temperatures. The shift from one limiting reaction to another could therefore cause a rapid shift in reaction rates and Q 10 values. Typically, Q 10 values are highest between 0 and 10°C, are commonly around 2 to 3 between 10 and 30°C, and continually decline to around 1 at higher temperatures. A Q 10 of 1 indicates that the reaction rate is not changing with changes in temperature, while a Q 10 below 1 means that the rate is actually decreasing with increasing temperature.
While Q 10 values differ widely among vegetables over a given temperature range, a high rate of respiration does not necessarily mean that the Q 10 will be high. For example, respiration of asparagus has a Q 10 of 2 between 20 and 25°C when respiration is at 387 and 550 mg CO 2/(kg. h), respectively, while onions have a Q 10 of 3 between 15 and 20°C when respiration is at 11 and 19 mg CO 2/(kg. h), respectively. Calculation of the Q 10 The easiest example to calculate is for reactions at 10°C intervals. For example, if cauliflower produces around 36 mg CO 2/(kg. h) at 10°C and 86 mg CO 2/(kg. h) at 20°C, the Q 10 is simply calculated by dividing the respiration rate at 20°C by the rate at 10°C, giving a Q 10 of 2. 4. A more complicated example is when the temperature interval is not exactly 10°C. For example, cauliflower produces around 54 mg CO 2/(kg. h) (R 1) at 15°C (T 1) and 86 mg CO 2/(kg. h) (R 2) at 20°C (T 2). Since the temperature interval is less than 10°C, the following equation must be used:
The equation can also be used to calculate respiration rates at different temperatures from a known Q 10 and a respiration rate. Example: What would the calculated respiration rate be for cauliflower at 0°C? Assume that the previously calculated Q 10 value applies over this wide temperature range. The new values are R 2=54, T 2= 15°C, R 1=? , T 1=0°C. Substituting these new values into the same equation results in the following:
High Quality Life of Stored Products Storage at below ambient temperature is more expensive than unrefrigerated storage and the lower the storage temperature the higher the cost. The “high quality life (H)” of frozen food products may be defined as the maximum time a product may be stored at a given temperature after freezing before a change in quality is detectable. It has been found that for many frozen food products the logarithm of the high quality life is a linear function of temperature. If H is the high quality life at the temperature experienced by the commodity at time t during the storage process, is the fraction of high quality life expended (spent) during the period over which the integration is affected. Clearly, values greater than unity will indicate that the commodity has detectably lost quality during storage.