Exponentials logarithms and rescaling of data Math 151

 = ax, exponential function with base a • f(x) = logax,")


 = ax, a > 0 a>1 exponential increase As x becomes very")

 = ax is one-to-one. For every x value there is a")
 = ax f(x) = logax")

 = logax + logay loga(x/y) = logax")


 = ��x or y")


")

=bx • Allometric relationships (also called power laws) • Describes many relationships between")

 = bax f(x) = bxa")


")
=ln(bxa) ln(y) = ln(b) + ln(xa) ln(y) = ln(b)")
- Slides: 27
Exponentials, logarithms and rescaling of data Math 151 Based upon previous notes by Scott Duke. Sylvester as an adjunct to the Lecture notes posted on the course web page
Definitions • f(x) = ax, exponential function with base a • f(x) = logax, logarithm of x base a • f(x) = axb, is an allometric function
Motivation • Many biological phenomena are non-linear: Population growth Relationship between different parts/aspects of an organism (allometric relationships) The number of species found in a given area (species-area relationships) Radioactive decay and carbon dating Many others • Exponentials, logs and allometric functions are useful in understanding these phenomena
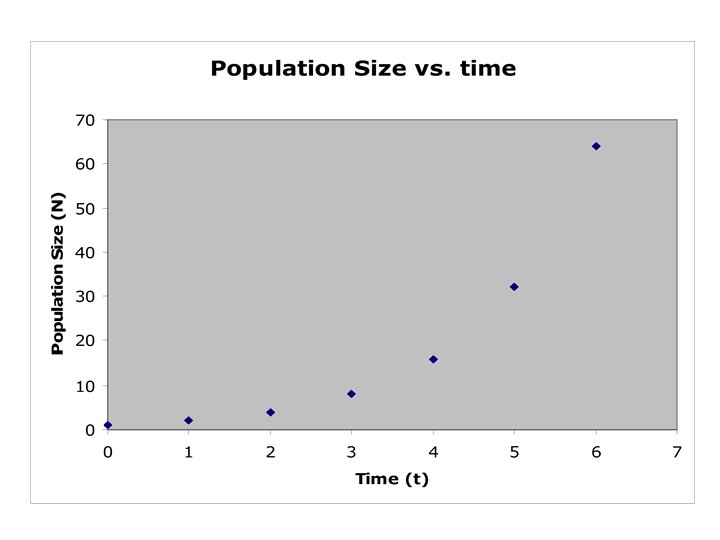
• Population growth is a classic example Algae : cell division Geometric growth 32 2 4 t=0 1 2 1 8 16 3 4 64 … 5 6
Exponentials f(x) = ax, a > 0 a>1 exponential increase As x becomes very negative, f(x) gets close to zero 0<a<1 exponential decrease As x becomes very positive, f(x) gets close to zero
• Special case, a = 1
• f(x) = ax is one-to-one. For every x value there is a unique value of f(x). • This implies that f(x) = ax has an inverse. • f-1(x) = logax, logarithm base a of x.
f(x) = ax f(x) = logax
• logax is the power to which a must be raised to get x. • y = logax is equivalent to ay = x • f(f-1(x)) = alogax = x, for x > 0 • f-1(f(x)) = logaax = x, for all x. • There are two common forms of the log fn. a = 10, log 10 x, commonly written a simply log x a = e = 2. 71828…, logex = ln x, natural log. • logax does not exist for x ≤ 0.
Laws of logarithms • • • loga(xy) = logax + logay loga(x/y) = logax - logay logaxk = k·logax logaa = 1 loga 1 = 0 Example 15. 7 :
• Example 15. 8 : Radioactive decay A radioactive material decays according to the law N(t)=5 e-0. 4 t When does N = 1? For what value of t does N = 1?
To compute logax if your calculator doesn’t have loga or use Example:
• general formula for a simple exponential function: f(x) = ��x or y = ��x Then ln(y) = ln ��x ln(y) = ln �+ ln (�x ) ln(y) = ln �+ x ln � Let b = ln �, and m = ln �, Y=ln (y) then this shows Y = b + mx which is the equation of a straight line. This is an example of transforming (some) non-linear data so that the transformed data has a linear relationship. An exponential function gives a straight line when you plot the log of y against x (semi-log plot). Special exponential form : f(x) = emx
Consider the algae growth example again. How do you know when a relationship is exponential? Regular plot N= t Semilog plot ln(N) = mt+b
• Fit a line to the transformed data • Estimate the slope and intercept using the least squares method. • Y=mx+b • b~0, m = 0. 693. . • Estimate and . b = ln� -> �= eb = e 0 = 1 m = ln� -> �= em = e 0. 693. . = 2. 0 N = 2 t ln(N) = (0. 693)t N=2 t
Example 17. 9 : Wound healing rate Regular plot Semilog plot
• How do you make a semilog plot? • Use the semilog(x, y) command in Matlab • Take the log of one column of data and plot the transformed data (here log y) against the untransformed data (here x)
• Estimate slope and intercept using least squares • Y = b+mx • m = -0. 048 • b = 4. 69 • b = ln -> = eb = e 4. 69 = 108. 85 • m = ln -> = em = e 0. 048 = 0. 953 • A = 108. 85(0. 953)t ln(A)=4. 96 -0. 048 t A=108. 85(0. 953)t
a f(x)=bx • Allometric relationships (also called power laws) • Describes many relationships between different aspects of a single organism: Length and volume Surface area and volume Body weight and brain weight Body weight and blood volume • Typically x > 0, since negative quantities don’t have biological meaning.
a>1 a=1 a<0
f(x) = bax f(x) = bxa
• Example : It has been determined that for any elephant, surface area of the body can be expressed as an allometric function of trunk length. • For African elephants, a=0. 74, and a particular elephant has a surface area of 20 ft 2 and a trunk length of 1 ft. • What is the surface area of an elephant with a trunk length of 3. 3 ft? • x = trunk length • y= surface area • y = bxa = bx 0. 74 • 20 = b(1)0. 74 20 = b • y=20 x 0. 74 • y=20(3. 3)0. 74=48. 4 ft 2
• How do you know when your data has an allometric relationship? • Example 17. 10
Regular plot Semilog plot log-log plot
• How do you make a log-log plot? • Use the loglog(x, y) command in matlab • Take the log of both columns of data and plot the transformed columns.
• • • Y=bxa ln(y)=ln(bxa) ln(y) = ln(b) + ln(xa) ln(y) = ln(b) + a ln(x) Let Y = ln(y) X=ln(x) B=ln(b) Then Y=B + a X Which is the equation for a straight line. So an allometric function gives a straight line on a loglog plot.