
ECON 151 Macroeconomics Instructor Bob Di Paolo Unemployment

ECON 151 – Macroeconomics Instructor: Bob Di. Paolo Unemployment Chapter 6 Materials include content from Mc. Graw-Hill/Irwin which has been modified by the instructor and displayed with permission of the publisher. All rights reserved.
Introduction n This chapter focuses on: ¨ When is a person “unemployed”? ¨ What are the costs of unemployment? ¨ What is an appropriate policy goal for “full employment”?
The Labor Force The labor force includes all persons over age sixteen who are either working for pay or actively seeking paid employment. n People who are not employed or are not actively seeking work are not considered part of the labor force. n The labor-force participation rate is the percentage of the population working or seeking employment. n
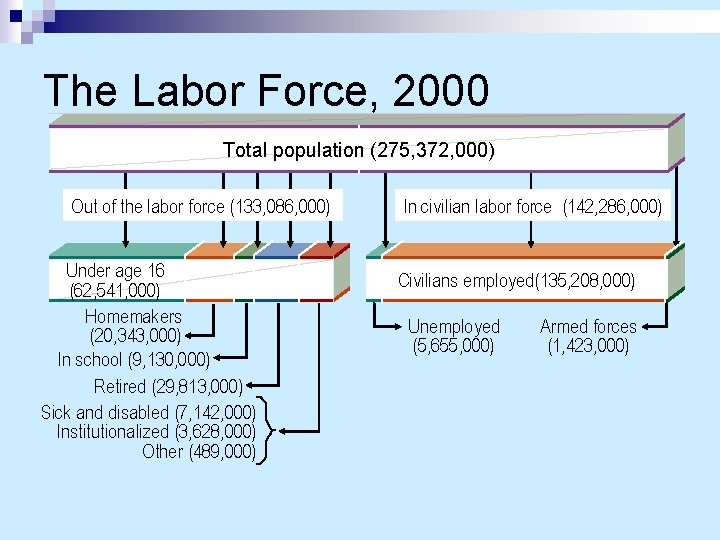
The Labor Force, 2000 Total population (275, 372, 000) Out of the labor force (133, 086, 000) Under age 16 (62, 541, 000) Homemakers (20, 343, 000) In school (9, 130, 000) Retired (29, 813, 000) Sick and disabled (7, 142, 000) Institutionalized (3, 628, 000) Other (489, 000) In civilian labor force (142, 286, 000) Civilians employed(135, 208, 000) Unemployed (5, 655, 000) Armed forces (1, 423, 000)
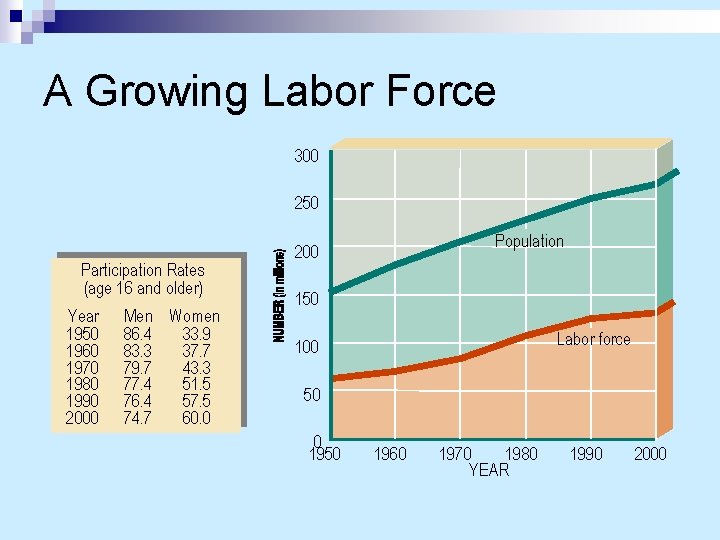
A Growing Labor Force 300 250 Participation Rates (age 16 and older) Year 1950 1960 1970 1980 1990 2000 Men Women 86. 4 33. 9 83. 3 37. 7 79. 7 43. 3 77. 4 51. 5 76. 4 57. 5 74. 7 60. 0 Population 200 150 Labor force 100 50 0 1950 1960 1970 1980 YEAR 1990 2000
Growth of Production Possibilities Production possibilities are the alternative combinations of final goods and services that could be produced in a given time period with all available resources and technology. n Production is limited by two factors: n ¨ The availability of factors of production. ¨ Technological know-how.
Institutional Constraints Production possibilities in any year depend on available resources and technology and on how we choose to restrict their use. n The size of labor force is limited by participation rates and social regulation. n
Institutional Constraints Preventing small children, students, and others from working reduces the size of the labor force and potential output. n Constraints are also imposed on the use of material resources and technology. n
Labor Force Growth As the labor force grows, the production possibilities curve shifts outward. n This outward shift illustrates the increased capacity to produce goods and services given available technology and institutional constraints. n
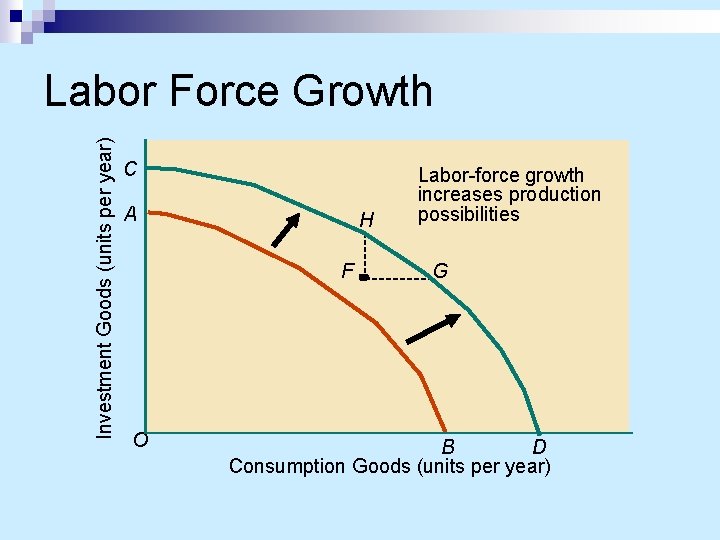
Investment Goods (units per year) Labor Force Growth C A H F O Labor-force growth increases production possibilities G B D Consumption Goods (units per year)
Okun’s Law Arthur Okun quantified the relationship between the shortfall in real output and unemployment. n Okun’s Law asserts that 1% more unemployment is estimated to equal 2 percent less output. n The 2 to 1 ratio puts a dollar value on the aggregate cost of unemployment. n
Okun’s Law n High unemployment in 1992 left the U. S. $240 billion short of its production possibilities — a loss of $920 of goods and services for every American.
Measuring Unemployment is the inability of laborforce participants to find jobs. n U. S. Census Bureau surveys about 60, 000 households a month to determine how many people are actually unemployed. n A person is considered unemployed if he or she is not employed and is actively seeking a job. n
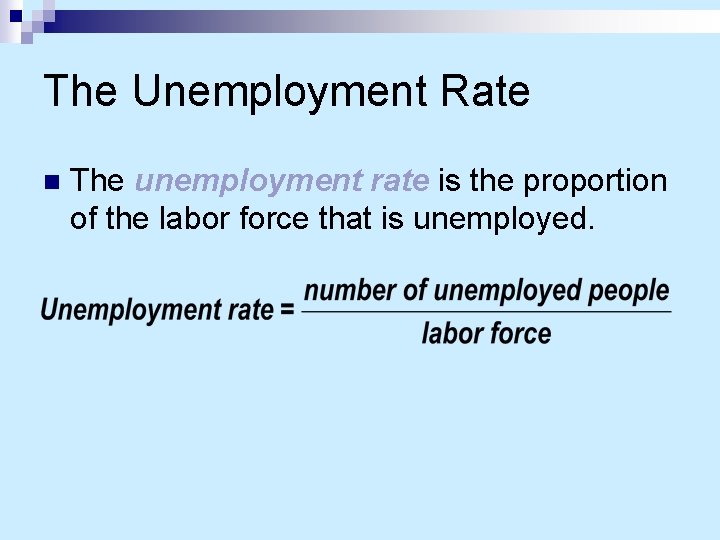
The Unemployment Rate n The unemployment rate is the proportion of the labor force that is unemployed.
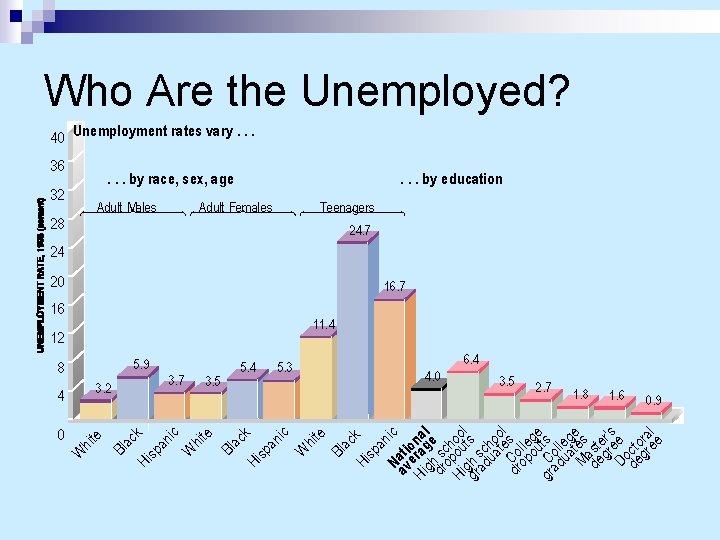
Who Are the Unemployed? 40 Unemployment rates vary. . . 36 . . . by race, sex, age 32 Adult Males 28 . . . by education Adult Females Teenagers 24. 7 24 20 16. 7 16 11. 4 12 6. 4 5. 3 3. 5 2. 7 1. 8 1. 6 0. 9 a Na nic av ti o Hi eragnal g dr h sc e o Hi pouhool gr gh s ts ad ch ua oo te l dr Co s op lle ou ge gr C ts ad oll ua eg Ma tes e de ste gr r's Do ee de cto gr ra ee l k sp Hi Bl ac hit e 4. 0 W sp an k Hi Bl ac e 3. 5 hit W ic sp an k Hi Bl ac W hit e 4 0 3. 7 3. 2 5. 4 ic 5. 9 8
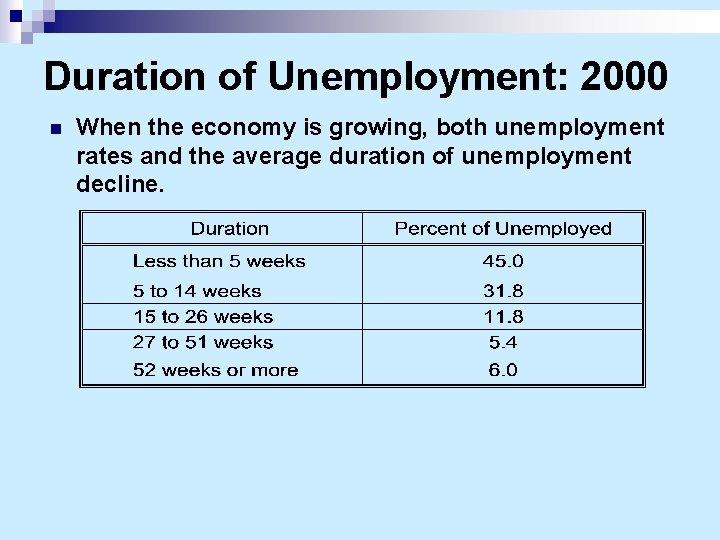
Duration of Unemployment: 2000 n When the economy is growing, both unemployment rates and the average duration of unemployment decline.
Reasons for Unemployment n How long a person remains unemployed is affected by the nature of the joblessness. ¨ Job leavers ¨ Job losers ¨ Reentrants ¨ New entrants
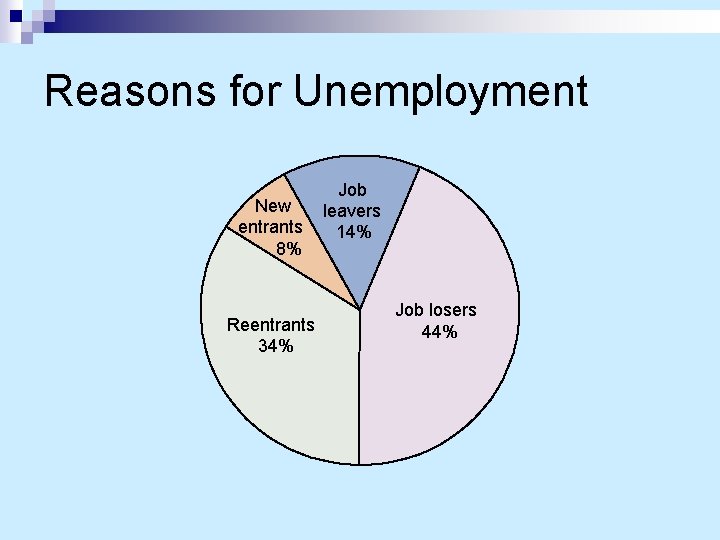
Reasons for Unemployment New entrants 8% Reentrants 34% Job leavers 14% Job losers 44%
Discouraged Workers n n n When unemployment persists, job seekers become increasingly frustrated in their efforts to secure employment and give up looking. A discouraged worker is an individual who is not actively seeking employment but would look for or accept a job if one were available. Discouraged workers are not counted as part of the unemployment problem after they give up looking for a job.
Underemployment n n Some people are forced to take any job available. These people are excluded from the count of unemployed, but not from the condition of underemployment. Underemployment exists when people seeking full-time paid employment work only part time or are employed at jobs below their capability. Underemployed workers represent labor resources that are not being fully utilized.
The Phantom Unemployed n n n Some of the people who are counted as unemployed probably should not be. Many people report that they are actively seeking work when they have little interest in finding a job. Public policy encourages this behavior by requiring most welfare and unemployment benefit receivers to provide evidence that they are looking for work.
Europe’s Unemployment Woes Unemployment levels in Europe are much higher than those of the U. S. n Generous unemployment benefits cushion personal losses from joblessness, but also discourage European workers from accepting new jobs. n CIA World Fact Book
The Human Costs The most visible impact of unemployment on individuals is loss of income n Over a long period, such losses can spell financial disaster. n The human cost of unemployment includes social, physical, and psychological costs as well. n
Seasonal Unemployment n n n Seasonal unemployment is the unemployment due to seasonal changes in employment or labor supply. At the end of each season, thousands of workers must go searching for new jobs, experiencing seasonal unemployment in the process. Statistical adjustments are made for seasonal unemployment.
Frictional Unemployment Frictional unemployment is the brief periods of unemployment experienced by people moving between jobs or into the labor market. n Frictional unemployment differs from other unemployment in three ways: q There is an adequate demand for the labor of the frictionally unemployed. q The frictionally unemployed have the skills required for existing jobs. q The job-search period will be relatively short.
Structural Unemployment Structural unemployment is the unemployment caused by a mismatch between the skills (or location) of job seekers and the requirements (or location) of available jobs. n Periods between jobs will be lengthened when the unemployed lack the skills that employers require. n
Cyclical Unemployment n n Cyclical unemployment is the unemployment attributable to the lack of job vacancies – i. e. , to an inadequate level of aggregate demand. Cyclical unemployment occurs when there are simply not enough jobs to go around. The Great Depression is the most striking example of cyclical unemployment. The economy must grow at least as fast as the labor force to avoid cyclical unemployment.
The Unemployment Record Rate of Unemployment (Percent) 25 20 15 10 5 0 1910 1920 1930 1940 1950 1960 1970 1980 1990 2000
The Full-Employment Goal In the Employment Act of 1946, Congress committed the federal government to pursue a goal of “maximum” employment. n Congress didn’t specify what the rate of unemployment should be. n
The Full-Employment Goal Full employment is not the same as zero unemployment. n A full employment goal presumably means avoiding as much cyclical and structural unemployment as possible, while keeping frictional unemployment reasonably low. n
Inflationary Pressures The first attempt to define full employment more precisely was undertaken in the early 1960 s by the Council of Economic Advisors. n They concluded that rising prices are a signal that employment is nearing capacity. n
Inflationary Pressures § The Council placed full employment at 4% — below that, prices begin rising. § 4% unemployment was regarded as an acceptable compromise of employment and price goals. § Later, however, during the 1970 s and early 1980 s the 4% unemployment goal was considered too high.
Changes in Structural Unemployment n Unemployment stayed far above 4% even when the economy expanded, and inflation began to rise at higher levels of unemployment. n Critics suggested that structural barriers to full employment had gotten worse. ¨ More youth and women. ¨ Liberal transfer payments. ¨ Structural changes in demand.
Redefining Full Unemployment In view of these factors, the Council of Economic Advisers later raised the level of unemployment thought to be compatible with price stability. n In 1983, the Reagan administration concluded that the “inflation-threshold” unemployment rate was between six and seven percent. n
Declining Structural Pressures The structural barriers that intensified inflationary pressures in the 1970 s and early 1980 s receded in the 1990 s, making it easier to lower unemployment rates without increasing inflation. n In 1991 full employment was equivalent to 5. 5 percent. n In 1999, the Clinton administration suggested the full employment threshold might have dropped to 5. 3 percent. n
The “Natural” Rate of Unemployment The ambiguity about what rate of unemployment triggers an upsurge in inflation has convinced some analysts to abandon the inflation-based concept of “full” employment. n The natural rate of unemployment is the long-term rate of unemployment determined by structural forces in labor and product markets. n
The “Natural” Rate of Unemployment The “natural” rate of unemployment consists of frictional and structural components only. n If the structural determinants of unemployment change, so does the level of “natural” unemployment. n
Congressional Targets n n The Full Employment and Balanced Growth Act of 1978 (Humphrey-Hawkins Act) states our national goal is a 4% unemployment rate with a required goal of 3% inflation. The “escape clause” is that in the event that both goals could not be met, the President could set higher “provisional” definitions of employment.
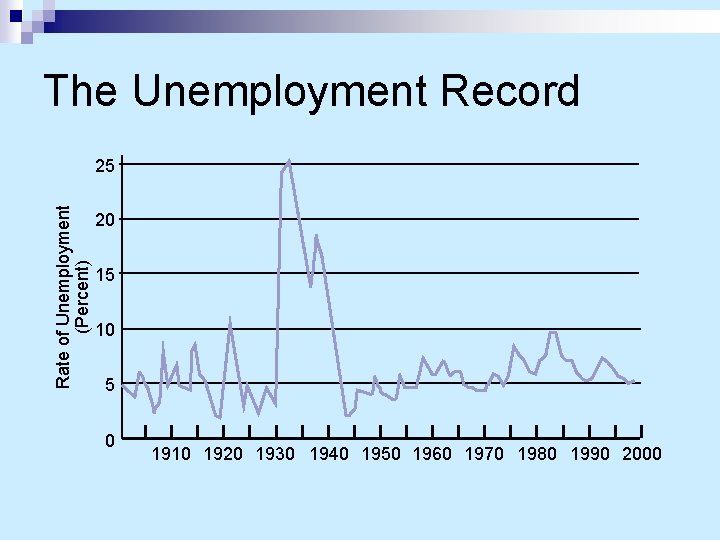
The Historical Record Although there is ambiguity about the specific definition of full employment, the historical record is clear on our failure to maintain it. n Our greatest failure occurred during the Great Depression, when as much as onefourth of the labor force was unemployed. n
The Historical Record n n n Unemployment rates fell dramatically during World War II — the civilian unemployment rate reached a rock bottom 1. 2 percent. Since 1950, unemployment rate has fluctuated from a low of 2. 8 percent during the Korean War (1953) to a high of 10. 8 percent during the 198182 recession. From 1982 to 1989, unemployment fell, but shot up again in the 1990 -91 recession.
A Growing Skills Gap? As the skills gap widens, structural unemployment increases. n The skills gap is the gap between skills required for emerging jobs and the skills of workers. n The rapid pace of structural change represent a major challenge for the U. S. economy in the future. n
New Jobs n n Our success in achieving full employment in the economy of tomorrow will depend on both structural and cyclical forces. Ninety-eight percent of all new jobs created in the next decade will be service jobs. The new jobs of tomorrow will require increasing levels of education and skill. Workers without the right skills will find themselves out of step with a fast-changing market.
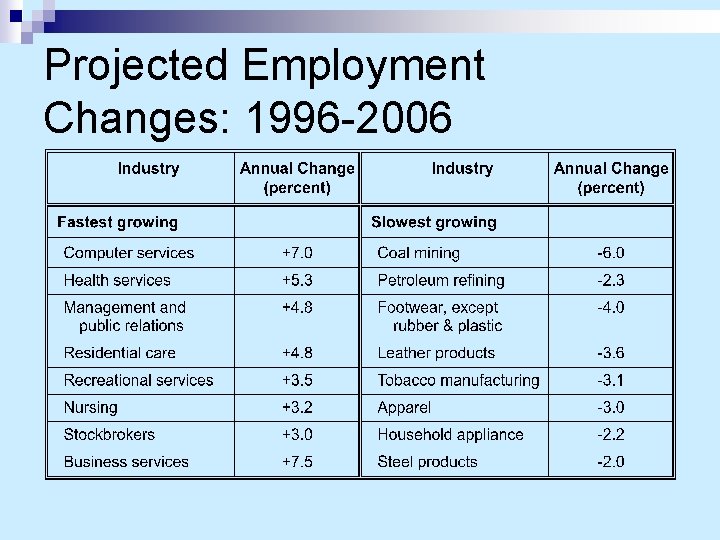
Projected Employment Changes: 1996 -2006
ECON 151 – MACROECONOMICS Unemployment End of Chapter 6
- Slides: 44