Evaluation of Tropical Cyclone Forecasts in the Next


 • Horizontal resolution: ~ 13 km •")
 of 500 -h. Pa height (based on the NCEP")
 dataset The GFDL simple")


- Slides: 24
Evaluation of Tropical Cyclone Forecasts in the Next Generation Global Prediction System Chen, J. ‐H. , S. ‐J. Lin, L. Zhou, X. Chen, S. Rees, M. Bender, and M. Morin, 2019: Evaluation of tropical cyclone forecasts in the next‐generation global prediction system. Mon. Wea. Rev. , 147, 3409– 3428.
introduction • investigating the performance of global TC forecasts in fv. GFS based on 363 cases of 10 -day forecasts in 2015. • Verification: – TC track, intensity forecast errors, genesis forecasts
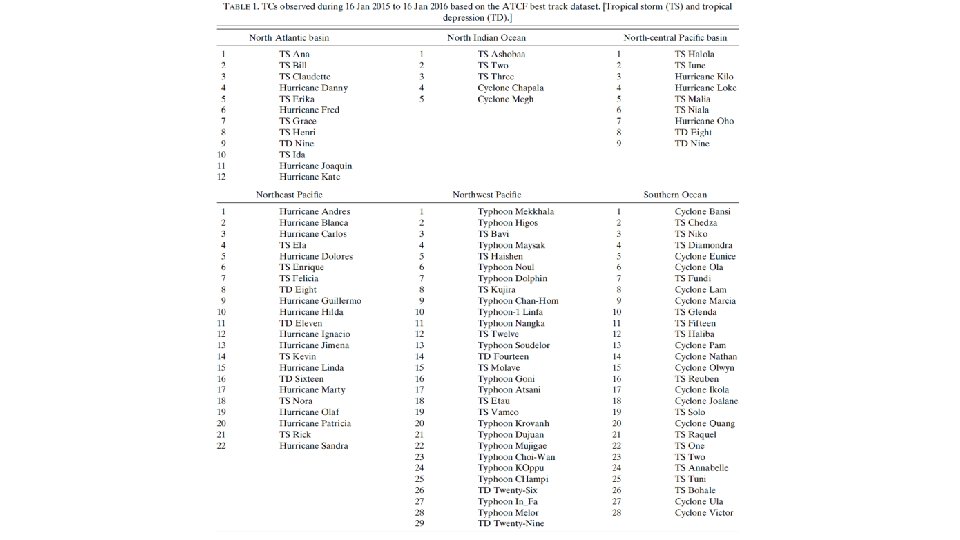
• Model: fv. GFS (C 768) • Horizontal resolution: ~ 13 km • Vertical levels: 63 levels • Model top : 0. 64 h. Pa • 10 -day TC forecasts was investigated based on 363 cases from 16 January 2015 to 16 January 2016 • 0000 UTC initial time for each forecast. • Initial conditions: GFS analysis data • fixed sea surface temperature • FV 3_zc: fv. GFS + Zhao and Carr (1997) • FV 3_mp: fv. GFS + Chen and Lin (2011, 2013)
global anomaly correlation coefficients (ACC) of 500 -h. Pa height (based on the NCEP analysis data) Black lines: GFS red lines: FV 3_zc Blue lines: FV 3_mp ‘‘+++’’: 95% confidence intervals
Track forecasts Best track data: Automated Tropical Cyclone Forecast (ATCF) dataset The GFDL simple tracker (Harris et al. 2016) was adopted for tracking TCs in the forecasts. the model forecasts were initialized at or after the observed TC genesis time. The GFS and both versions of the fv. GFS demonstrate reasonable TC forecast tracks.
TC track northeast Pacific North Atlantic Ocean north-central Pacific northwest Pacific north Indian Ocean Southern Ocean
• the impact to the TC track forecast from updating the FV 3 dynamical core in the GFS is positive
Intensity forecasts – a better relationship between SLP and maximum 10 -m wind speed – overprediction of central pressure but underprediction of 10 -m winds – more intense hurricanes/typhoons (with maximum wind speed over 60 m/s) max. 10 -m wind speed (m/s) • FV 3_zc: min. sea level pressure (h. Pa)
• the large number of overpredicted storm intensity values shown in FV 3_zc is greatly reduced in FV 3_mp in the north-central Pacific basin. • wind–pressure relationship of FV 3_mp is also better matched to the observation
FV 3_mp: – the large number of overpredicted storm intensity values is reduced – wind–pressure relationship is also better matched to the observation
• the main benefit of replacing the Zhao–Carr scheme with the GFDL microphysics scheme is the improvement in intensity prediction rather than track prediction.
TC genesis forecasts in fv. GFS • OLT: the difference in time between the forecast initial time and the time at which observed genesis occurs. • MLT: the time span from the model initial time to the model-predicted genesis lead time. • DMO: The differences between the MLT and OLT • The observed TC genesis times are based on the first tropical depression (TD) record in the ATCF best track data. • hit event: – the maximum time difference of model genesis and observed genesis is set to 72 h. (DOM) – The distance of model and observed storms needs to be within a 5。 by 5。 box centered at the observed storm at their first matched time. • false alarm: Model genesis storms which do not have tracks that match to observed TCs • total genesis events: hit events + false alarms
• Both FV 3_zc and FV 3_mp show more hit events and higher hit ratios than GFS over the globe • The FV 3_mp shows the highest hit ratio in the five regions but not in the north-central Pacific basin, where the GFS performs the best. Lines: hit events Bars: ratios of model hits to total observed genesis events
• GFS forecasts show more false alarms in east Pacific basin than forecasts from the two fv. GFS versions. • hit ratio of FV 3_mp is 2 times larger than that of GFS, which can be explained by the false alarm results.
Lines: monthly numbers of total genesis events Bars: ratios of hit events to total genesis events
the numbers of observed TCs and numbers of missed TCs for the genesis forecasts • Both fv. GFS forecasts showed improvement in the three North Pacific basins, but missed 1 TC genesis in the North Atlantic basin.
miss ratio: the ratio of number of missing cases to the number of expected genesis observations • The GFS shows the highest miss ratio in all basins
mean values of the maximum OLT of all observed T • If a model shows longer OLT, that means it can correctly predict TC genesis earlier than other models. The Mann–Whitney U test is applied to test the significance between the OLTs from any of the two forecasts statistically significant (p value < 0. 05, two tailed)
the fractions of global total hit events occurring within a certain DMO length for each model forecast DMO = MLT - OLT
The fractions of hit events within different DMO lengths • the model predicted genesis events often occur during the precursor stage of the observed TC.
verification of strom genesis intensity
Summary • TC track is better in both versions of fv. GFS over the North Atlantic basin and the northwest Pacific Ocean. • TC intensity: • an advanced dynamical core is contributing to the reduction in TC intensity errors • FV 3_zc overpredicts the intensities for strong storms • FV 3_mp shows much smaller globally averaged intensity biases and absolute errors • TC genesis: • FV 3_mp displays the best performance of the three set of forecasts in hit events, false alarms, and missing cases followed by FV 3_zc.
• Lead time lengths of hit events: – FV 3_mp shows significantly longer OLT than the GFS in the northeast Pacific basin – FV 3_zc shows significantly longer OLT than the GFS in the northwest Pacific basin • TC genesis intensity: – the two fv. GFS versions show larger positive biases than the GFS • updating the GFS dynamical core to the nonhydrostatic FV 3 can largely improve TC intensity forecasts. • The additional improvements in TC intensity and genesis forecasts when replacing the Zhao–Carr cloud microphysics scheme with the advanced GFDL cloud microphysics scheme. • The advection scheme used in the dynamical core has a large impact on TC intensity.