Hurricanes Chapter 16 Hurricane CrossSection eye wall Hurricane
")


 2. Tropical Depression 3. Tropical")


 1992")
 from Tropical Cyclones Knight and Davis, 2007")


")


 An Upward")
 No change")

- Slides: 33
Hurricanes! (Chapter 16)
Hurricane Cross-Section
eye wall Hurricane Cross-Section eye
Hurricane Katrina’s Eye Wall
Hurricane Katrina Rain Rate Estimates
Hurricane Dora Wind Speed and Direction
Progression of Tropical Events 1. Easterly Wave (Tropical Disturbance) 2. Tropical Depression 3. Tropical Storm 4. Hurricane 10 -25% 50 -60%
Easterly Wave low pressure trough moving east to west
Tropical Storm Hurricane Tropical Disturbance
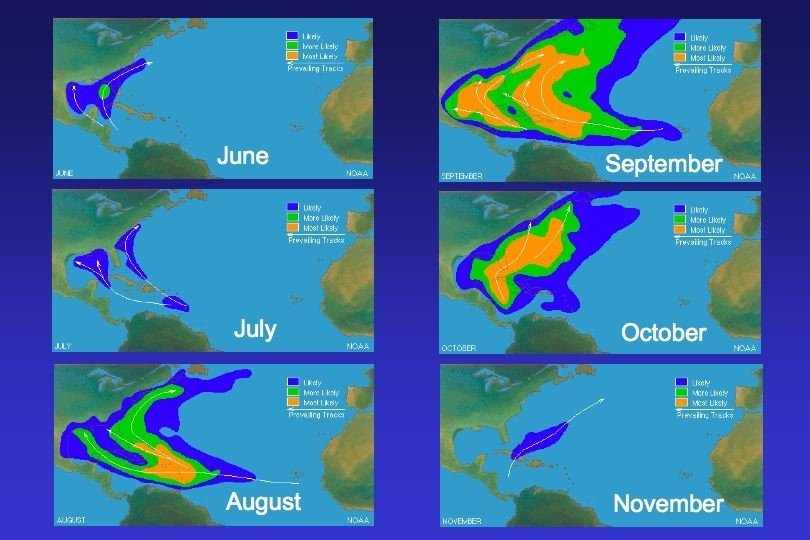
Regional Hurricane Names and Typical Tracks
Tropical Cyclones and Sea-Surface Temperatures Tropical Cyclone Fixes 80°F Water Temperature June/July August September
Atlantic Hurricane Frequency by Date
Hurricane Georges
Atlantic Basin Hurricane Satellite Loops 2005 season https: //www. youtube. com/watch? v=v. B_K e. Km. MOYA (start at 3: 30) 2010 season http: //www. youtube. com/watch? v=ual 22 z n. KM 10&feature=related (Igor, 2: 40)
Regional Hurricane Names and Typical Tracks H H
GLOBAL TROPICAL CYCLONES 1985– 2005
COASTAL HURRICANE VULNERABILITY > 50 years between landfall < 20 years # years between hurricanes # years between major hurricanes
Damage • Wind • Tornadoes • Flooding Storm Surge
Hurricane Storm Surge
# U. S. Landfalling Hurricanes, 1901– 2013 1935 Florida Keys 1969 Camille (Biloxi) 1992 Andrew (Miami)
% Rainfall (May-Nov) from Tropical Cyclones Knight and Davis, 2007
ANNUAL NUMBER OF NORTH ATLANTIC TROPICAL CYCLONES When do the storm counts become reliable?
Global Hurricanes: 1971– 2017
Hurricane Development Factors • High Water Temperatures • Unstable lower atmosphere Cool up • Moisture convergence at surface Warm L • Lack of vertical wind shear up Wind
Deadliest U. S. Hurricanes, 1880– 2010 (Blake et al. , 2011)
Costliest U. S. Hurricanes 1900– 2017 (Blake et al. , 2011 with updates; damages not inflation-adjusted)
Costliest U. S. Hurricanes 1900– 2017 (Blake et al. , 2011 with updates; adjusted to 2017 dollars)
U. S. Total Losses per Year from Atlantic Tropical Cyclones (1900– 2005) An Upward Trend? (Source: Pielke Jr. , R. , 2006, Oceanography, 19, 138 -147)
Normalized U. S. Losses per Year from Atlantic Tropical Cyclones (1900– 2005) No change when population demographics are properly considered (Source: Pielke Jr. , R. , 2006, Oceanography, 19, 138 -147)

 Which statement below is not correct concerning hurricanes
 Sound wall phonemic awareness
 Chris brown wall to wall
 Soldier course vs sailor course
 Members used to carry wall loads over wall openings
 Pod fruit develops from
 Eye wall
 Hammurabi
 Difference between birds eye view and worm's eye view
 Eye for an eye code
 Anemic eyes pictures vs normal
 Code of hammurabi activity
 An eye for an eye a tooth for a tooth sister act
 Explain the image
 An eye for an eye meaning
 Behold he is coming
 Venn diagram of typhoon and tornado
 Distribution of tropical storms
 How are hurricanes categorized
 Hurricanes and tornadoes similarities
 Hurricanes definition
 Do hurricanes cool the ocean
 Hurricane carnot engine
 Hurricanes tropical storms
 Why do hurricanes lose strength over land
 Hurricanes myths and facts
 Hurricanes earth's mightiest storms
 Difference between brownie and cake
 Bill nye hurricanes
 Barbecue sentence
 Typhoon and hurricane venn diagram
 Turks and caicos hurricane season
 Hurricane katrina apush
 Map of tornado alley


