ENGAGE Your Students In College and Career Readiness


 Profile of scores Interpretive feedback, sorted from strengths")


- Slides: 34
ENGAGE Your Students! In College and Career Readiness April Hansen ACT Client Relations
ACT’s Definition of College and Career Readiness The level of preparation a student needs to be ready to enroll and succeed in—without remediation—a first-year, credit-bearing course at two- or four-year institutions or in trade or technical schools. Adopted by the Common Core State Standards Initiative
How do we define college and career readiness? Empirically derived scores needed on an ACT subject-area test to indicate a 50% chance of obtaining a B or higher or a 75% chance of obtaining a C or higher in the corresponding first-year credit-bearing college course. College Course EXPLORE Grade 8 EXPLORE Grade 9 PLAN Grade 10 ACT Compass English Composition 13 14 15 18 77 College Algebra 17 18 19 22 52 Reading Social Science 15 16 17 22 88 Science Biology 20 20 21 23 NA Test English Math
Students who are college/career ready when they leave high school have a significantly higher likelihood of: Enrolling in college the fall following high school graduation Persisting to a second year at the same institution Earning a grade of B or higher in first-year college courses Earning a first-year college GPA of 3. 0 or higher Not needing to take a remedial courses Graduating within 150% of time Entering the job market with significantly higher lifetime earning potential. Regardless of ethnicity and SES
Why Should We Care?
Leaky Educational Pipeline • Many students are not prepared to meet the hurdles they face throughout the academic pipeline, and they don’t persist and succeed. ~100% Enter 9 th grade HS Graduate Enter College Graduate (Bachelor’s) 96. 9% 74. 9% 52. 5% 29. 0% NCES 2010 7
Our Challenge Between 2008 and 2018… ü 29 million students will graduate from public high schools … ü 34 million jobs will need to be filled due to retiring or transitioning workers… ü 10 million of the 29 million public high school graduates will be underrepresented students who traditionally have been underserved by K-12 education. To fill workforce demands, it is critical that each student graduate from high school ready for college and career. Source: Business Roundtable, Dec. 2009
Leaky Educational Pipeline Pop Quiz What’s the number of American high school students who drop out of school, every day, bored, frustrated, or so far behind that they’ve given up? 6, 000
Earnings Potential $26, 000 Average annual salary difference between college and high school graduates Source: 2008 Census Bureau
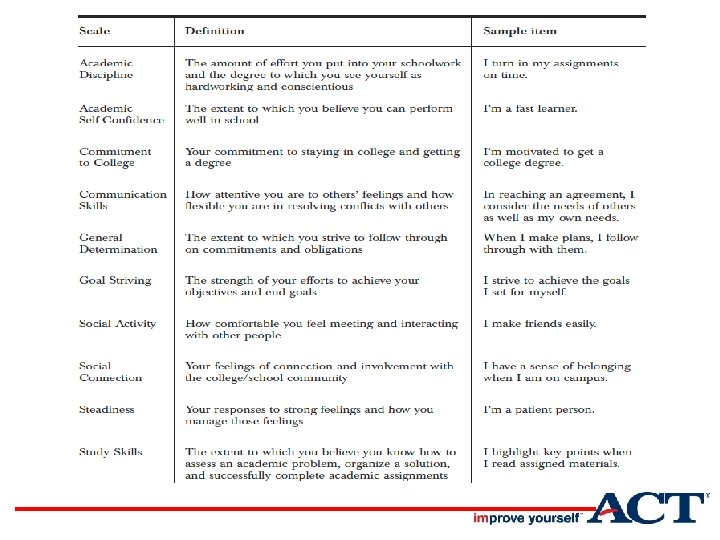
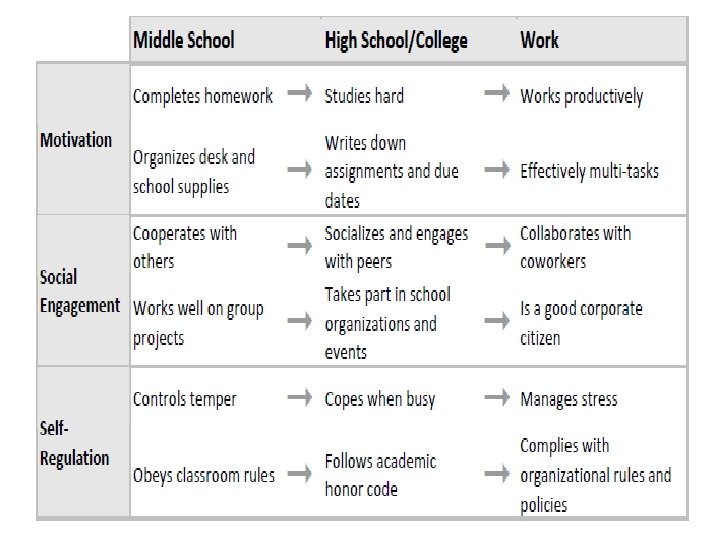
What if you had an assessment that would: • evaluate students’ personal, behavioral, and academic skills critical to high school and college achievement • determine their levels of academic risk • apply specific interventions to help them persist in their studies and achieve academic success • identify student strengths and areas for improvement in student motivation, social engagement, and self-regulation • predict college retention for each incoming freshman
You Do!
Research is the Foundation 14, 000 Students at 48 postsecondary institutions Thousands of students in grades 6 -9 Reviewed meta-analysis of 109 studies that examined predictors of academic performance and retention
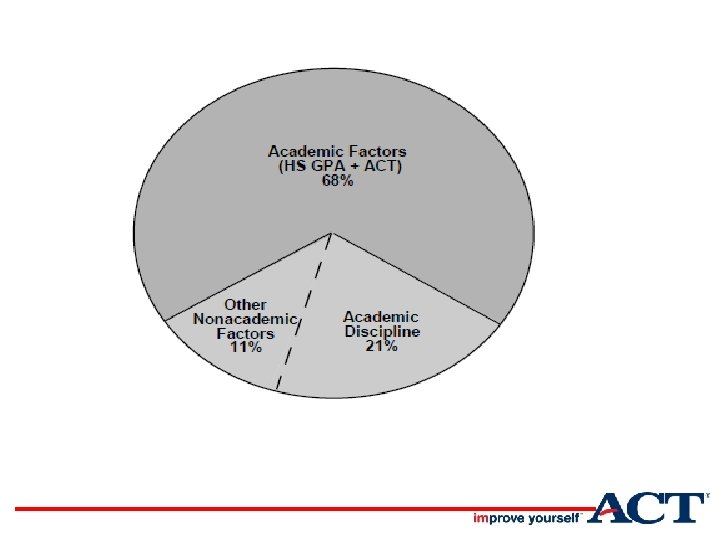
Research is the Foundation 1. The strongest predictors of college persistence and degree completion are: prior academic achievement and course selection (rigorous high school classes). 2. Prior academic achievement and cognitive ability surpass all other factors in their influence on student performance. 3. Non-academic factors can influence academic performance, retention and persistence, but cannot substitute for it.
106 questions; 30 minutes
108 questions; 30 -40 minutes
2 Predictive Indices Retention Index: likelihood of graduating from high school or returning for the next year Academic Success Index: likelihood of a GPA of 2. 0 or higher
What You Can Do: 1. Monitor student behavior: goal-setting, feelings management, social connection, etc. 2. Promote appropriate curriculum activities, career planning, understanding of financial aid, work experiences and school activities. 3. Place the highest priority on their strengths, but also provide suggestions for progress. 4. Add up to 30 local items. 5. Test online and run reports immediately.
What You Can Do: 6. Track students’ progress and assess the effectiveness of activities and interventions. 7. Administer at orientation/beginning of school year and have reports for early in the semester. 8. Target known “at-risk” groups. 9. Create a cross walk of scales to your services and use within an existing framework of services. 10. Consider the whole student.
Reports and Resources Reports: Student Advisor Roster Aggregate Resources: User Guide Student Tool shop
Success Indices (only on Advisor Report) Profile of scores Interpretive feedback, sorted from strengths to needs © 2012 by ACT, Inc. All rights reserved. 25
ENGAGE: Sample Interpretative Reports © 2012 by ACT, Inc. All rights reserved. 26
© 2012 by ACT, Inc. All rights reserved. 31
Case Studies • Mc. Pherson Unified School District, Mc. Pherson, Kansas – Enrolls 2, 400 students – Mc. Pherson assesses students in grade 6 as a baseline and grade 9 to confirm they are on track – Based on scores, have targeted three groups of students for intervention – Staff review academic/non-academic, student advisors meet with students to create plans and develop their skills
Sample Crosswalk of Resources Scale Definition Resources Academic Discipline Effort put into school work and the degree to which students see themselves as hardworking and conscientious. • Learning Center • Office of Exploring Majors • Math Tutor Lab • Student Writing Lab Social Connection Feelings of connection and involvement with school and community. • • Academic Self-Confidence Belief in ability to perform well in school. • Learning Center • Counseling and Testing • Office of Exploring Majors © 2012 by ACT, Inc. All rights reserved. Off-Campus Student Services Transfer Center Residence Life Recreation Center 33
www. act. org/engage