Theodore Roosevelt College Career Academy March 8 2017


- Slides: 24
Theodore Roosevelt College & Career Academy March 8, 2017 State Board of Education Report
Our Vision Every Student Proficient and Prepared for College and Careers 2
Our Mission: The mission of Theodore Roosevelt College and Career Academy is to maximize the potential of each student, creating the urgency to reach proficiency and assuring that students are given the greatest opportunity to learn and perform at high levels through premium-quality teaching and leadership as well as an effective, supportive learning environment. 3
In The Beginning… Strategic Plan Development with All Stakeholders Conducted a Collaborative Quality Analysis (CQA) using our proprietary School Design Rubric to assess the school’s current strengths and areas of opportunity
Systematic Challenges Pre-Edison. Learning • Fear - lack of School Safety • ODR - average of 180 monthly referrals • Suspensions – 1, 827 in the first year • 67% Attendance Rates • Lack of a consistent, comprehensive Behavior Management System
Academic Challenges Pre-Edison. Learning • 41% Graduation Rate • 75% of students read fell far below grade level in Reading according to SRI & Level. Set • 60% of graduating seniors enrolled in a 2 -4 year college or vocational program • 58% average of under-accredited students
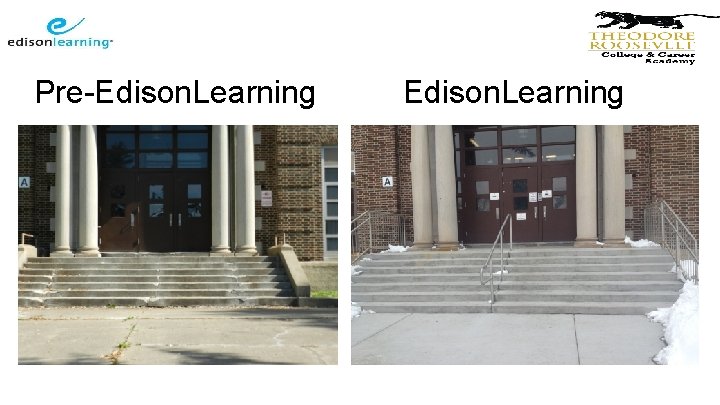
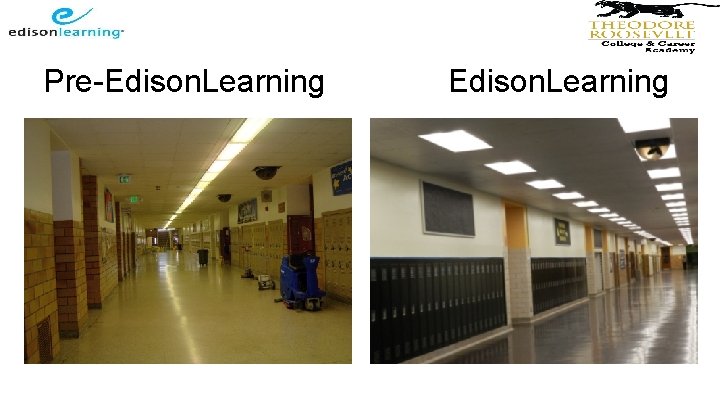
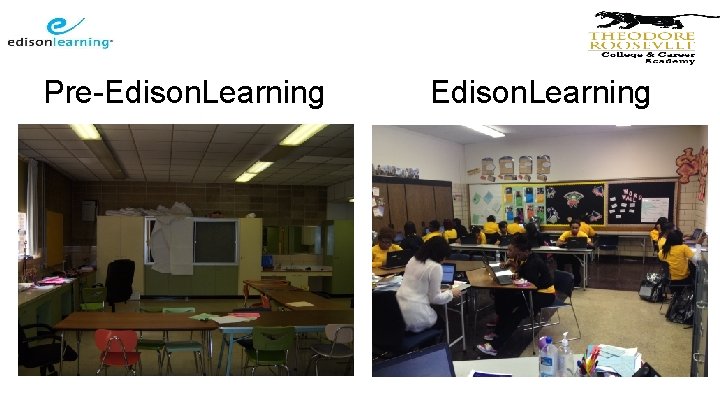
Pre-Edison. Learning
Pre-Edison. Learning
Pre-Edison. Learning
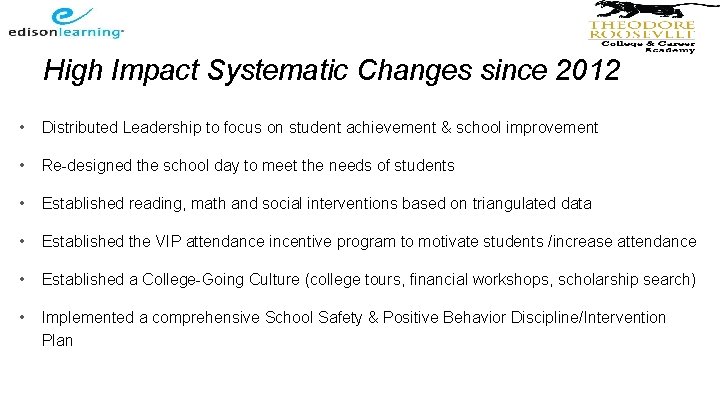
High Impact Systematic Changes since 2012 • Distributed Leadership to focus on student achievement & school improvement • Re-designed the school day to meet the needs of students • Established reading, math and social interventions based on triangulated data • Established the VIP attendance incentive program to motivate students /increase attendance • Established a College-Going Culture (college tours, financial workshops, scholarship search) • Implemented a comprehensive School Safety & Positive Behavior Discipline/Intervention Plan
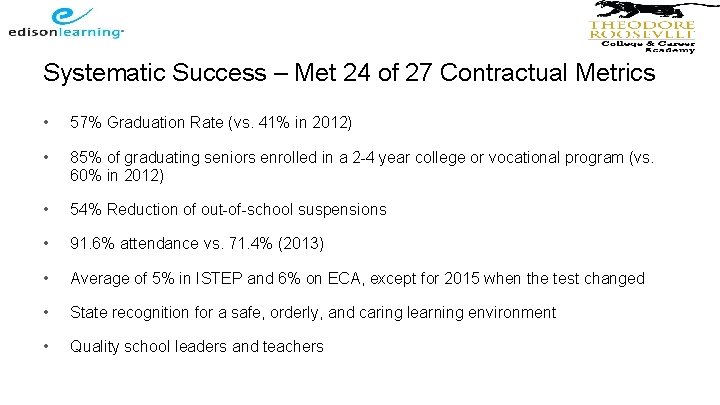
Systematic Success – Met 24 of 27 Contractual Metrics • 57% Graduation Rate (vs. 41% in 2012) • 85% of graduating seniors enrolled in a 2 -4 year college or vocational program (vs. 60% in 2012) • 54% Reduction of out-of-school suspensions • 91. 6% attendance vs. 71. 4% (2013) • Average of 5% in ISTEP and 6% on ECA, except for 2015 when the test changed • State recognition for a safe, orderly, and caring learning environment • Quality school leaders and teachers
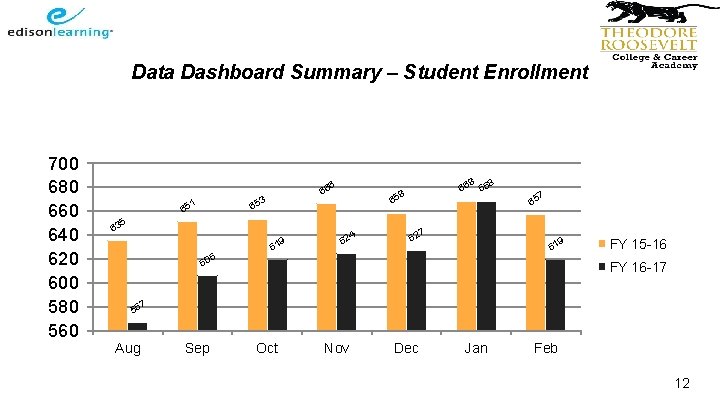
Data Dashboard Summary – Student Enrollment 700 680 660 640 620 600 580 560 8 6 66 3 1 65 66 58 6 65 5 63 19 6 60 6 4 62 8 66 7 65 7 62 9 61 FY 15 -16 FY 16 -17 7 56 Aug Sep Oct Nov Dec Jan Feb 12
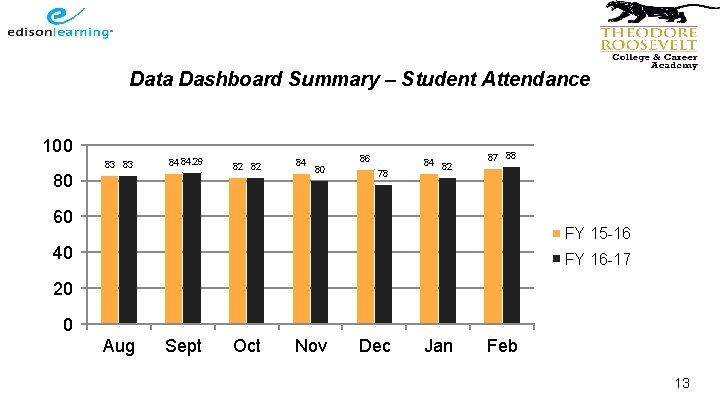
Data Dashboard Summary – Student Attendance 100 83 83 84 84. 29 80 82 82 84 86 80 78 84 82 87 88 60 FY 15 -16 40 FY 16 -17 20 0 Aug Sept Oct Nov Dec Jan Feb 13
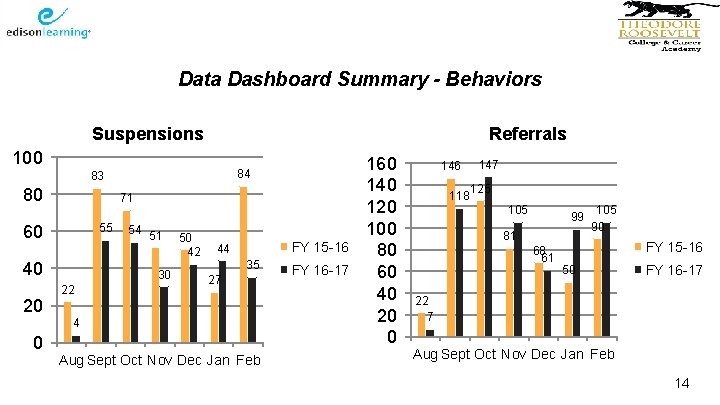
Data Dashboard Summary - Behaviors Suspensions Referrals 100 84 83 80 71 55 60 40 20 54 51 30 22 50 42 FY 15 -16 44 35 27 4 0 Aug Sept Oct Nov Dec Jan Feb FY 16 -17 160 140 120 100 80 60 40 20 0 146 118 147 125 105 99 81 68 61 105 90 FY 15 -16 50 FY 16 -17 22 7 Aug Sept Oct Nov Dec Jan Feb 14
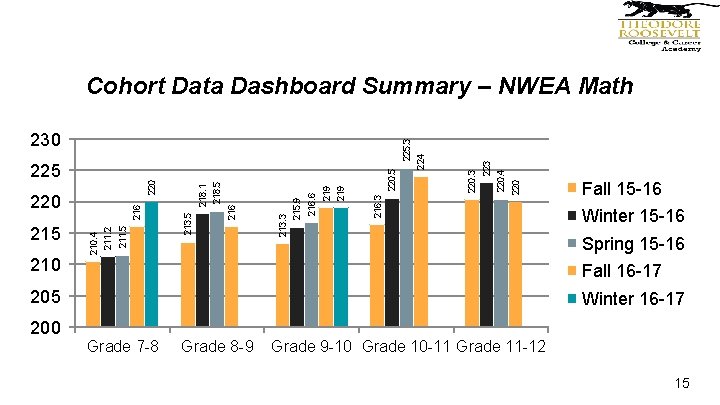
210 220. 4 220 223 220. 5 216. 3 219 216. 6 215. 9 213. 3 216 213. 5 211. 2 210. 4 215 216 220 218. 1 220 225 218. 5 225. 3 230 224 Cohort Data Dashboard Summary – NWEA Math Fall 15 -16 Winter 15 -16 Spring 15 -16 Fall 16 -17 205 Winter 16 -17 200 Grade 7 -8 Grade 8 -9 Grade 9 -10 Grade 10 -11 Grade 11 -12 15
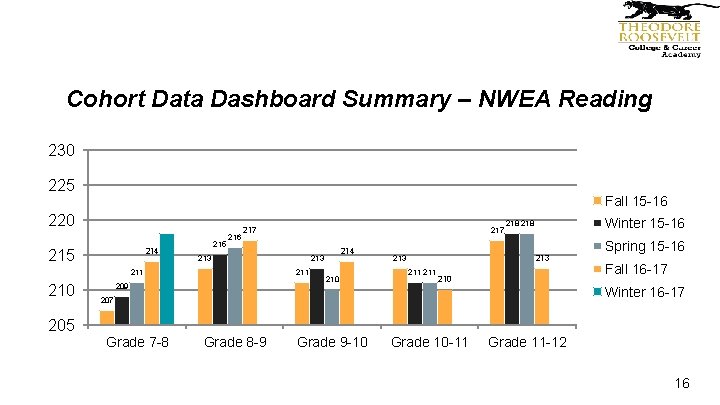
Cohort Data Dashboard Summary – NWEA Reading 230 225 Fall 15 -16 220 215 214 215 216 217 213 211 210 217 211 209 214 213 210 Winter 15 -16 218 213 211 210 Spring 15 -16 Fall 16 -17 Winter 16 -17 205 Grade 7 -8 Grade 8 -9 Grade 9 -10 Grade 10 -11 Grade 11 -12 16
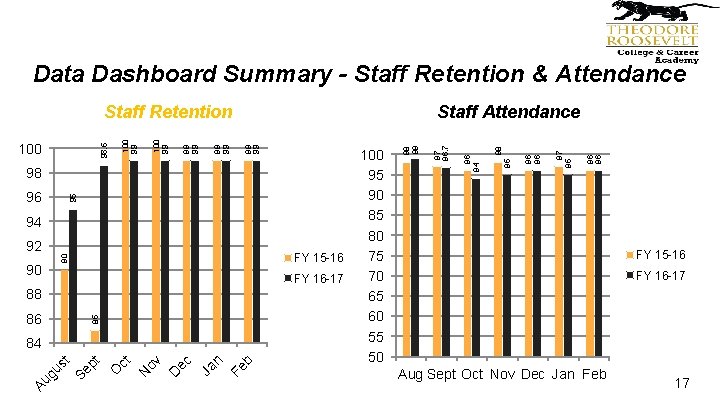
Data Dashboard Summary - Staff Retention & Attendance 96 95 94 92 90 90 FY 15 -16 FY 16 -17 86 85 88 Au gu st Se pt O ct N ov D ec Ja n Fe b 84 96 96 97 95 96 96 98 95 97 96 94 98 100 95 90 85 80 75 70 65 60 55 50 98 99 Staff Attendance 99 99 99 100 99 98. 6 100 99 Staff Retention FY 15 -16 FY 16 -17 Aug Sept Oct Nov Dec Jan Feb 17
Data Dashboard Summary Professional Development – Unified & Differentiated • Unpacking standards • Lesson Planning • School-wide Literacy (Informational Text & Strategies) • Writing Objectives • Measuring Learning 18
Effective Turnaround School Leadership Goal: Set high expectations for all students and staff by ensuring student work is intellectually challenging, and demonstrates mastery of standards, and ensure that students receive meaningful feedback Intervention: The administrative team meets weekly to review and discuss progress indivual and group progress on standards-based lesson plans, aligned assessments and student progress toward mastery. Teachers and curriculum leaders analyze lesson data and develop action plans to adjust classroom instruction, differentiating according to students academic needs and identified deficiencies. Research: http: //www. ncte. org/library/NCTEFiles/Resources/Journals/EJ/1031 -sep 2013/EJ 1031 Better. pdf; http: //www. ascd. org/publications/educational-leadership/dec 13/vol 71/num 04/How-Good-Is-Good. Enough%C 2%A 2. aspx ; Evidence of Progress: • Distributed leadership model with key leads identified and supporting implementation and monitoring goals • Standards-based lesson plans showing alignment of differentiated activities, strategies and assessments • Adjusted master schedule to reflect boot camp courses (Saturday School) to meet needs of all student • Student work and students’ ability to articulate how to get to the next level in their learning 19
Effective Instruction that meets the needs of all students and is aligned with state standards Goal: Ensure teachers are using a variety of high impact pedagogical strategies to address learning gaps and engage students in their learning Intervention: School leaders conduct regular, consistent classroom observations of all staff to ensure that effective instruction is taking place and to provide constructive feedback for ongoing improvement Supporting Research: Marzano, Robert. What Works in Schools; Lemov, Doug. Teach Like A Champion. http: //tntp. org/assets/tools/NSA-USI%20 Increasing%20 Rigor%20 Throughout%20 the%20 Lesson-Data. Driven%20 Classroom%20 Best%20 Pratices%20 TSLT_0311. pdf Evidence of Progress: • • Admin create and adhere to an observation schedule where an average of 17 observations are conducted followed by individual and team feedback and coaching conversations Teachers use feedback from coaching conversations and pd to improve th eir practice, specifically the selection of pedagogical strategies that best align to student deficiencies 20
Using data to differentiate instruction and provide interventions Goal: Strategically align professional development to staff differentiated needs based upon teacher observations, formative assessment data, and school-wide goals Intervention: Teachers and administrators agree upon professional and personal goals, mapping out and monitoring growth plans. Using subject-specific data and feedback from staff, administrators align professional develop to meet the needs of teachers that ultimately impact school goals. Supporting Research: Bambrick-Santoyo, Paul. Driven by Data; Hattie, John. Visible Learning; The Keys to Adult Learning: Theory and Practical Strategies. Philadelphia: Research for Better Schools Evidence of Progress: Administrators share data and work with teachers and teacher teams during professional development to analyze triangulated data such as NWEA, Achieve level-set, classroom data and observation and plan lessons and activities accordingly. Through observations and feedback conversations, administrators and teachers are able to agree upon professional development needs for individual teachers and teacher teams. 21
Community and Stakeholder Input and Engagement The Roosevelt Admin and Leadership Team shares progress and gains input from community stakeholders in a variety of formats: • Board Meetings • Title I Parent Meeting & Monthly Parent Meeting • Open Houses • Capital City Partnership • Purdue University Extension Program (Nutrition class for pregnant/parenting teens) • Nurse-Family Partnership Program support to our pregnant teens for two years after their child's birth. 22
Next Steps Goal 1: Strategically align professional development to staff differentiated needs based upon teacher observations, formative assessment data, and school-wide goals • Superintendent/Student Success Director will continue to debrief with the Principal to discuss individual and collective pd needs of teachers based on formative assessment data trends and class observations. Achievement Team meetings will continue to meet to analyze NWEA data and monitor student progress on reading and math interventions. Weekly Administrative meetings to evaluate and modify professional development and training. Goal 2: Ensure teachers are using a variety of high impact pedagogical strategies to address learning gaps and engage students in their learning • Observations of best practices through nstructional rounds and weekly lesson plan reviews Coaching sessions with Achieve 3000 partners. Goal 3: Set high expectations for all students and staff by ensuring student work is intellectually challenging, and demonstrates mastery of standards, and ensure that students receive meaningful feedback. • 23 Review winter NWEA score reports with students and create goals. Student recognition for NWEA achievement.
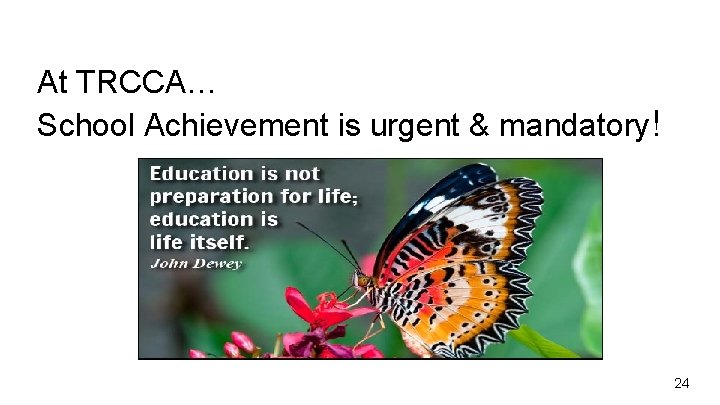
At TRCCA… School Achievement is urgent & mandatory! 24