Employment in rural and small town areas in





































































- Slides: 91
Employment in rural and small town areas in the months BCE (before Covid era or before coma economy) and in the months CE (Covid era or coma economy) Selected charts up to June, 2020 July 10, 2020 Ray D. Bollman Ray. D. Bollman@sasktel. net Research Associate, Rural Development Institute, Brandon University Professional Associate, Leslie Harris Centre of Regional Policy and Development, Memorial University Research Associate, Rural Futures Research Centre, Dalhousie University
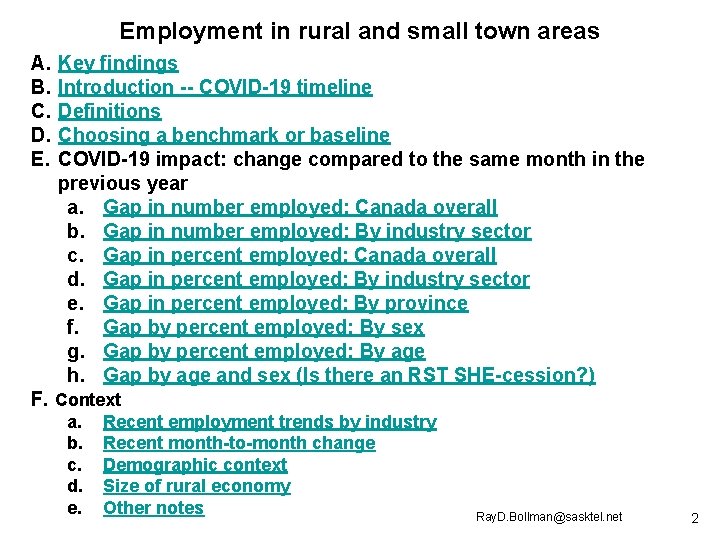
Employment in rural and small town areas A. B. C. D. E. Key findings Introduction -- COVID-19 timeline Definitions Choosing a benchmark or baseline COVID-19 impact: change compared to the same month in the previous year a. Gap in number employed: Canada overall b. Gap in number employed: By industry sector c. Gap in percent employed: Canada overall d. Gap in percent employed: By industry sector e. Gap in percent employed: By province f. Gap by percent employed: By sex g. Gap by percent employed: By age h. Gap by age and sex (Is there an RST SHE-cession? ) F. Context a. b. c. d. e. Recent employment trends by industry Recent month-to-month change Demographic context Size of rural economy Other notes Ray. D. Bollman@sasktel. net 2
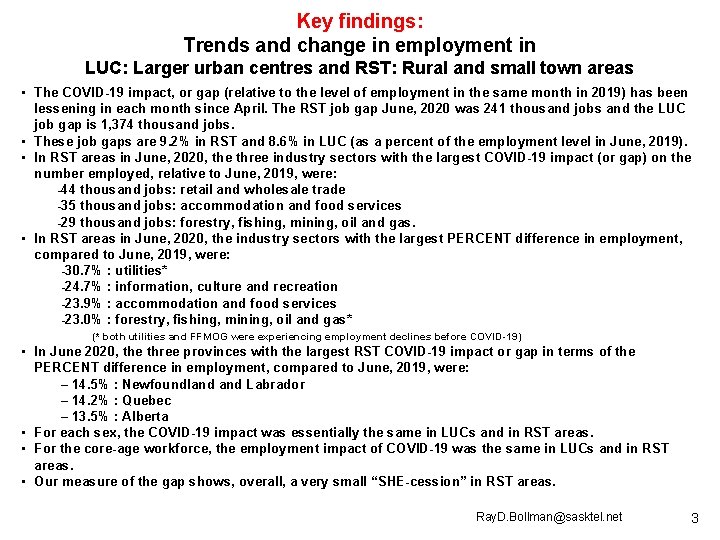
Key findings: Trends and change in employment in LUC: Larger urban centres and RST: Rural and small town areas • The COVID-19 impact, or gap (relative to the level of employment in the same month in 2019) has been lessening in each month since April. The RST job gap June, 2020 was 241 thousand jobs and the LUC job gap is 1, 374 thousand jobs. • These job gaps are 9. 2% in RST and 8. 6% in LUC (as a percent of the employment level in June, 2019). • In RST areas in June, 2020, the three industry sectors with the largest COVID-19 impact (or gap) on the number employed, relative to June, 2019, were: -44 thousand jobs: retail and wholesale trade -35 thousand jobs: accommodation and food services -29 thousand jobs: forestry, fishing, mining, oil and gas. • In RST areas in June, 2020, the industry sectors with the largest PERCENT difference in employment, compared to June, 2019, were: -30. 7% : utilities* -24. 7% : information, culture and recreation -23. 9% : accommodation and food services -23. 0% : forestry, fishing, mining, oil and gas* (* both utilities and FFMOG were experiencing employment declines before COVID-19) • In June 2020, the three provinces with the largest RST COVID-19 impact or gap in terms of the PERCENT difference in employment, compared to June, 2019, were: – 14. 5% : Newfoundland Labrador – 14. 2% : Quebec – 13. 5% : Alberta • For each sex, the COVID-19 impact was essentially the same in LUCs and in RST areas. • For the core-age workforce, the employment impact of COVID-19 was the same in LUCs and in RST areas. • Our measure of the gap shows, overall, a very small “SHE-cession” in RST areas. Ray. D. Bollman@sasktel. net 3
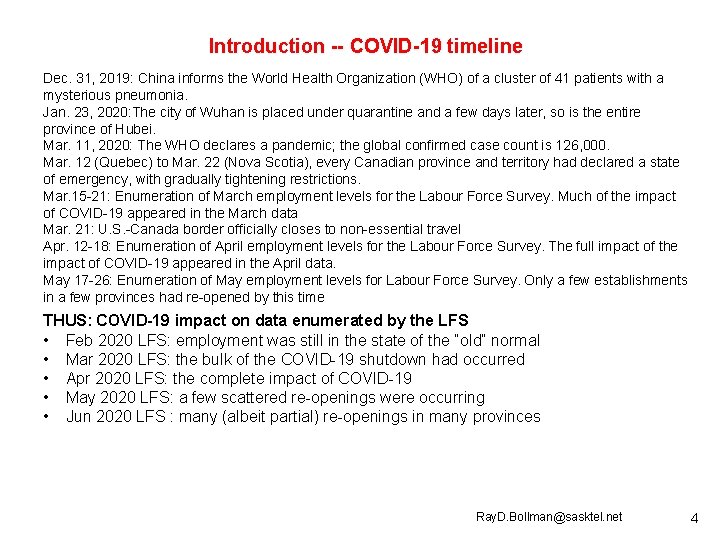
Introduction -- COVID-19 timeline Dec. 31, 2019: China informs the World Health Organization (WHO) of a cluster of 41 patients with a mysterious pneumonia. Jan. 23, 2020: The city of Wuhan is placed under quarantine and a few days later, so is the entire province of Hubei. Mar. 11, 2020: The WHO declares a pandemic; the global confirmed case count is 126, 000. Mar. 12 (Quebec) to Mar. 22 (Nova Scotia), every Canadian province and territory had declared a state of emergency, with gradually tightening restrictions. Mar. 15 -21: Enumeration of March employment levels for the Labour Force Survey. Much of the impact of COVID-19 appeared in the March data Mar. 21: U. S. -Canada border officially closes to non-essential travel Apr. 12 -18: Enumeration of April employment levels for the Labour Force Survey. The full impact of the impact of COVID-19 appeared in the April data. May 17 -26: Enumeration of May employment levels for Labour Force Survey. Only a few establishments in a few provinces had re-opened by this time THUS: COVID-19 impact on data enumerated by the LFS • Feb 2020 LFS: employment was still in the state of the “old” normal • Mar 2020 LFS: the bulk of the COVID-19 shutdown had occurred • Apr 2020 LFS: the complete impact of COVID-19 • May 2020 LFS: a few scattered re-openings were occurring • Jun 2020 LFS : many (albeit partial) re-openings in many provinces Ray. D. Bollman@sasktel. net 4
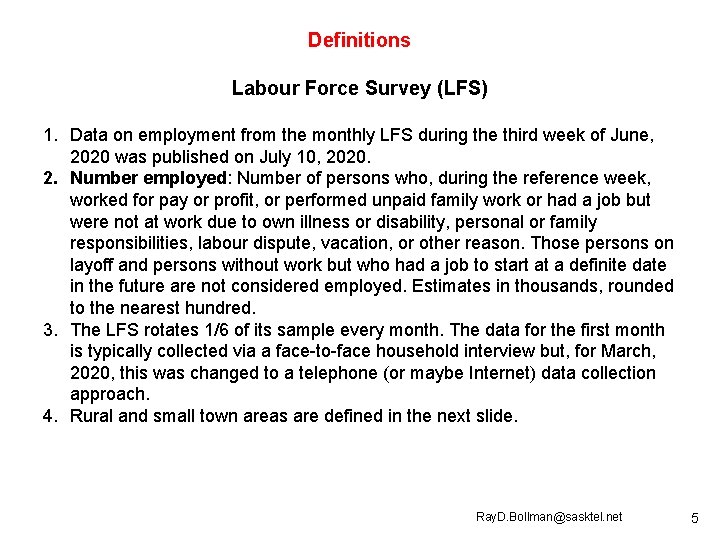
Definitions Labour Force Survey (LFS) 1. Data on employment from the monthly LFS during the third week of June, 2020 was published on July 10, 2020. 2. Number employed: Number of persons who, during the reference week, worked for pay or profit, or performed unpaid family work or had a job but were not at work due to own illness or disability, personal or family responsibilities, labour dispute, vacation, or other reason. Those persons on layoff and persons without work but who had a job to start at a definite date in the future are not considered employed. Estimates in thousands, rounded to the nearest hundred. 3. The LFS rotates 1/6 of its sample every month. The data for the first month is typically collected via a face-to-face household interview but, for March, 2020, this was changed to a telephone (or maybe Internet) data collection approach. 4. Rural and small town areas are defined in the next slide. Ray. D. Bollman@sasktel. net 5
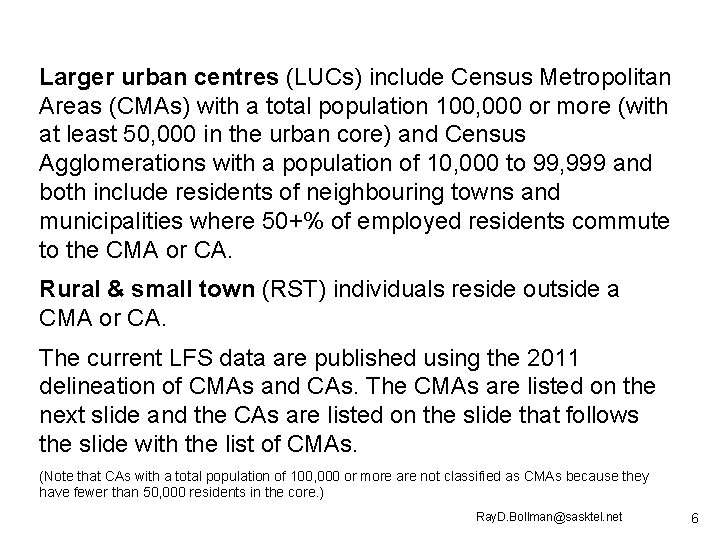
Larger urban centres (LUCs) include Census Metropolitan Areas (CMAs) with a total population 100, 000 or more (with at least 50, 000 in the urban core) and Census Agglomerations with a population of 10, 000 to 99, 999 and both include residents of neighbouring towns and municipalities where 50+% of employed residents commute to the CMA or CA. Rural & small town (RST) individuals reside outside a CMA or CA. The current LFS data are published using the 2011 delineation of CMAs and CAs. The CMAs are listed on the next slide and the CAs are listed on the slide that follows the slide with the list of CMAs. (Note that CAs with a total population of 100, 000 or more are not classified as CMAs because they have fewer than 50, 000 residents in the core. ) Ray. D. Bollman@sasktel. net 6
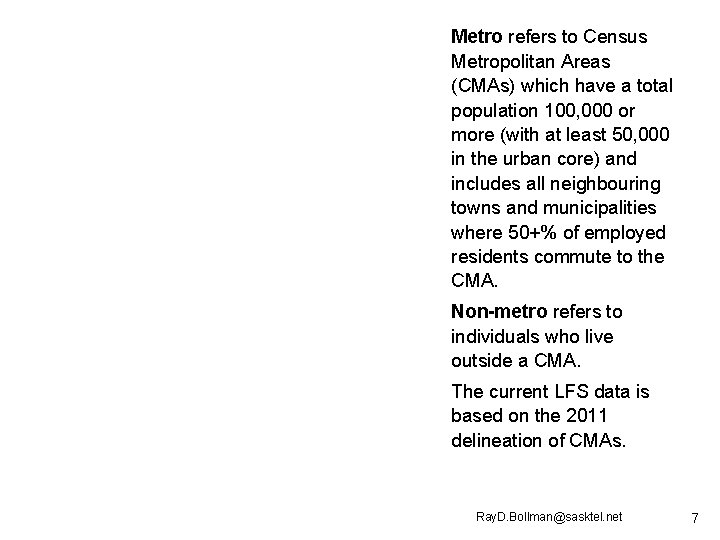
Metro refers to Census Metropolitan Areas (CMAs) which have a total population 100, 000 or more (with at least 50, 000 in the urban core) and includes all neighbouring towns and municipalities where 50+% of employed residents commute to the CMA. Non-metro refers to individuals who live outside a CMA. The current LFS data is based on the 2011 delineation of CMAs. Ray. D. Bollman@sasktel. net 7
Ray. D. Bollman@sasktel. net 8
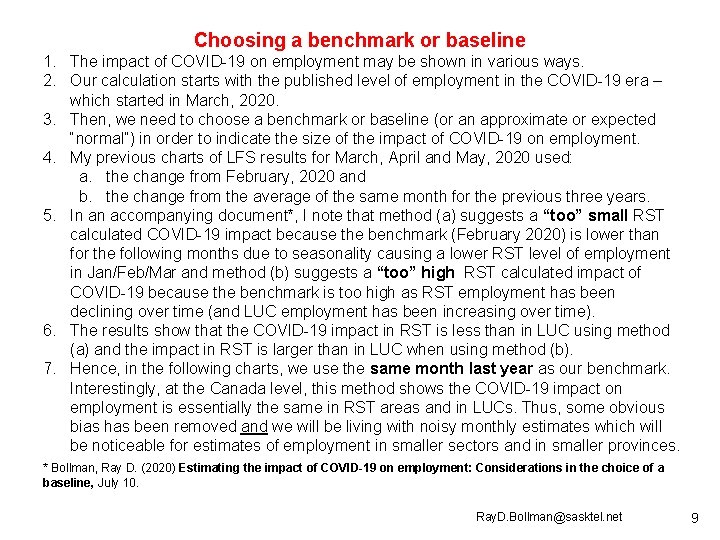
Choosing a benchmark or baseline 1. The impact of COVID-19 on employment may be shown in various ways. 2. Our calculation starts with the published level of employment in the COVID-19 era – which started in March, 2020. 3. Then, we need to choose a benchmark or baseline (or an approximate or expected “normal”) in order to indicate the size of the impact of COVID-19 on employment. 4. My previous charts of LFS results for March, April and May, 2020 used: a. the change from February, 2020 and b. the change from the average of the same month for the previous three years. 5. In an accompanying document*, I note that method (a) suggests a “too” small RST calculated COVID-19 impact because the benchmark (February 2020) is lower than for the following months due to seasonality causing a lower RST level of employment in Jan/Feb/Mar and method (b) suggests a “too” high RST calculated impact of COVID-19 because the benchmark is too high as RST employment has been declining over time (and LUC employment has been increasing over time). 6. The results show that the COVID-19 impact in RST is less than in LUC using method (a) and the impact in RST is larger than in LUC when using method (b). 7. Hence, in the following charts, we use the same month last year as our benchmark. Interestingly, at the Canada level, this method shows the COVID-19 impact on employment is essentially the same in RST areas and in LUCs. Thus, some obvious bias has been removed and we will be living with noisy monthly estimates which will be noticeable for estimates of employment in smaller sectors and in smaller provinces. * Bollman, Ray D. (2020) Estimating the impact of COVID-19 on employment: Considerations in the choice of a baseline, July 10. Ray. D. Bollman@sasktel. net 9
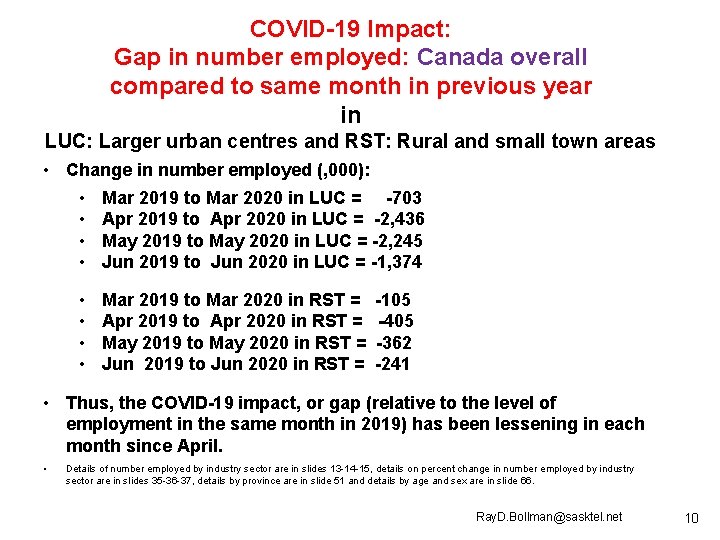
COVID-19 Impact: Gap in number employed: Canada overall compared to same month in previous year in LUC: Larger urban centres and RST: Rural and small town areas • Change in number employed (, 000): • Mar 2019 to Mar 2020 in LUC = -703 • Apr 2019 to Apr 2020 in LUC = -2, 436 • May 2019 to May 2020 in LUC = -2, 245 • Jun 2019 to Jun 2020 in LUC = -1, 374 • • Mar 2019 to Mar 2020 in RST = Apr 2019 to Apr 2020 in RST = May 2019 to May 2020 in RST = Jun 2019 to Jun 2020 in RST = -105 -405 -362 -241 • Thus, the COVID-19 impact, or gap (relative to the level of employment in the same month in 2019) has been lessening in each month since April. • Details of number employed by industry sector are in slides 13 -14 -15, details on percent change in number employed by industry sector are in slides 35 -36 -37, details by province are in slide 51 and details by age and sex are in slide 66. Ray. D. Bollman@sasktel. net 10
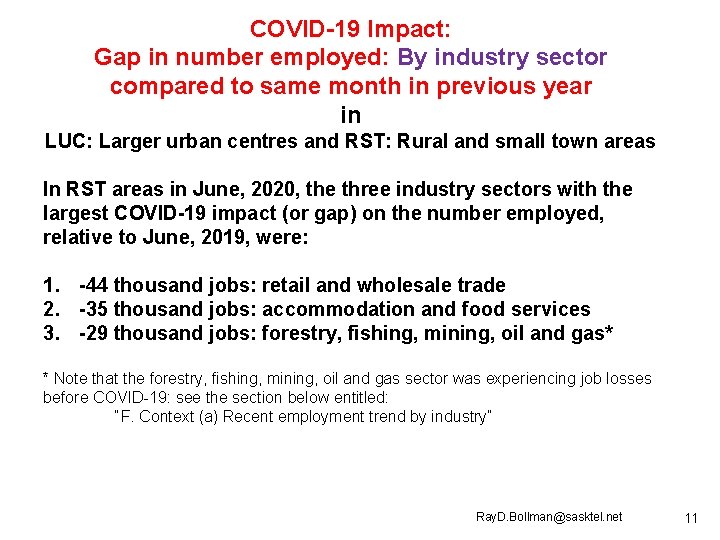
COVID-19 Impact: Gap in number employed: By industry sector compared to same month in previous year in LUC: Larger urban centres and RST: Rural and small town areas In RST areas in June, 2020, the three industry sectors with the largest COVID-19 impact (or gap) on the number employed, relative to June, 2019, were: 1. -44 thousand jobs: retail and wholesale trade 2. -35 thousand jobs: accommodation and food services 3. -29 thousand jobs: forestry, fishing, mining, oil and gas* * Note that the forestry, fishing, mining, oil and gas sector was experiencing job losses before COVID-19: see the section below entitled: “F. Context (a) Recent employment trend by industry” Ray. D. Bollman@sasktel. net 11
Ray. D. Bollman@sasktel. net 12
Ray. D. Bollman@sasktel. net 13
Ray. D. Bollman@sasktel. net 14
Ray. D. Bollman@sasktel. net 15
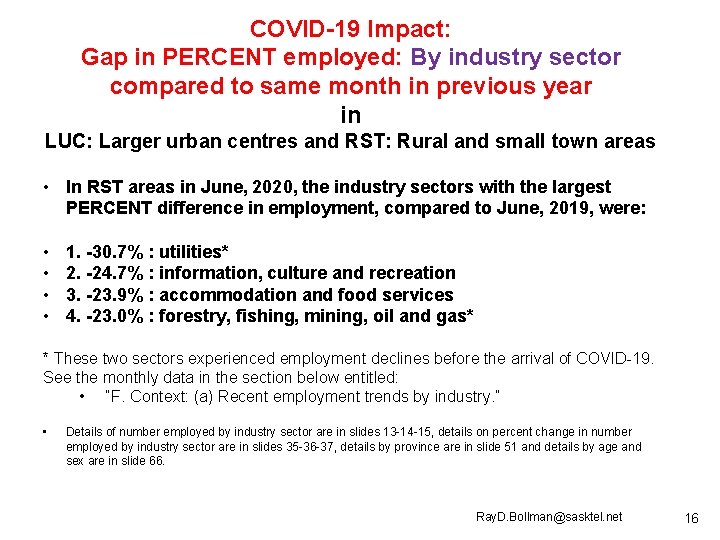
COVID-19 Impact: Gap in PERCENT employed: By industry sector compared to same month in previous year in LUC: Larger urban centres and RST: Rural and small town areas • In RST areas in June, 2020, the industry sectors with the largest PERCENT difference in employment, compared to June, 2019, were: • • 1. -30. 7% : utilities* 2. -24. 7% : information, culture and recreation 3. -23. 9% : accommodation and food services 4. -23. 0% : forestry, fishing, mining, oil and gas* * These two sectors experienced employment declines before the arrival of COVID-19. See the monthly data in the section below entitled: • “F. Context: (a) Recent employment trends by industry. ” • Details of number employed by industry sector are in slides 13 -14 -15, details on percent change in number employed by industry sector are in slides 35 -36 -37, details by province are in slide 51 and details by age and sex are in slide 66. Ray. D. Bollman@sasktel. net 16
Ray. D. Bollman@sasktel. net 17
Ray. D. Bollman@sasktel. net 18
Ray. D. Bollman@sasktel. net 19
Ray. D. Bollman@sasktel. net 20
Ray. D. Bollman@sasktel. net 21
Ray. D. Bollman@sasktel. net 22
Ray. D. Bollman@sasktel. net 23
Ray. D. Bollman@sasktel. net 24
Ray. D. Bollman@sasktel. net 25
Ray. D. Bollman@sasktel. net 26
Ray. D. Bollman@sasktel. net 27
Ray. D. Bollman@sasktel. net 28
Ray. D. Bollman@sasktel. net 29
Ray. D. Bollman@sasktel. net 30
Ray. D. Bollman@sasktel. net 31
Ray. D. Bollman@sasktel. net 32
Ray. D. Bollman@sasktel. net 33
Ray. D. Bollman@sasktel. net 34
Ray. D. Bollman@sasktel. net 35
Ray. D. Bollman@sasktel. net 36
Ray. D. Bollman@sasktel. net 37
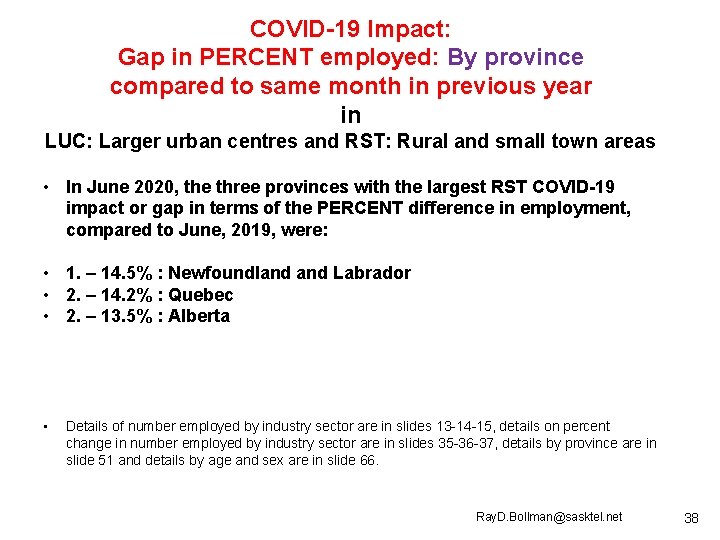
COVID-19 Impact: Gap in PERCENT employed: By province compared to same month in previous year in LUC: Larger urban centres and RST: Rural and small town areas • In June 2020, the three provinces with the largest RST COVID-19 impact or gap in terms of the PERCENT difference in employment, compared to June, 2019, were: • 1. – 14. 5% : Newfoundland Labrador • 2. – 14. 2% : Quebec • 2. – 13. 5% : Alberta • Details of number employed by industry sector are in slides 13 -14 -15, details on percent change in number employed by industry sector are in slides 35 -36 -37, details by province are in slide 51 and details by age and sex are in slide 66. Ray. D. Bollman@sasktel. net 38
Ray. D. Bollman@sasktel. net 39
Ray. D. Bollman@sasktel. net 40
Ray. D. Bollman@sasktel. net 41
Ray. D. Bollman@sasktel. net 42
Ray. D. Bollman@sasktel. net 43
Ray. D. Bollman@sasktel. net 44
Ray. D. Bollman@sasktel. net 45
Ray. D. Bollman@sasktel. net 46
Ray. D. Bollman@sasktel. net 47
Ray. D. Bollman@sasktel. net 48
Ray. D. Bollman@sasktel. net 49
Ray. D. Bollman@sasktel. net 50
Ray. D. Bollman@sasktel. net 51
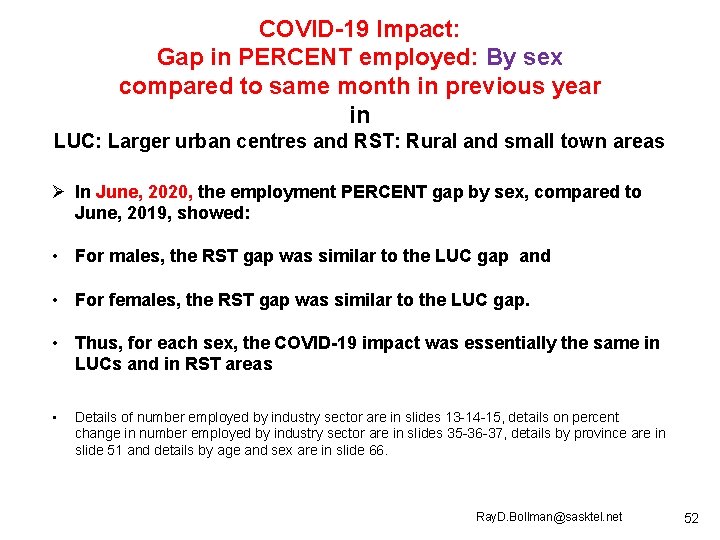
COVID-19 Impact: Gap in PERCENT employed: By sex compared to same month in previous year in LUC: Larger urban centres and RST: Rural and small town areas Ø In June, 2020, the employment PERCENT gap by sex, compared to June, 2019, showed: • For males, the RST gap was similar to the LUC gap and • For females, the RST gap was similar to the LUC gap. • Thus, for each sex, the COVID-19 impact was essentially the same in LUCs and in RST areas • Details of number employed by industry sector are in slides 13 -14 -15, details on percent change in number employed by industry sector are in slides 35 -36 -37, details by province are in slide 51 and details by age and sex are in slide 66. Ray. D. Bollman@sasktel. net 52
Ray. D. Bollman@sasktel. net 53
Ray. D. Bollman@sasktel. net 54
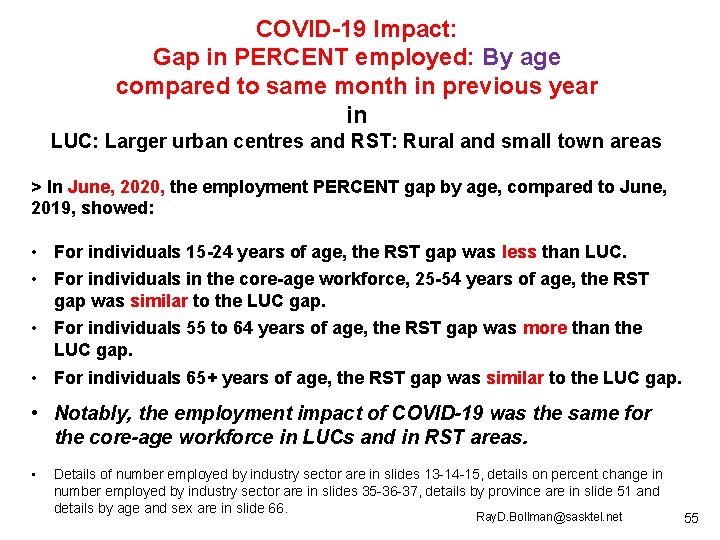
COVID-19 Impact: Gap in PERCENT employed: By age compared to same month in previous year in LUC: Larger urban centres and RST: Rural and small town areas > In June, 2020, the employment PERCENT gap by age, compared to June, 2019, showed: • For individuals 15 -24 years of age, the RST gap was less than LUC. • For individuals in the core-age workforce, 25 -54 years of age, the RST gap was similar to the LUC gap. • For individuals 55 to 64 years of age, the RST gap was more than the LUC gap. • For individuals 65+ years of age, the RST gap was similar to the LUC gap. • Notably, the employment impact of COVID-19 was the same for the core-age workforce in LUCs and in RST areas. • Details of number employed by industry sector are in slides 13 -14 -15, details on percent change in number employed by industry sector are in slides 35 -36 -37, details by province are in slide 51 and details by age and sex are in slide 66. Ray. D. Bollman@sasktel. net 55
Ray. D. Bollman@sasktel. net 56
Ray. D. Bollman@sasktel. net 57
Ray. D. Bollman@sasktel. net 58
Ray. D. Bollman@sasktel. net 59
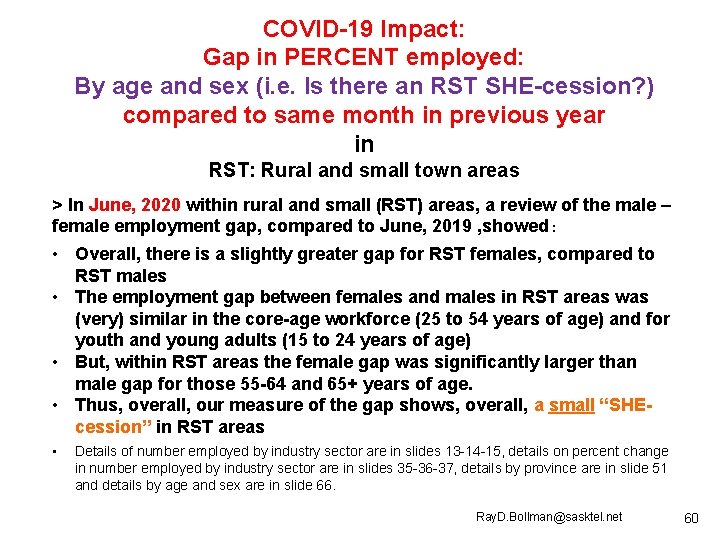
COVID-19 Impact: Gap in PERCENT employed: By age and sex (i. e. Is there an RST SHE-cession? ) compared to same month in previous year in RST: Rural and small town areas > In June, 2020 within rural and small (RST) areas, a review of the male – female employment gap, compared to June, 2019 , showed : • Overall, there is a slightly greater gap for RST females, compared to RST males • The employment gap between females and males in RST areas was (very) similar in the core-age workforce (25 to 54 years of age) and for youth and young adults (15 to 24 years of age) • But, within RST areas the female gap was significantly larger than male gap for those 55 -64 and 65+ years of age. • Thus, overall, our measure of the gap shows, overall, a small “SHEcession” in RST areas • Details of number employed by industry sector are in slides 13 -14 -15, details on percent change in number employed by industry sector are in slides 35 -36 -37, details by province are in slide 51 and details by age and sex are in slide 66. Ray. D. Bollman@sasktel. net 60
Ray. D. Bollman@sasktel. net 61
Ray. D. Bollman@sasktel. net 62
Ray. D. Bollman@sasktel. net 63
Ray. D. Bollman@sasktel. net 64
Ray. D. Bollman@sasktel. net 65
Ray. D. Bollman@sasktel. net 66
Context: Recent employment trends by industry • The objective of these charts is to provide 5 years of historical context to the LUC and RST employment trends in each industry. • Specifically: • The trend in recent years; and • The month-to-month variability in the published estimates • In the charts, the LUC data are plotted using the LHS = left-hand scale and the RST data are plotted using the RHS = right-hand scale. Ray. D. Bollman@sasktel. net 67
Ray. D. Bollman@sasktel. net 68
Ray. D. Bollman@sasktel. net 69
Ray. D. Bollman@sasktel. net 70
Ray. D. Bollman@sasktel. net 71
Ray. D. Bollman@sasktel. net 72
Ray. D. Bollman@sasktel. net 73
Ray. D. Bollman@sasktel. net 74
Ray. D. Bollman@sasktel. net 75
Ray. D. Bollman@sasktel. net 76
Ray. D. Bollman@sasktel. net 77
Ray. D. Bollman@sasktel. net 78
Ray. D. Bollman@sasktel. net 79
Ray. D. Bollman@sasktel. net 80
Ray. D. Bollman@sasktel. net 81
Ray. D. Bollman@sasktel. net 82
Ray. D. Bollman@sasktel. net 83
Ray. D. Bollman@sasktel. net 84
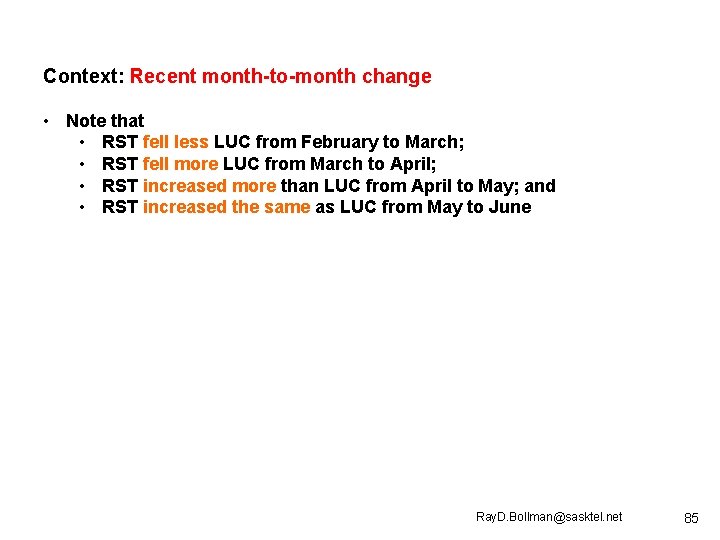
Context: Recent month-to-month change • Note that • RST fell less LUC from February to March; • RST fell more LUC from March to April; • RST increased more than LUC from April to May; and • RST increased the same as LUC from May to June Ray. D. Bollman@sasktel. net 85
Ray. D. Bollman@sasktel. net 86
Ray. D. Bollman@sasktel. net 87
Demographic context: Rural Canada is growing, but not everywhere Bollman, Ray D. and Heather A. Clemenson (2008) Structure and Change in Canada’s Rural Demography: An Update to 2006 with Provincial Detail (Ottawa: Statistics Canada, Agriculture and Rural Working Paper No. 90, Catalogue no. 21 -601 -MIE) (https: //www 150. statcan. gc. ca/n 1/en/catalogue/21 -601 -M) Bollman, Ray D. (2012) Canada’s rural population is growing: A rural demography update to 2011 (Guelph: Rural Ontario Institute) (http: //www. ruralontarioinstitute. ca/file. aspx? id=231 b 5 f 1 a-a 7 ca-4 ddf-b 69 e-4034 a 35 de 640). Bollman, Ray D. (2014) Rural Canada 2013: An Update -- A statement of the current structure and trends in Rural Canada. Paper prepared for the Federation of Canadian Municipalities. (http: //crrf. ca/rural-canada-2013 -an-update/) Bollman, Ray D. (2014) Manitoba’s Rural Demography: Structure and Trends, An Update. Webinar prepared for the Rural Development Institute, Brandon University, November 4. (Slides available at https: //www. brandonu. ca/rdi/files/2014/03/Bollman-2014 -RDI-Webinar-MBs-Rural-Demography-ppt. pdf and voice recording available at https: //momentum. adobeconnect. com/_a 832732884/p 6 xl 84 bcdbp/? launcher=false&fcs. Content=true&pb. Mode=normal ) Bollman, Ray D. (2016) Maps of sub-provincial demographic levels and trends annually to 2015 (http: //www. ruralontarioinstitute. ca/uploads/userfiles/Maps%20 of%20 Subprovincial%20 Demography%20 to%20 July%202015%20 -%20 Updated%20 Feb%202016%20 -%201. pdf) Bollman, Ray D. (2017) Rural Demographic Update (Canada and Provinces): 2016 (Guelph: Rural Ontario Institute) (http: //www. ruralontarioinstitute. ca/file. aspx? id=26 acac 18 -6 d 6 e-4 fc 5 -8 be 6 -c 16 d 326305 fe). Bollman, Ray D. (2017) “Rural Ontario’s Demography: Census Update 2016” Focus on Rural Ontario (Guelph: Rural Ontario Institute, March) (http: //www. ruralontarioinstitute. ca/uploads/userfiles/Rural%20 Ontario%E 2%80%99 s%20 Demography_Census%20 Up date%202016. pdf). Ray. D. Bollman@sasktel. net 88
Context: Size of rural economy • Canada’s rural economy makes a significant contribution to the GDP in each province. See: § Bollman (2019) Charts of Levels and Trends: Metro and Non-metro Gross Domestic Product (GDP), Canada and Provinces, 2009 to 2016 which I can send along upon request. . Ray. D. Bollman@sasktel. net 89
Context: Notes • My powerpoint charts and tables for the LFS data for April, 2020 and for May, 2020, along with a special issues of “Focus on Rural Ontario” entitled “COVID-19 Impact on Rural Employment: Ontario in the Canadian context” for each of April, 2020 and May 2020 can be accessed via two blogs at the Rural Ontario Institute https: //www. ruralontarioinstitute. ca/blog/ • I will be submitting a blog with similar material based on the LFS data for June, 2020. • Numerous Statistics Canada reports on the impact of COVID-19 are available as Catalogue no. 45 -28 -0001 (https: //www 150. statcan. gc. ca/n 1/en/catalogue/45280001) • The monthly report of the LFS results are published as part of the Statistics Canada publication called THE DAILY. The easiest way to find the (lengthy and comprehensive) report is to use Google to search for “The Daily – Labour Force Survey, June 2020” (and similarly, for the report for any other month). Ray. D. Bollman@sasktel. net 90
Employment in rural and small town areas in the months BCE (before Covid era or before coma economy) and in the months CE (Covid era or coma economy) Selected charts up to June, 2020 July 10, 2020 Ray D. Bollman Ray. D. Bollman@sasktel. net Research Associate, Rural Development Institute, Brandon University Professional Associate, Leslie Harris Centre of Regional Policy and Development, Memorial University Research Associate, Rural Futures Research Centre, Dalhousie University