
Town of Herndon VA Water Sewer MultiYear Financial


- Slides: 24
Town of Herndon, VA Water & Sewer Multi-Year Financial Plan November 8, 2017 Member NYSE|FINRA|SIPC
Background ¡ The Town of Herndon (the “Town”) operates a Water and Sewer Utility Enterprise System. The Water and Sewer System has historically been self supporting and has not relied on support from the General Fund. ¡ The Town is anticipating substantial future growth tied in part to planned development downtown and the extension of the Silver Line. ¡ The Town will need to invest in additional Water and Sewer capacity to accommodate planned future growth as well as to maintain existing Water and Sewer infrastructure. ¡ Davenport & Company LLC (“Davenport”) in our capacity as Financial Advisor to the Town, in conjunction with the Municipal and Financial Services Group (“MFSG”), the Town’s Utility Rate Consultant, developed an initial Multi. Year Financial Plan for the Water and Sewer System that is detailed herein. ¡ The Multi-Year Financial Plan contemplates maintaining the Town’s existing strong Water and Sewer financial standing while also prudently accommodating needs associated with future growth. November 8, 2017 Town of Herndon, VA 1
Goals and Objectives § Develop a Multi-Year Financial Plan that maintains a Self Supporting Water and Sewer Utility Enterprise System (i. e. a system that is not reliant on support from the General Fund). § Limit the need to raise Water and Sewer User Rates while maintaining the financial strength and competitiveness of the Water and Sewer System. § Test the Multi-Year Financial Plan under a variety of growth assumptions. § Introduce Water and Sewer Financial Policies that will help maintain the financial strength and integrity of the Water and Sewer System in the future and maintain critical financial metrics at “Aa / Aaa” levels. November 8, 2017 Town of Herndon, VA 2
Initial Observations § The Town’s Water and Sewer System has historically been self supporting and has not relied on recent support from the General Fund. This is an important “Best Practice” that should be continued as it ensures that the users of the system pay for the system and the system is not a drain on the resources of the General Fund. § The Water and Sewer System has no outstanding Town issued debt. Several obligations are outstanding to Fairfax County and/or Fairfax Water for the Town’s portion of prior capital costs in their shared system (roughly $3. 2 million in aggregate). § The typical quarterly bill for a residential customer in Herndon is currently amongst the lowest in the region. § User rates have not been increased for roughly six years. § The Water and Sewer System currently has substantial aggregate cash reserves. This is a strength for the Town as it insulates the Town from growth related uncertainty and will be maintained in the multi-year planning. November 8, 2017 Town of Herndon, VA 3
Initial Observations (cont. ) § The Town expects to experience substantial and sustained growth in new Water and Sewer users as a result of the Silver Line extension, downtown development, and continued growth in the greater Washington D. C. /Northern Virginia region. § The exact timing and magnitude of this growth in unknown. As a result the multi-year planning should be “stress tested” at lower than expected growth levels. § Accommodating the new growth will require that the Town invests in additional capacity for both Water and Sewer in addition to the typical on-going costs of maintaining the existing system. It is the goal of the Town to have the cost of growth paid for by the new users that will benefit from the system (i. e. “growth pays for growth”). {Remainder of page intentionally left blank} November 8, 2017 Town of Herndon, VA 4
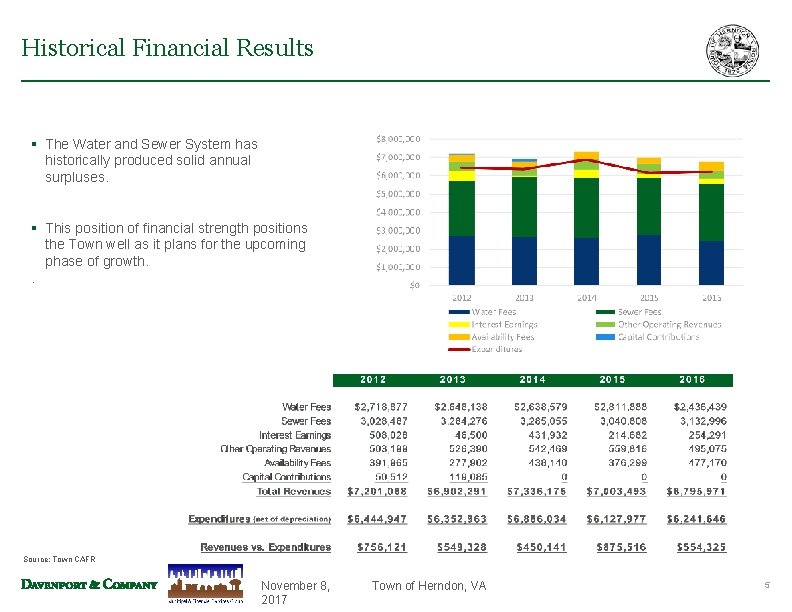
Historical Financial Results § The Water and Sewer System has historically produced solid annual surpluses. § This position of financial strength positions the Town well as it plans for the upcoming phase of growth. . Source: Town CAFR November 8, 2017 Town of Herndon, VA 5
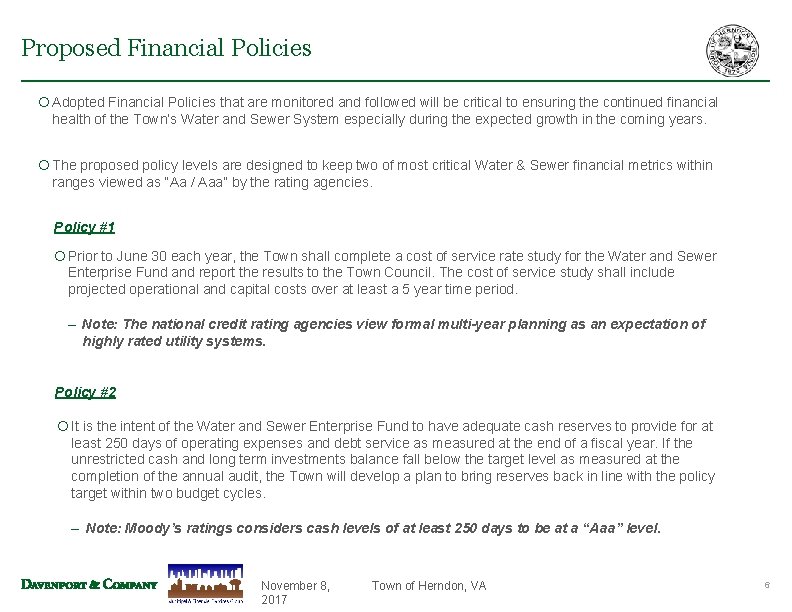
Proposed Financial Policies ¡ Adopted Financial Policies that are monitored and followed will be critical to ensuring the continued financial health of the Town’s Water and Sewer System especially during the expected growth in the coming years. ¡ The proposed policy levels are designed to keep two of most critical Water & Sewer financial metrics within ranges viewed as “Aa / Aaa” by the rating agencies. Policy #1 ¡ Prior to June 30 each year, the Town shall complete a cost of service rate study for the Water and Sewer Enterprise Fund and report the results to the Town Council. The cost of service study shall include projected operational and capital costs over at least a 5 year time period. – Note: The national credit rating agencies view formal multi-year planning as an expectation of highly rated utility systems. Policy #2 ¡ It is the intent of the Water and Sewer Enterprise Fund to have adequate cash reserves to provide for at least 250 days of operating expenses and debt service as measured at the end of a fiscal year. If the unrestricted cash and long term investments balance fall below the target level as measured at the completion of the annual audit, the Town will develop a plan to bring reserves back in line with the policy target within two budget cycles. – Note: Moody’s ratings considers cash levels of at least 250 days to be at a “Aaa” level. November 8, 2017 Town of Herndon, VA 6
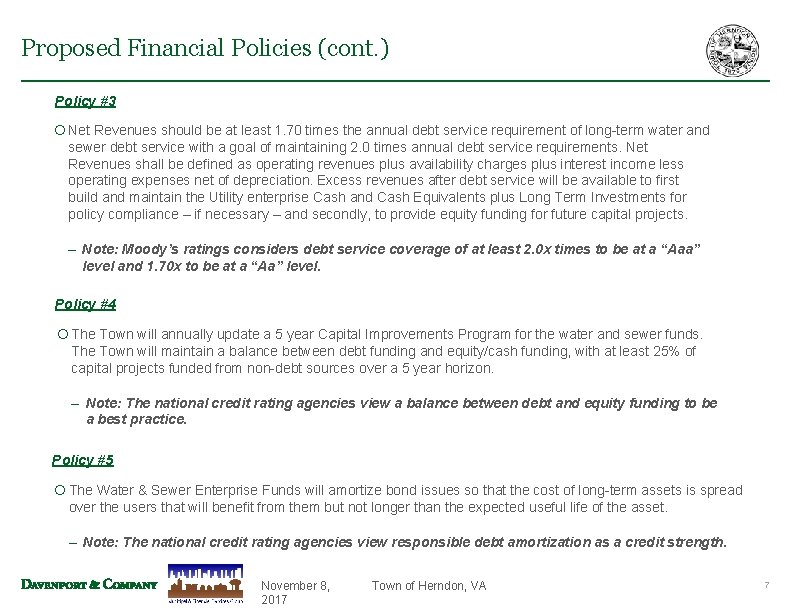
Proposed Financial Policies (cont. ) Policy #3 ¡ Net Revenues should be at least 1. 70 times the annual debt service requirement of long-term water and sewer debt service with a goal of maintaining 2. 0 times annual debt service requirements. Net Revenues shall be defined as operating revenues plus availability charges plus interest income less operating expenses net of depreciation. Excess revenues after debt service will be available to first build and maintain the Utility enterprise Cash and Cash Equivalents plus Long Term Investments for policy compliance – if necessary – and secondly, to provide equity funding for future capital projects. – Note: Moody’s ratings considers debt service coverage of at least 2. 0 x times to be at a “Aaa” level and 1. 70 x to be at a “Aa” level. Policy #4 ¡ The Town will annually update a 5 year Capital Improvements Program for the water and sewer funds. The Town will maintain a balance between debt funding and equity/cash funding, with at least 25% of capital projects funded from non-debt sources over a 5 year horizon. – Note: The national credit rating agencies view a balance between debt and equity funding to be a best practice. Policy #5 ¡ The Water & Sewer Enterprise Funds will amortize bond issues so that the cost of long-term assets is spread over the users that will benefit from them but not longer than the expected useful life of the asset. – Note: The national credit rating agencies view responsible debt amortization as a credit strength. November 8, 2017 Town of Herndon, VA 7
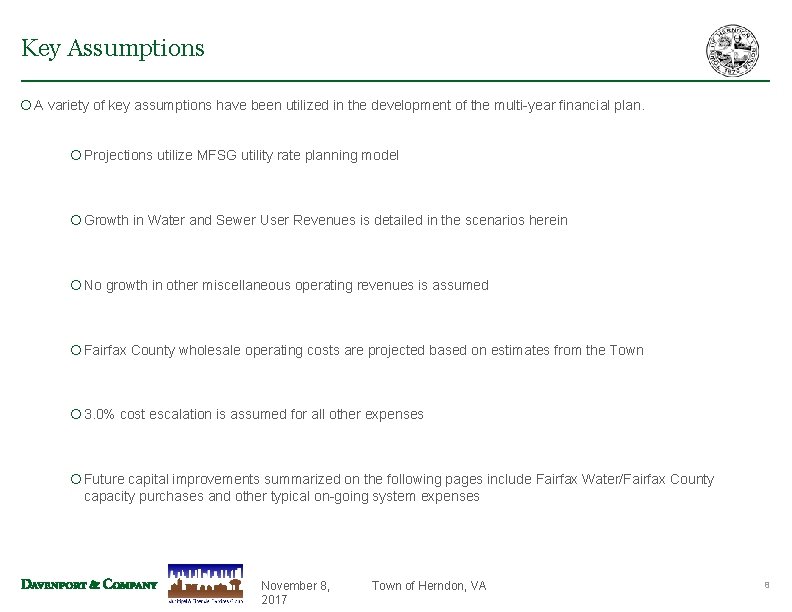
Key Assumptions ¡ A variety of key assumptions have been utilized in the development of the multi-year financial plan. ¡ Projections utilize MFSG utility rate planning model ¡ Growth in Water and Sewer User Revenues is detailed in the scenarios herein ¡ No growth in other miscellaneous operating revenues is assumed ¡ Fairfax County wholesale operating costs are projected based on estimates from the Town ¡ 3. 0% cost escalation is assumed for all other expenses ¡ Future capital improvements summarized on the following pages include Fairfax Water/Fairfax County capacity purchases and other typical on-going system expenses November 8, 2017 Town of Herndon, VA 8
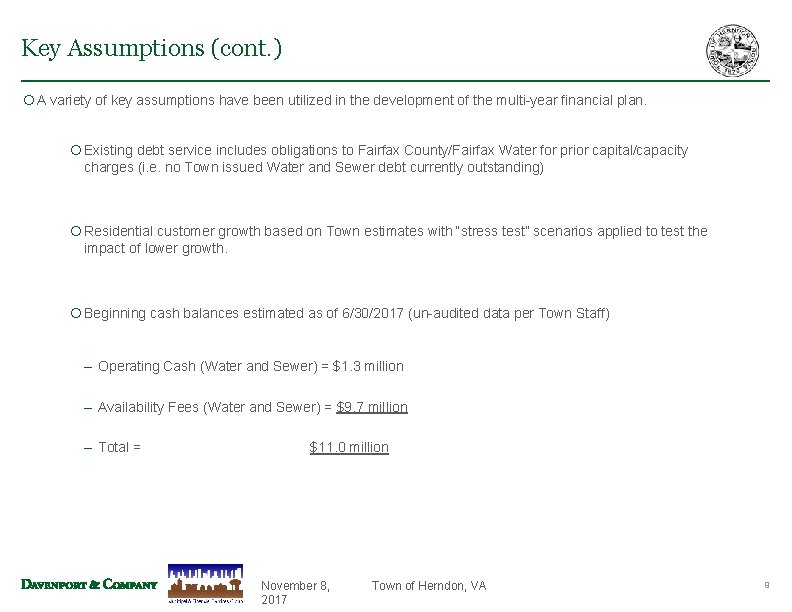
Key Assumptions (cont. ) ¡ A variety of key assumptions have been utilized in the development of the multi-year financial plan. ¡ Existing debt service includes obligations to Fairfax County/Fairfax Water for prior capital/capacity charges (i. e. no Town issued Water and Sewer debt currently outstanding) ¡ Residential customer growth based on Town estimates with “stress test” scenarios applied to test the impact of lower growth. ¡ Beginning cash balances estimated as of 6/30/2017 (un-audited data per Town Staff) – Operating Cash (Water and Sewer) = $1. 3 million – Availability Fees (Water and Sewer) = $9. 7 million – Total = $11. 0 million November 8, 2017 Town of Herndon, VA 9
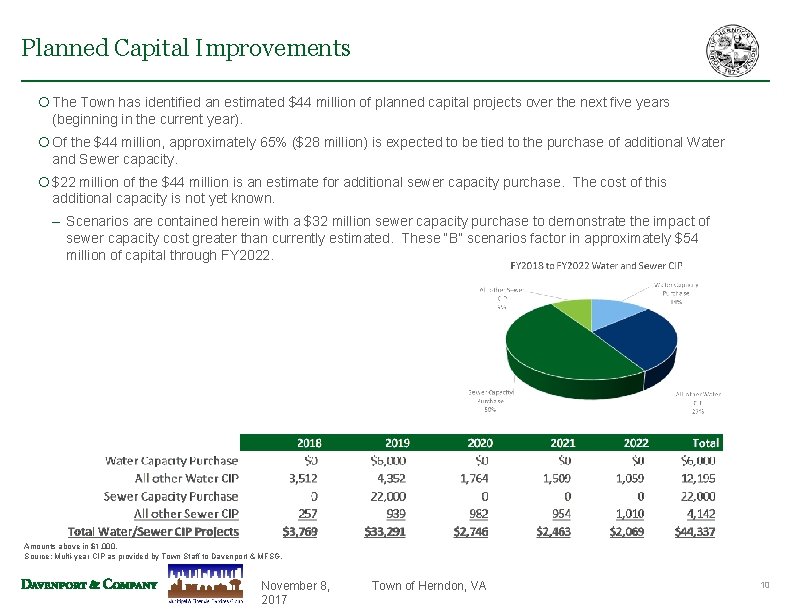
Planned Capital Improvements ¡ The Town has identified an estimated $44 million of planned capital projects over the next five years (beginning in the current year). ¡ Of the $44 million, approximately 65% ($28 million) is expected to be tied to the purchase of additional Water and Sewer capacity. ¡ $22 million of the $44 million is an estimate for additional sewer capacity purchase. The cost of this additional capacity is not yet known. – Scenarios are contained herein with a $32 million sewer capacity purchase to demonstrate the impact of sewer capacity cost greater than currently estimated. These “B” scenarios factor in approximately $54 million of capital through FY 2022. Amounts above in $1, 000. Source: Multi-year CIP as provided by Town Staff to Davenport & MFSG. November 8, 2017 Town of Herndon, VA 10
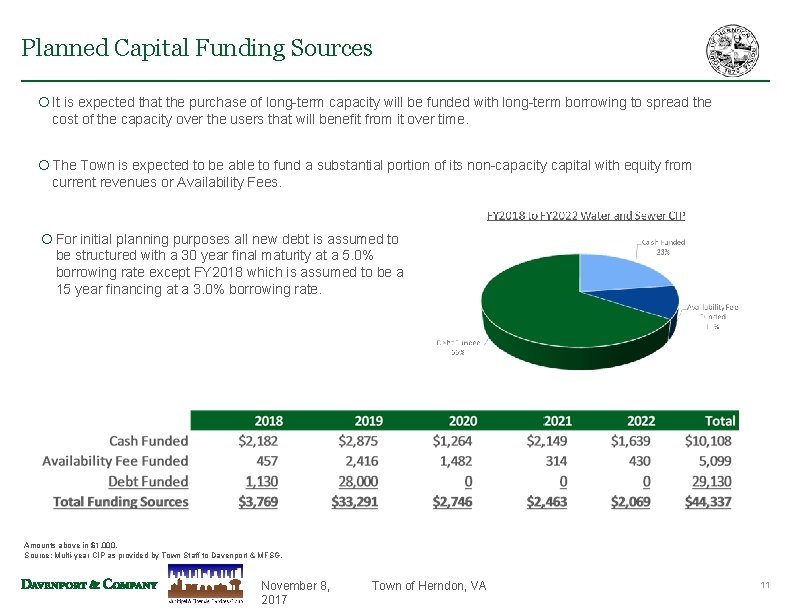
Planned Capital Funding Sources ¡ It is expected that the purchase of long-term capacity will be funded with long-term borrowing to spread the cost of the capacity over the users that will benefit from it over time. ¡ The Town is expected to be able to fund a substantial portion of its non-capacity capital with equity from current revenues or Availability Fees. ¡ For initial planning purposes all new debt is assumed to be structured with a 30 year final maturity at a 5. 0% borrowing rate except FY 2018 which is assumed to be a 15 year financing at a 3. 0% borrowing rate. Amounts above in $1, 000. Source: Multi-year CIP as provided by Town Staff to Davenport & MFSG. November 8, 2017 Town of Herndon, VA 11
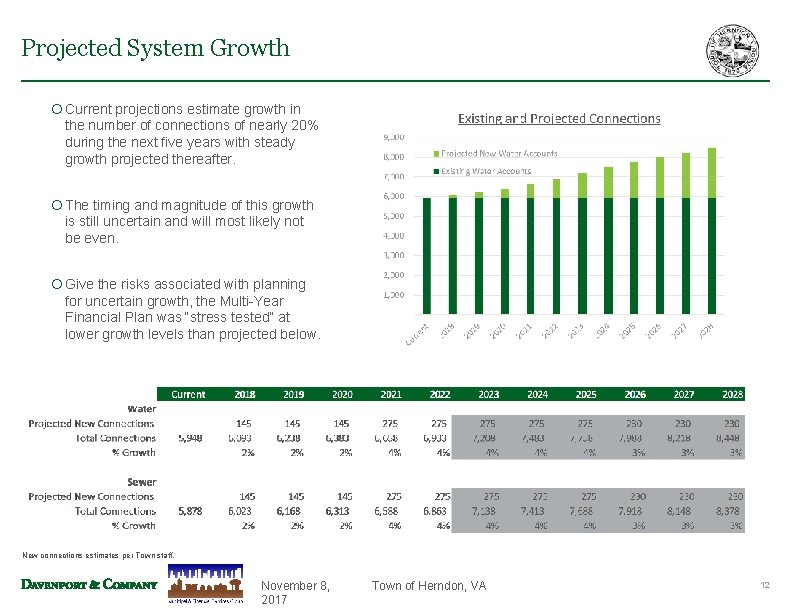
Projected System Growth ¡ Current projections estimate growth in the number of connections of nearly 20% during the next five years with steady growth projected thereafter. ¡ The timing and magnitude of this growth is still uncertain and will most likely not be even. ¡ Give the risks associated with planning for uncertain growth, the Multi-Year Financial Plan was “stress tested” at lower growth levels than projected below. New connections estimates per Town staff. November 8, 2017 Town of Herndon, VA 12
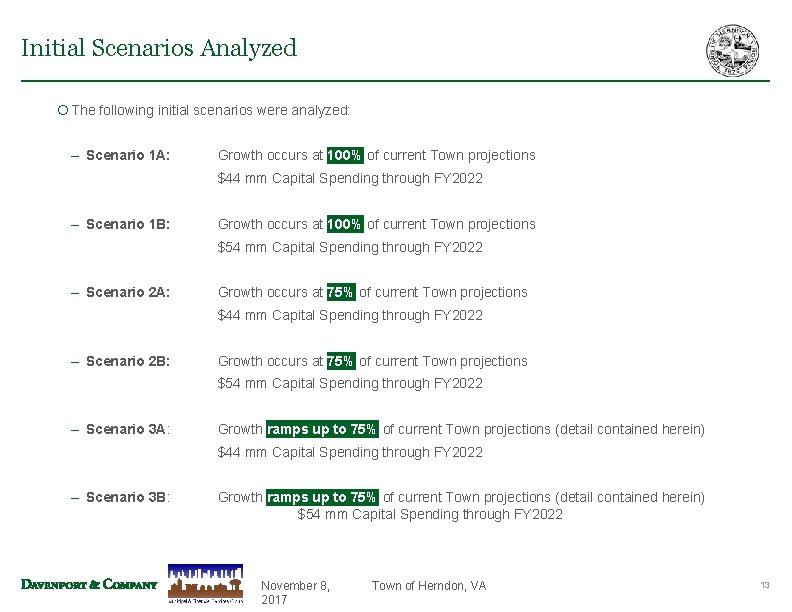
Initial Scenarios Analyzed ¡ The following initial scenarios were analyzed: – Scenario 1 A: Growth occurs at 100% of current Town projections $44 mm Capital Spending through FY 2022 – Scenario 1 B: Growth occurs at 100% of current Town projections $54 mm Capital Spending through FY 2022 – Scenario 2 A: Growth occurs at 75% of current Town projections $44 mm Capital Spending through FY 2022 – Scenario 2 B: Growth occurs at 75% of current Town projections $54 mm Capital Spending through FY 2022 – Scenario 3 A: Growth ramps up to 75% of current Town projections (detail contained herein) $44 mm Capital Spending through FY 2022 – Scenario 3 B: Growth ramps up to 75% of current Town projections (detail contained herein) $54 mm Capital Spending through FY 2022 November 8, 2017 Town of Herndon, VA 13
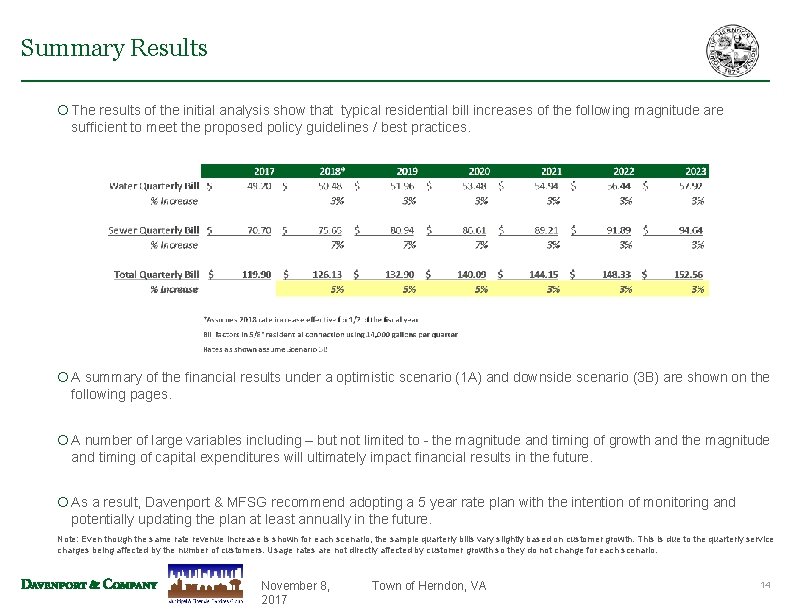
Summary Results ¡ The results of the initial analysis show that typical residential bill increases of the following magnitude are sufficient to meet the proposed policy guidelines / best practices. ¡ A summary of the financial results under a optimistic scenario (1 A) and downside scenario (3 B) are shown on the following pages. ¡ A number of large variables including – but not limited to - the magnitude and timing of growth and the magnitude and timing of capital expenditures will ultimately impact financial results in the future. ¡ As a result, Davenport & MFSG recommend adopting a 5 year rate plan with the intention of monitoring and potentially updating the plan at least annually in the future. Note: Even though the same rate revenue increase is shown for each scenario, the sample quarterly bills vary slightly based on customer growth. This is due to the quarterly service charges being affected by the number of customers. Usage rates are not directly affected by customer growth so they do not change for each scenario. November 8, 2017 Town of Herndon, VA 14
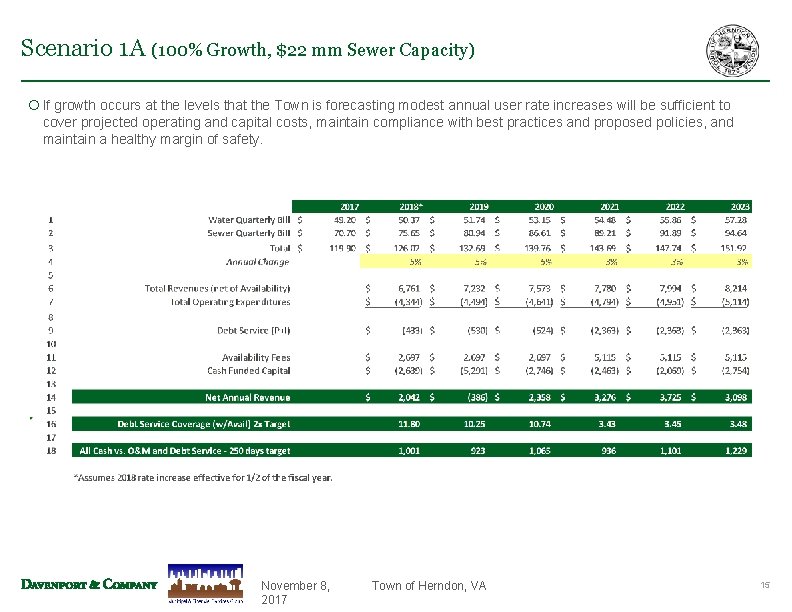
Scenario 1 A (100% Growth, $22 mm Sewer Capacity) ¡ If growth occurs at the levels that the Town is forecasting modest annual user rate increases will be sufficient to cover projected operating and capital costs, maintain compliance with best practices and proposed policies, and maintain a healthy margin of safety. November 8, 2017 Town of Herndon, VA 15
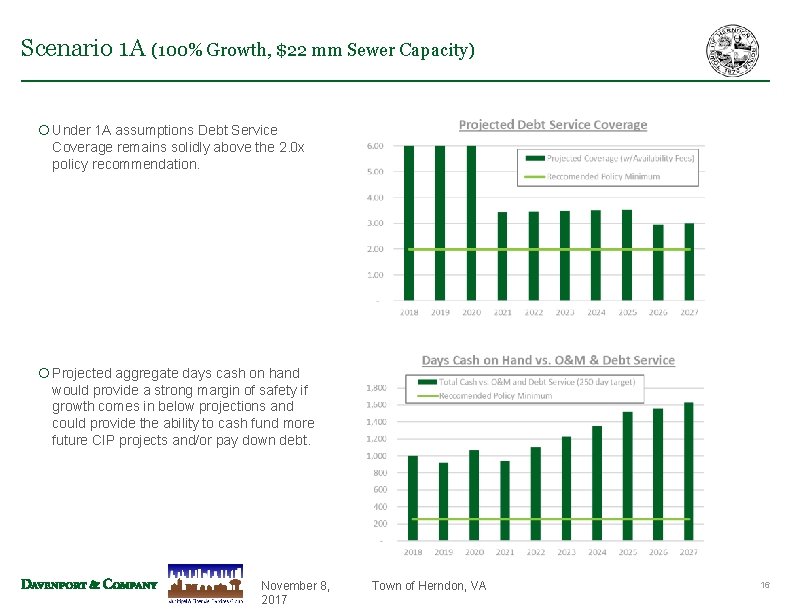
Scenario 1 A (100% Growth, $22 mm Sewer Capacity) ¡ Under 1 A assumptions Debt Service Coverage remains solidly above the 2. 0 x policy recommendation. ¡ Projected aggregate days cash on hand would provide a strong margin of safety if growth comes in below projections and could provide the ability to cash fund more future CIP projects and/or pay down debt. November 8, 2017 Town of Herndon, VA 16
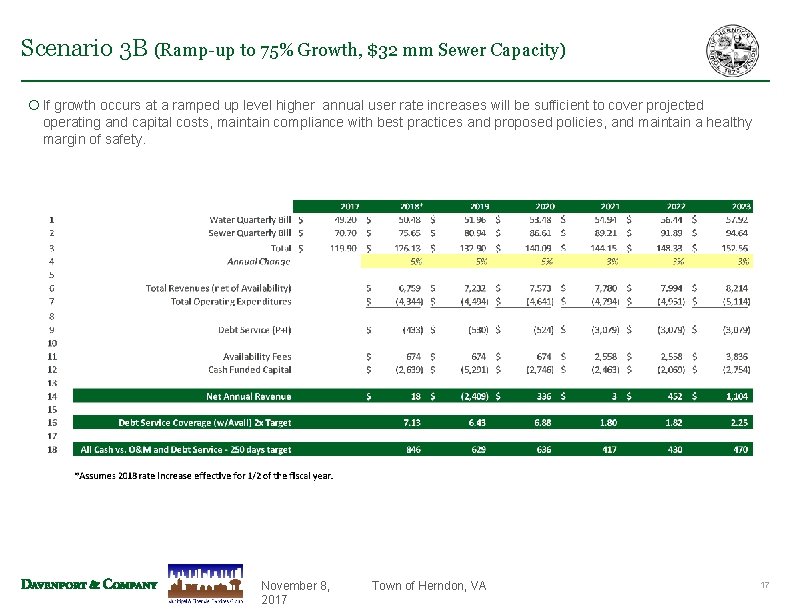
Scenario 3 B (Ramp-up to 75% Growth, $32 mm Sewer Capacity) ¡ If growth occurs at a ramped up level higher annual user rate increases will be sufficient to cover projected operating and capital costs, maintain compliance with best practices and proposed policies, and maintain a healthy margin of safety. November 8, 2017 Town of Herndon, VA 17
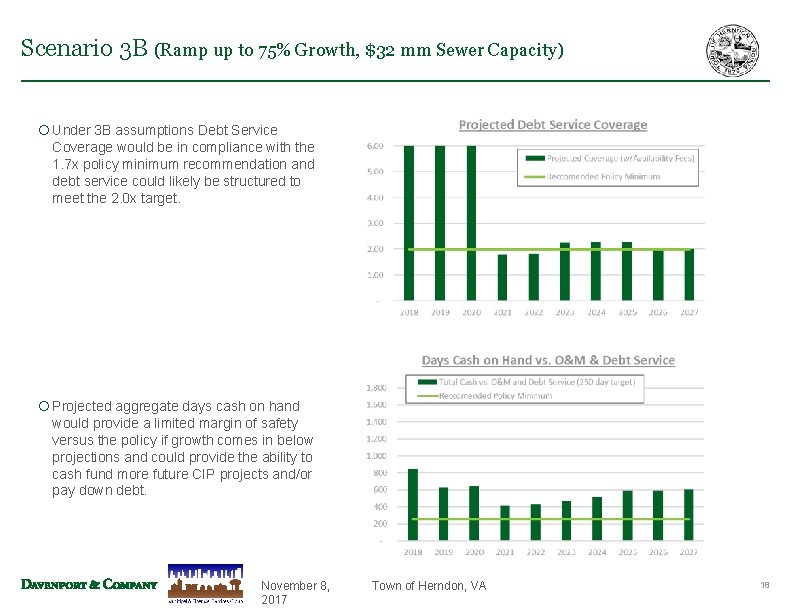
Scenario 3 B (Ramp up to 75% Growth, $32 mm Sewer Capacity) ¡ Under 3 B assumptions Debt Service Coverage would be in compliance with the 1. 7 x policy minimum recommendation and debt service could likely be structured to meet the 2. 0 x target. ¡ Projected aggregate days cash on hand would provide a limited margin of safety versus the policy if growth comes in below projections and could provide the ability to cash fund more future CIP projects and/or pay down debt. November 8, 2017 Town of Herndon, VA 18
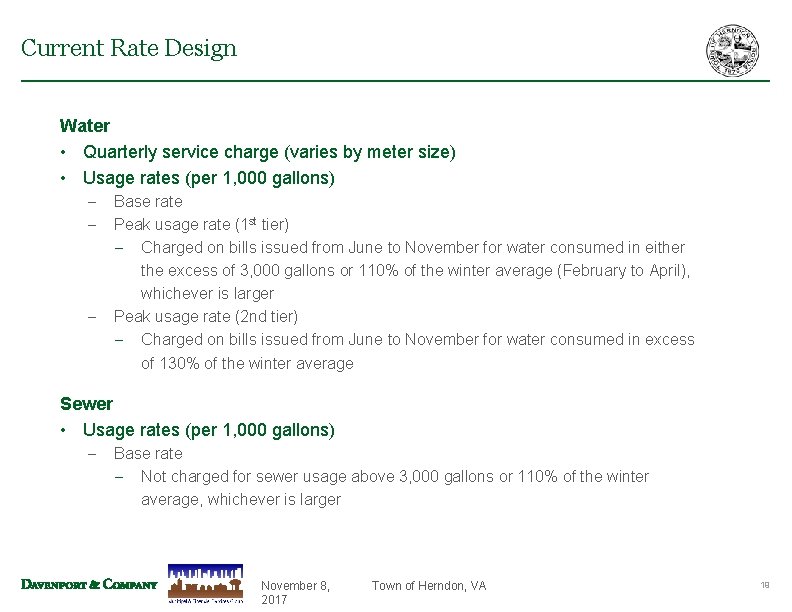
Current Rate Design Water • Quarterly service charge (varies by meter size) • Usage rates (per 1, 000 gallons) Base rate Peak usage rate (1 st tier) Charged on bills issued from June to November for water consumed in either the excess of 3, 000 gallons or 110% of the winter average (February to April), whichever is larger Peak usage rate (2 nd tier) Charged on bills issued from June to November for water consumed in excess of 130% of the winter average Sewer • Usage rates (per 1, 000 gallons) Base rate Not charged for sewer usage above 3, 000 gallons or 110% of the winter average, whichever is larger November 8, 2017 Town of Herndon, VA 19
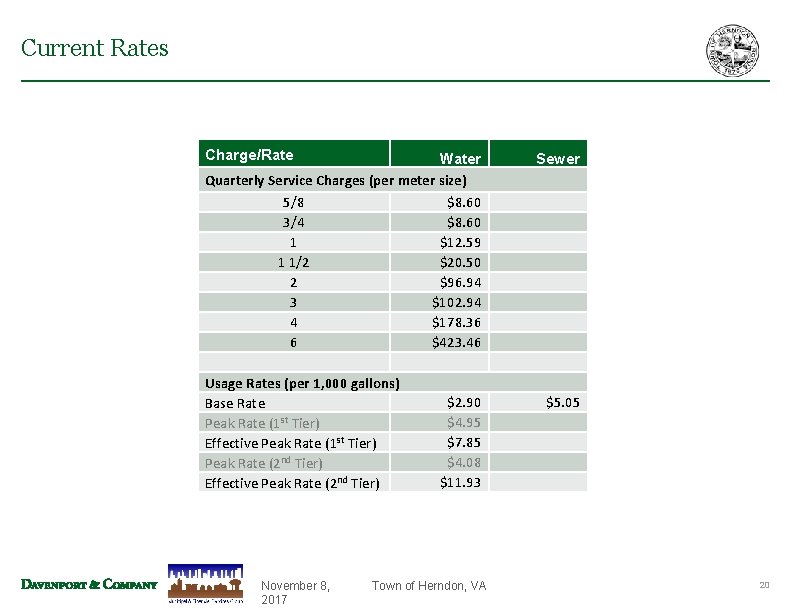
Current Rates Charge/Rate Water Quarterly Service Charges (per meter size) 5/8 $8. 60 3/4 $8. 60 1 $12. 59 1 1/2 $20. 50 2 $96. 94 3 $102. 94 4 $178. 36 6 $423. 46 Usage Rates (per 1, 000 gallons) Base Rate Peak Rate (1 st Tier) Effective Peak Rate (1 st Tier) Peak Rate (2 nd Tier) Effective Peak Rate (2 nd Tier) November 8, 2017 $2. 90 $4. 95 $7. 85 $4. 08 $11. 93 Town of Herndon, VA Sewer $5. 05 20
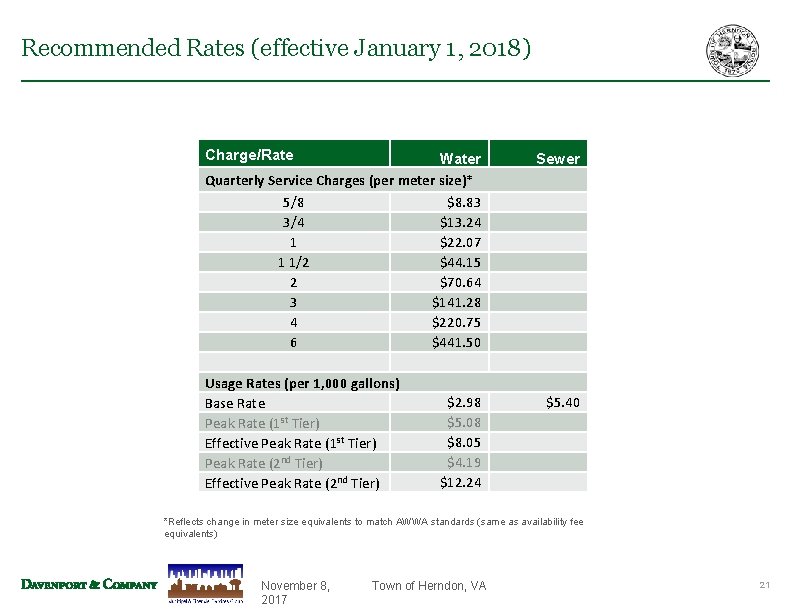
Recommended Rates (effective January 1, 2018) Charge/Rate Water Quarterly Service Charges (per meter size)* 5/8 $8. 83 3/4 $13. 24 1 $22. 07 1 1/2 $44. 15 2 $70. 64 3 $141. 28 4 $220. 75 6 $441. 50 Usage Rates (per 1, 000 gallons) Base Rate Peak Rate (1 st Tier) Effective Peak Rate (1 st Tier) Peak Rate (2 nd Tier) Effective Peak Rate (2 nd Tier) $2. 98 $5. 08 $8. 05 $4. 19 $12. 24 Sewer $5. 40 *Reflects change in meter size equivalents to match AWWA standards (same as availability fee equivalents) November 8, 2017 Town of Herndon, VA 21
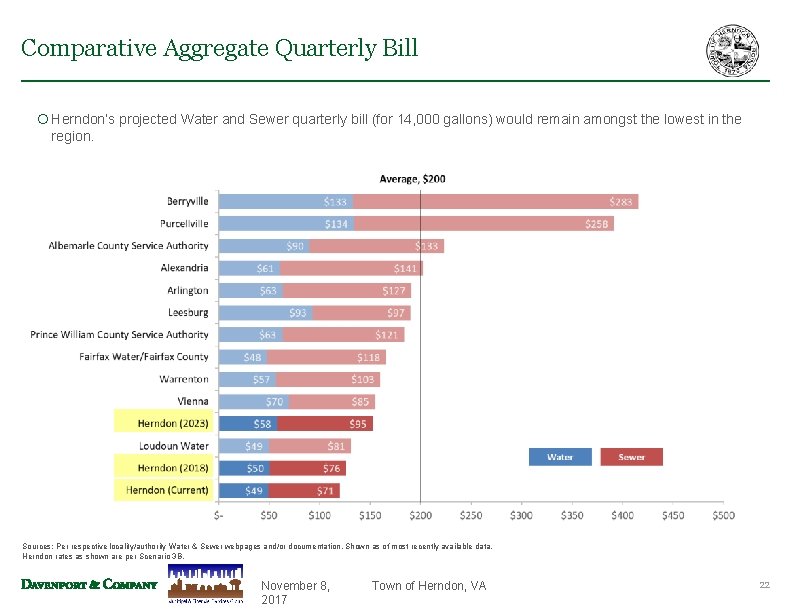
Comparative Aggregate Quarterly Bill ¡ Herndon’s projected Water and Sewer quarterly bill (for 14, 000 gallons) would remain amongst the lowest in the region. Sources: Per respective locality/authority Water & Sewer webpages and/or documentation. Shown as of most recently available data. Herndon rates as shown are per Scenario 3 B. November 8, 2017 Town of Herndon, VA 22
Municipal Advisor Disclaimer The enclosed information relates to an existing or potential municipal advisor engagement. The U. S. Securities and Exchange Commission (the “SEC”) has clarified that a broker, dealer or municipal securities dealer engaging in municipal advisory activities outside the scope of underwriting a particular issuance of municipal securities should be subject to municipal advisor registration. Davenport & Company LLC (“Davenport”) has registered as a municipal advisor with the SEC. As a registered municipal advisor Davenport may provide advice to a municipal entity or obligated person. An obligated person is an entity other than a municipal entity, such as a not for profit corporation, that has commenced an application or negotiation with an entity to issue municipal securities on its behalf and for which it will provide support. If and when an issuer engages Davenport to provide financial advisory or consultant services with respect to the issuance of municipal securities, Davenport is obligated to evidence such a financial advisory relationship with a written agreement. When acting as a registered municipal advisor Davenport is a fiduciary required by federal law to act in the best interest of a municipal entity without regard to its own financial or other interests. Davenport is not a fiduciary when it acts as a registered investment advisor, when advising an obligated person, or when acting as an underwriter, though it is required to deal fairly with such persons, This material was prepared by public finance, or other non-research personnel of Davenport. This material was not produced by a research analyst, although it may refer to a Davenport research analyst or research report. Unless otherwise indicated, these views (if any) are the author’s and may differ from those of the Davenport fixed income or research department or others in the firm. Davenport may perform or seek to perform financial advisory services for the issuers of the securities and instruments mentioned herein. This material has been prepared for information purposes only and is not a solicitation of any offer to buy or sell any security/instrument or to participate in any trading strategy. Any such offer would be made only after a prospective participant had completed its own independent investigation of the securities, instruments or transactions and received all information it required to make its own investment decision, including, where applicable, a review of any offering circular or memorandum describing such security or instrument. That information would contain material information not contained herein and to which prospective participants are referred. This material is based on public information as of the specified date, and may be stale thereafter. We have no obligation to tell you when information herein may change. We make no representation or warranty with respect to the completeness of this material. Davenport has no obligation to continue to publish information on the securities/instruments mentioned herein. Recipients are required to comply with any legal or contractual restrictions on their purchase, holding, sale, exercise of rights or performance of obligations under any securities/instruments transaction. The securities/instruments discussed in this material may not be suitable for all investors or issuers. Recipients should seek independent financial advice prior to making any investment decision based on this material. This material does not provide individually tailored investment advice or offer tax, regulatory, accounting or legal advice. Prior to entering into any proposed transaction, recipients should determine, in consultation with their own investment, legal, tax, regulatory and accounting advisors, the economic risks and merits, as well as the legal, tax, regulatory and accounting characteristics and consequences, of the transaction. You should consider this material as only a single factor in making an investment decision. The value of and income from investments and the cost of borrowing may vary because of changes in interest rates, foreign exchange rates, default rates, prepayment rates, securities/instruments prices, market indexes, operational or financial conditions or companies or other factors. There may be time limitations on the exercise of options or other rights in securities/instruments transactions. Past performance is not necessarily a guide to future performance and estimates of future performance are based on assumptions that may not be realized. Actual events may differ from those assumed and changes to any assumptions may have a material impact on any projections or estimates. Other events not taken into account may occur and may significantly affect the projections or estimates. Certain assumptions may have been made for modeling purposes or to simplify the presentation and/or calculation of any projections or estimates, and Davenport does not represent that any such assumptions will reflect actual future events. Accordingly, there can be no assurance that estimated returns or projections will be realized or that actual returns or performance results will not materially differ from those estimated herein. This material may not be sold or redistributed without the prior written consent of Davenport. 01. 13. 14 JB | GM | KL | DR November 8, 2017 Town of Herndon, VA 23