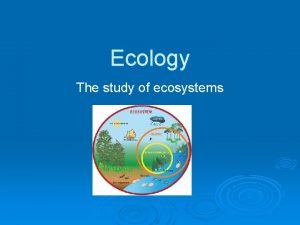
Ecology of Populations and Communities Ecology Level of


- Slides: 48

Ecology of Populations and Communities

Ecology: Level of Interaction Population – A group of interacting individuals of the same species living in a defined area, at a given time Community – Consists of two or more populations of different species living in the same area, at a given time

Ecology: Level of Interaction Ecosystem – Consists of a community of living organisms interacting with the physical environment Biosphere – Consists of all the Earth’s ecosystems, atmosphere & is the portion of the Earth that contains all living organisms

What Limits Where A Species Lives? Limits to global distribution • Physical factors • Interactions with other species • Geographical barriers

What Limits Where A Species Lives? Physical factors determine where a species lives • The region may lack enough sunlight, water, the right temperature, and/or chemicals to sustain life for a particular species

What Limits Where A Species Lives? Interactions with other species determine where a species lives • New species may be blocked from entering an area by the established species • The established species may monopolize food or may cause illnesses/extinction of the new species

What Limits Where A Species Lives? Geographical barriers determine where a species lives • Seas, deserts, and mountain ranges may block a species that cannot swim, crawl, or fly – New species were/are brought from Europe/Asia to the USA mainly by human beings; the ocean is too wide for a species to arrive on its own

Geographical Barriers Europe Canada U. S. Mexico 1890 1918 1926 1949 1958 Africa 1932 The Atlantic Ocean acted as a barrier between the Americas & Europe. The European Starling had to cross the ocean to spread throughout the USA.

What Limits Where a Species Lives? Thousands of metric tons 25 20 Yellow flounder commercial landings 100 15 Spiny 80 dogfish 60 and skates 40 20 10 5 1962 140 120 70 80 Year 90 96 Biomass (kg/tow) The yellowtail flounder commercial catch: A reflection of population density

What Factors Limit Population Size? • Changes result when individuals enter or exit a population • Also the population changes when individuals are born or die

Survivorship curve: plots the proportion of a population that survives to a certain age Humans follow a late- loss survivorship curve Yellow flounder (a fish) follows an early-loss survivorship curve

What Factors Limit Population Size? • Fertility and age • Fertility curves- It is a graph that plots reproduction rate vs. age of females. • Using a fertility curve and a population’s age structure, population growth or decline can be predicted • How populations grow • Models for population growth are typically based upon death and birth rates Biotic potential: Innate capacity to reproduce under ideal conditions

Factors affecting the shape of the J-shaped curve Number of individuals in population 1. The reproductive rate per individual 2. The initial population size 1000 800 600 400 200 0 Increasing time The population growth curve Mice living under ideal conditions will grow exponentially Forever, however, ideal conditions rarely happen. Certain bacteria also exhibit a J-shaped growth curve

What Factors Limit Population Size? • Limited resources and growth • S-shaped curve –A new population starts out under “ideal conditions” following a Jshaped curve –When the population is large and resources begin to decline, the growth pattern follows an S-shaped curve

Millions of sheep S-shaped Curve Carrying capacity (K) 2 1. 6 million sheep Overshoot 1. 5 1 0. 5 0 1820 1840 1860 1880 1900 1920 Year An Example of a Real Population Curve

What Factors Limit Population Size? • Limited resources and growth • Carrying capacity (K) – The maximum number of individuals a population can support in a given environment

Population crashes • A boom in population followed by crash • A reindeer population introduced to an island near Alaska started with a Jshaped curve • However, the population outgrew resources and crashed In the figure, population boom = 1910 -1935; crash = 1935 -1950

What Factors Limit Population Size? • Environment and growth • Population density can regulate growth • A dense community may carry and transmit more disease • A harsh winter can limit numbers regardless of density

What Factors Limit Population Size? • Extrinsic population regulators: Factors which originate outside the population – Food supplies – Natural enemies – Disease-causing organisms – Weather – Shelter – Pollution – Habitat loss

What Factors Limit Population Size? • Intrinsic population regulators: Factors which originate within an organism’s anatomy, physiology, or behavior – It can result in competition which leads to depletion of resources & ultimately the population – Ex: Kangaroos and koalas absorb their developing embryos when resources are depleted

Strategies for survival • Life history strategy – The way an organism allocates energy to reproduction and day-to-day survival § Ex 1: Weeds – energy investment is in rapid reproduction with many offspring § Ex 2: Large animals – energy investment is in slower reproduction, larger bodies, and few offspring

Trends in Human Population Growth 1. Hunting and gathering phase – Life history strategy - Slow development, long lives, large bodies, few offspring, extended parental care, large brains

Trends in Human Population Growth 2. Agricultural revolution – Agricultural practice increased the carrying capacity for humans – Resulting in population growth

Trends in Human Population Growth 3. Industrial revolution – Transformed an agricultural society into one of crowded cities with people working in factories – The beginning of exponential growth that continues today ………. .

Growth Curve for Human Population 6 4 3 2 Billions of people 5 1 Graph showing explosive growth of human population 500, 000 years Hunting and gathering phase 8000 7000 6000 5000 4000 3000 2000 1000 B. C. A. D. 1000 2000 Agricultural phase Industrial phase

Trends in Human Population Growth Change in human population size Birth and death rates –Can increase and decrease independently Demographic transition –Change from high birth & death rates to low birth & death rates

Figureanded, the 1 Before 1775, the s exp 2 As industry eclined but the 50 Birth rate 40 r 1000 Number pe population a birth rate w as ow high, but s ate. As the death r growth a result the w rate was lo death rate d not, leading id d te ra th bir wth rate and ro g h ig h a to tion increase rapid popula 30 20 Death rate art y the last p B 3 of the 20 th e century, th had death rate to continued had fall, but so te. the birth ra , the As a result growth rate was low again 4 from high e g n a h c e Th rates to 10 birth and death rates is the nd de low birth a n hic transitio demograp 2000 1800 1900 Year 1. High Birth Rate & High Death Rate = Low Population Growth 2. High Birth Rate & Low Death Rate = High Population Growth 3. Low Birth Rate & Low Death Rate = Low Population Growth 4. Demographic Transition

• Age structure • The number of individuals in each age group reflect a group’s growth rate

Growth & Age Structure Models (a) Sweden 1900 (b) Sweden 1977 (c) Sweden 2050 100– 104 90– 94 80– 84 Postreproductive Reproductive Prereproductive 70– 74 60– 64 50– 54 40– 44 30– 34 20– 24 10– 14 0– 4 Age group 200 0 200 Population size (in thousands) Postreproductive Reproductive Prereproductive (d) Uganda 2002 100– 104 90– 94 80– 84 70– 74 60– 64 50– 54 40– 44 30– 34 20– 24 10– 14 0– 4 Age group 3 2 1 0 1 2 (e) Uganda 2050 3 6 5 4 3 Population size (in millions) 2 1 0 1 2 3 4 5 6

Where Do Organisms Live? • Habitat • Where the organism lives; its physical home – Open-water habitat – Forest habitat • Niche • Functional role in a community • What is the organism’s job?

Where Do Organisms Live? • Limits to niches • Fundamental niche – Maximum potential niche which an organism can occupy, in the absence of any competitors • Realized niche – That part of the fundamental niche that an organism actually occupies

Why would the warbler in this figure be said to be in its fundamental niche? Height in tree July Dis tan ce June fro m tru nk 1 2 ing t s 3 f ne o ek 1 e W 3 4 2 4

Why would the warbler in this figure be said to be in its realized niche? Cape May warbler Baybreasted warbler Height in tree Myrtle warbler July Dis tan ce ing st f ne June fro m tru nk 1 o k e 1 We 2 3 4

How Species Interact • Competition • Interspecific competition –Competition between species for the same limited resources –This will affect one or the other’s survival or reproduction

How Species Interact Competition can result in : • Competitive exclusion –When one species excludes another species through competition • Coexisting –When two species can coexist – Often limits the population size in both interacting species

How Species Interact • Predation • Is usually beneficial for one species and harmful for the other • Predators seek prey to survive –Ants may eat plants to survive, but will ultimately injure the plant –Lions hunt zebra to survive, but ultimately kill the zebra

How Species Interact Coevolution of predator and prey • The interactions between a predator and prey that lead to adaptations for better ways of catching prey (for the predator) and escaping predators (for the prey) • Ways to escape • Camouflage • Chemical warfare • Mimicry

How Species Interact? • Camouflage – organism blends into the environment • Chemical warfare – organism produces an undesirable substance to discourage prey • Mimicry – a species resembles another species for protection

How Species Interact • Parasitism (+, -) • One organism benefits at the expense of another organism • Usually the parasite just saps the strength of the host rather than kill them. Can you think why? ? – Ex: Tapeworms/roundworms inside human intestines

How Species Interact • Commensalism (+, o) • One species benefits, but the other is not harmed – Birds that nest in trees – Algae growing on a turtle’s shell

How Species Interact • Mutualism (+, +) • Both species benefit from interaction • Yucca moth and yucca plant – The moth lays its eggs in the ovary at the base of the yucca flower • The moth uses the plant for food and reproduction – The moth then pollinates the flower • The plant needs the moth for pollination

Organization of Communities • Primary succession: Formation of a plant community in an unpopulated and bare area (after the lava of a volcano has cooled down, small plants begin to colonize the area) • Secondary succession: re-growth of a plant community at the site of a natural disaster (forest fire, flood, agricultural field left fallow).

Organization of Communities • Community and change • Climax communities are the culmination of all the change that has been occurring • In climax communities, all species are fairly stable, but still changing

Organization of Communities • Species richness • The total number of species in a community • Species abundance • The total number of individuals of a species

Organization of Communities Species diversity on the Planet • Latitude and isolation favor species richness • Warm tropics have greater species richness than do northern areas due to stable & favorable environmental conditions • Isolated areas decrease species richness

Organization of Communities Species diversity • Influences on species richness – Resources – Competition – Predation

Organization of Communities Species diversity and stability • Diverse-stability hypothesis – Diverse communities with a variety of traits are likely to survive environmental disturbances, and are hence more stable. –See External Resource on diversity of plants

Organization of Communities • Future of species richness • Increasing numbers of people on the planet are harming the biological communities • Entire ecosystems are threatened
 Steps of secondary succession
 Ecosystem level of organization
 Community level ecology
 Stabilizing selection human birth weight
 Evolution of populations section 16-1 genes and variation
 Ringe til peru
 Chapter 21 vulnerability and vulnerable populations
 Importance of confidence interval
 What is the interpretation of a 96 confidence level
 Confidence level and significance level
 Level 0 dfd
 Using statistical measures to compare populations
 Territoires populations et développement quels défis
 A biologist discovers two populations of wolf spiders
 Punnett square limitations
 Lesson 1 populations answer key
 Section 19-1 understanding populations answer key
 Chapter 16 evolution of populations vocabulary review
 Individuals don't evolve populations do
 Populations biology definition
 Section 5-1 how populations grow answer key
 Kar 5
Kar 5 Chapter 13 how populations evolve test
 Chapter 17 evolution of populations answer key
 5-1 how populations grow
 5-1 how populations grow
 Chapter 23: the evolution of populations
 Chapter 16 evolution of populations
 Evolution of populations section 11 review
 Chapter 10 comparing two populations or groups crossword
 Career development of diverse populations
 Chapter 5 lesson 1 how populations grow
 Chapter 8 understanding populations
 Complex patient populations
 Parasitism
 Chapter 23 the evolution of populations
 Dynamique des populations
 Chapter 13 how populations evolve
 99image
 Genetic drift in small populations
 Genetic drift
 Gene flow vs genetic drift
 Chapter 10 comparing two populations or groups
 Smallest unit of evolution
 5-1 how populations grow
 Hroc target
 Chapter 4 ecosystems and communities
 Communities culture and heritage
 Food chain virtual lab

