Computer Architecture A Quantitative Approach Sixth Edition Chapter
- Slides: 44
Computer Architecture A Quantitative Approach, Sixth Edition Chapter 1 Fundamentals of Quantitative Design and Analysis Copyright © 2019, Elsevier Inc. All rights reserved. 1
n Performance improvements: n Improvements in semiconductor technology n n Feature size, clock speed Improvements in computer architectures n n n Introduction Computer Technology Enabled by HLL compilers, UNIX Lead to RISC architectures but X 86 is CISC Together have enabled: n n Lightweight computers Productivity-based managed/interpreted programming languages Copyright © 2019, Elsevier Inc. All rights reserved. 2
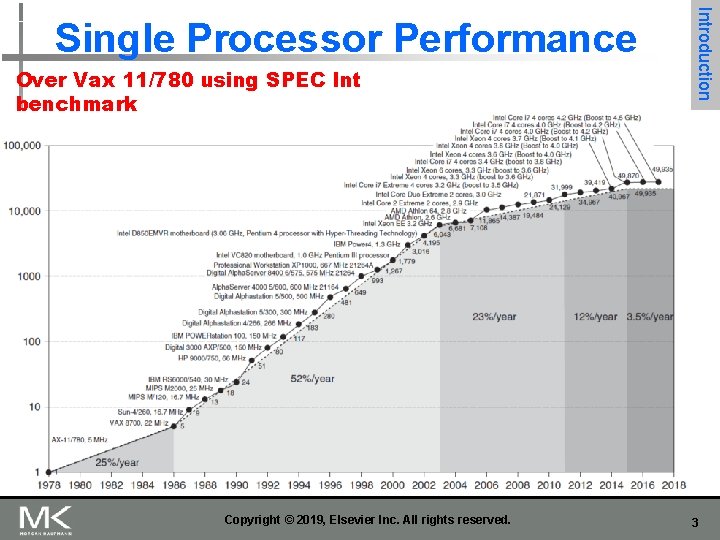
Over Vax 11/780 using SPEC Int benchmark Copyright © 2019, Elsevier Inc. All rights reserved. Introduction Single Processor Performance 3
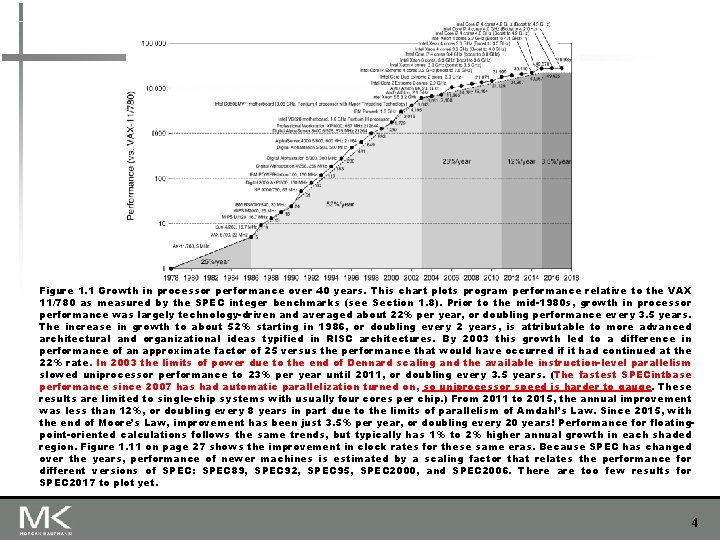
Figure 1. 1 Growth in processor performance over 40 years. This chart plots program performance relative to the VAX 11/780 as measured by the SPEC integer benchmarks (see Section 1. 8). Prior to the mid-1980 s, growth in processor performance was largely technology-driven and averaged about 22% per year, or doubling performance every 3. 5 years. The increase in growth to about 52% starting in 1986, or doubling every 2 years, is attributable to more advanced architectural and organizational ideas typified in RISC architectures. By 2003 this growth led to a difference in performance of an approximate factor of 25 versus the performance that would have occurred if it had continued at the 22% rate. In 2003 the limits of power due to the end of Dennard scaling and the available instruction-level parallelism slowed uniprocessor performance to 23% per year until 2011, or doubling every 3. 5 years. (The fastest SPECintbase performance since 2007 has had automatic parallelization turned on, so uniprocessor speed is harder to gauge. These results are limited to single-chip systems with usually four cores per chip. ) From 2011 to 2015, the annual improvement was less than 12%, or doubling every 8 years in part due to the limits of parallelism of Amdahl’s Law. Since 2015, with the end of Moore’s Law, improvement has been just 3. 5% per year, or doubling every 20 years! Performance for floatingpoint-oriented calculations follows the same trends, but typically has 1% to 2% higher annual growth in each shaded region. Figure 1. 11 on page 27 shows the improvement in clock rates for these same eras. Because SPEC has changed over the years, performance of newer machines is estimated by a scaling factor that relates the performance for different versions of SPEC: SPEC 89, SPEC 92, SPEC 95, SPEC 2000, and SPEC 2006. There are too few results for SPEC 2017 to plot yet. 4
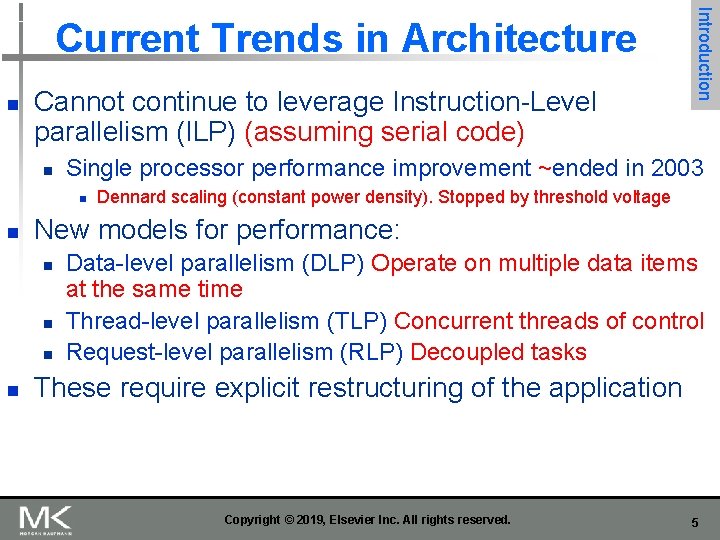
n Cannot continue to leverage Instruction-Level parallelism (ILP) (assuming serial code) n Single processor performance improvement ~ended in 2003 n n Dennard scaling (constant power density). Stopped by threshold voltage New models for performance: n n Introduction Current Trends in Architecture Data-level parallelism (DLP) Operate on multiple data items at the same time Thread-level parallelism (TLP) Concurrent threads of control Request-level parallelism (RLP) Decoupled tasks These require explicit restructuring of the application Copyright © 2019, Elsevier Inc. All rights reserved. 5
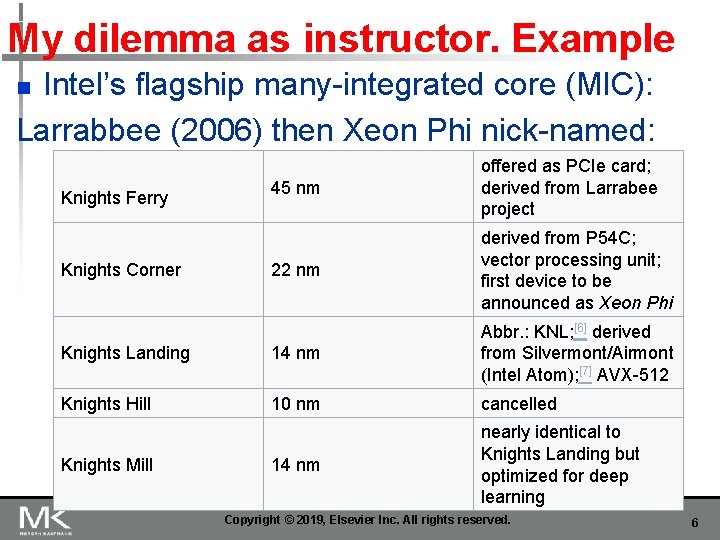
My dilemma as instructor. Example Intel’s flagship many-integrated core (MIC): Larrabbee (2006) then Xeon Phi nick-named: n 45 nm offered as PCIe card; derived from Larrabee project 22 nm derived from P 54 C; vector processing unit; first device to be announced as Xeon Phi Knights Landing 14 nm Abbr. : KNL; [6] derived from Silvermont/Airmont (Intel Atom); [7] AVX-512 Knights Hill 10 nm cancelled 14 nm nearly identical to Knights Landing but optimized for deep learning Knights Ferry Knights Corner Knights Mill Copyright © 2019, Elsevier Inc. All rights reserved. 6
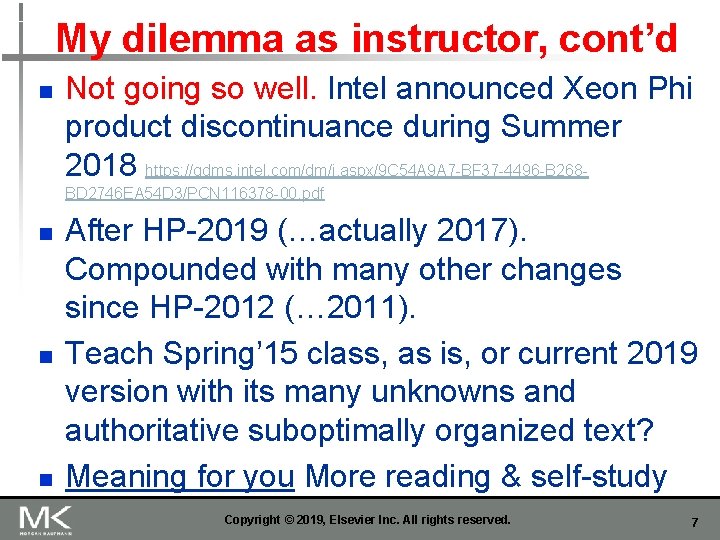
My dilemma as instructor, cont’d n Not going so well. Intel announced Xeon Phi product discontinuance during Summer 2018 https: //qdms. intel. com/dm/i. aspx/9 C 54 A 9 A 7 -BF 37 -4496 -B 268 BD 2746 EA 54 D 3/PCN 116378 -00. pdf n n n After HP-2019 (…actually 2017). Compounded with many other changes since HP-2012 (… 2011). Teach Spring’ 15 class, as is, or current 2019 version with its many unknowns and authoritative suboptimally organized text? Meaning for you More reading & self-study Copyright © 2019, Elsevier Inc. All rights reserved. 7
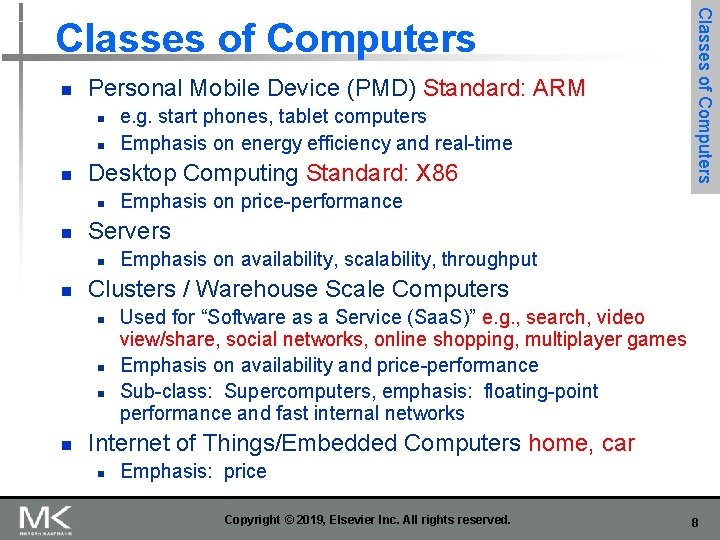
n Personal Mobile Device (PMD) Standard: ARM n n n Desktop Computing Standard: X 86 n n Emphasis on availability, scalability, throughput Clusters / Warehouse Scale Computers n n Emphasis on price-performance Servers n n e. g. start phones, tablet computers Emphasis on energy efficiency and real-time Classes of Computers Used for “Software as a Service (Saa. S)” e. g. , search, video view/share, social networks, online shopping, multiplayer games Emphasis on availability and price-performance Sub-class: Supercomputers, emphasis: floating-point performance and fast internal networks Internet of Things/Embedded Computers home, car n Emphasis: price Copyright © 2019, Elsevier Inc. All rights reserved. 8
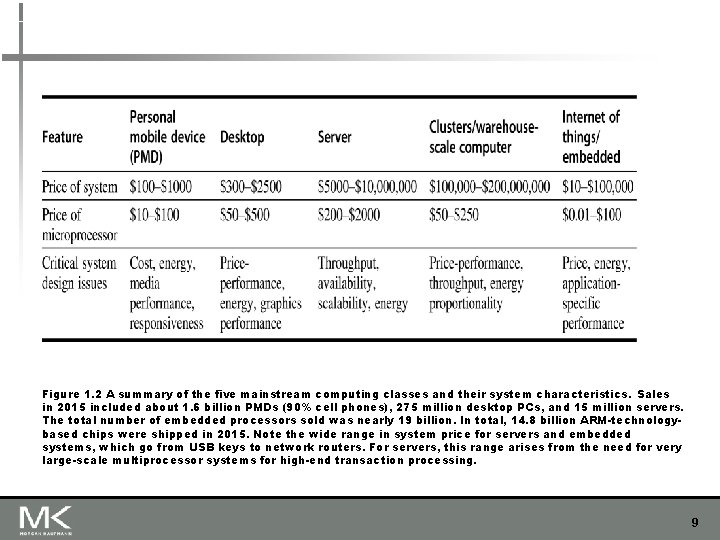
Figure 1. 2 A summary of the five mainstream computing classes and their system characteristics. Sales in 2015 included about 1. 6 billion PMDs (90% cell phones), 275 million desktop PCs, and 15 million servers. The total number of embedded processors sold was nearly 19 billion. In total, 14. 8 billion ARM-technologybased chips were shipped in 2015. Note the wide range in system price for servers and embedded systems, which go from USB keys to network routers. For servers, this range arises from the need for very large-scale multiprocessor systems for high-end transaction processing. 9
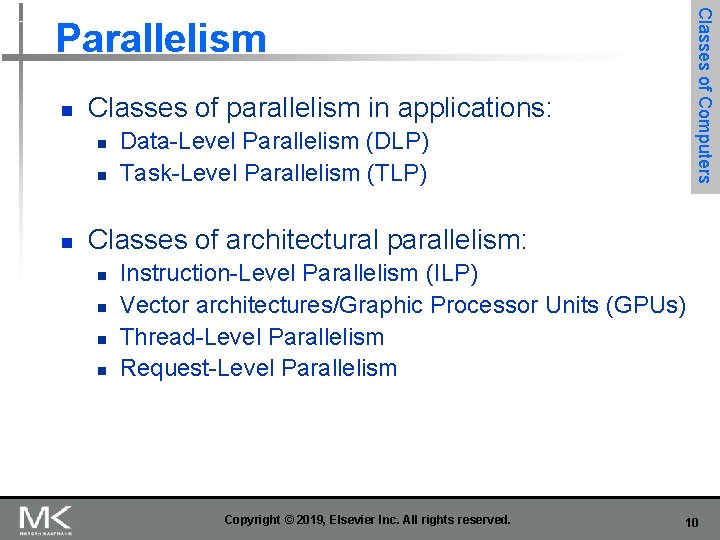
Classes of Computers Parallelism n Classes of parallelism in applications: n n n Data-Level Parallelism (DLP) Task-Level Parallelism (TLP) Classes of architectural parallelism: n n Instruction-Level Parallelism (ILP) Vector architectures/Graphic Processor Units (GPUs) Thread-Level Parallelism Request-Level Parallelism Copyright © 2019, Elsevier Inc. All rights reserved. 10
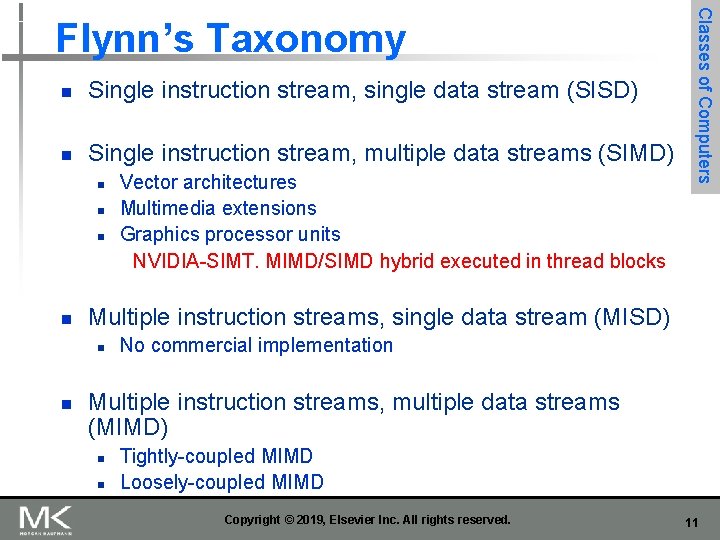
n Single instruction stream, single data stream (SISD) n Single instruction stream, multiple data streams (SIMD) n n Multiple instruction streams, single data stream (MISD) n n Vector architectures Multimedia extensions Graphics processor units NVIDIA-SIMT. MIMD/SIMD hybrid executed in thread blocks Classes of Computers Flynn’s Taxonomy No commercial implementation Multiple instruction streams, multiple data streams (MIMD) n n Tightly-coupled MIMD Loosely-coupled MIMD Copyright © 2019, Elsevier Inc. All rights reserved. 11
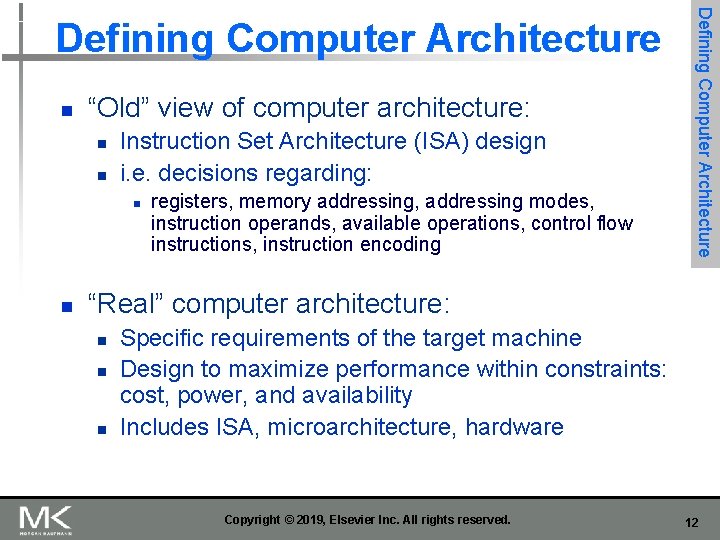
n “Old” view of computer architecture: n n Instruction Set Architecture (ISA) design i. e. decisions regarding: n n registers, memory addressing, addressing modes, instruction operands, available operations, control flow instructions, instruction encoding Defining Computer Architecture “Real” computer architecture: n n n Specific requirements of the target machine Design to maximize performance within constraints: cost, power, and availability Includes ISA, microarchitecture, hardware Copyright © 2019, Elsevier Inc. All rights reserved. 12
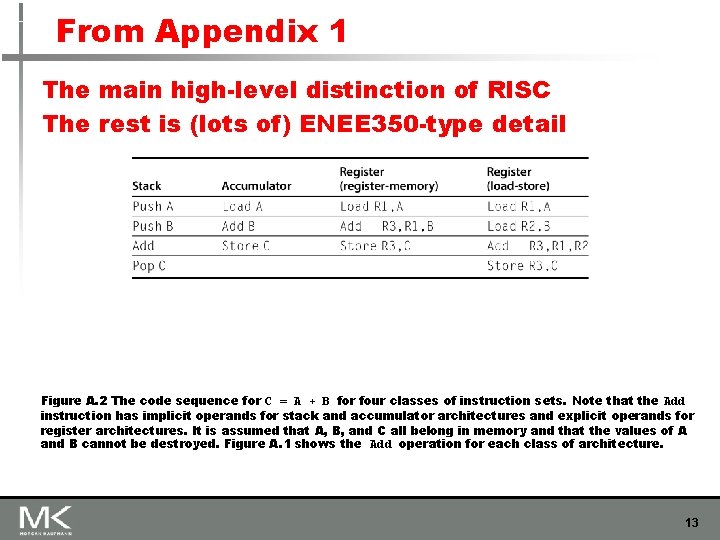
From Appendix 1 The main high-level distinction of RISC The rest is (lots of) ENEE 350 -type detail Figure A. 2 The code sequence for C = A + B for four classes of instruction sets. Note that the Add instruction has implicit operands for stack and accumulator architectures and explicit operands for register architectures. It is assumed that A, B, and C all belong in memory and that the values of A and B cannot be destroyed. Figure A. 1 shows the Add operation for each class of architecture. 13
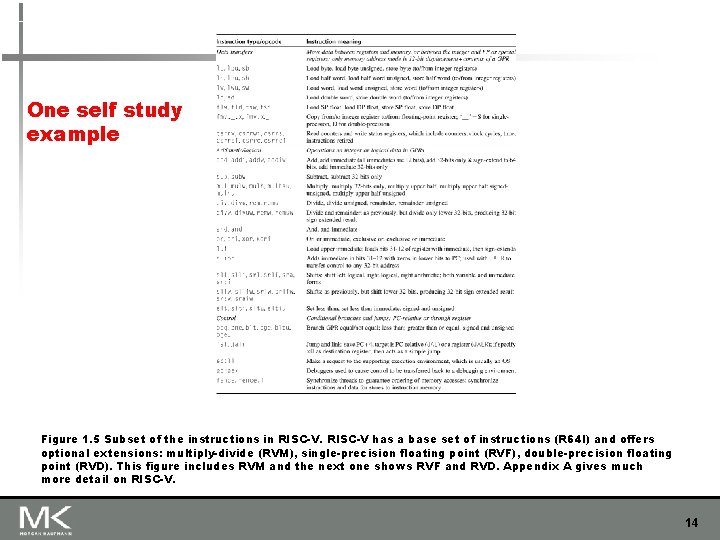
One self study example Figure 1. 5 Subset of the instructions in RISC-V has a base set of instructions (R 64 I) and offers optional extensions: multiply-divide (RVM), single-precision floating point (RVF), double-precision floating point (RVD). This figure includes RVM and the next one shows RVF and RVD. Appendix A gives much more detail on RISC-V. 14
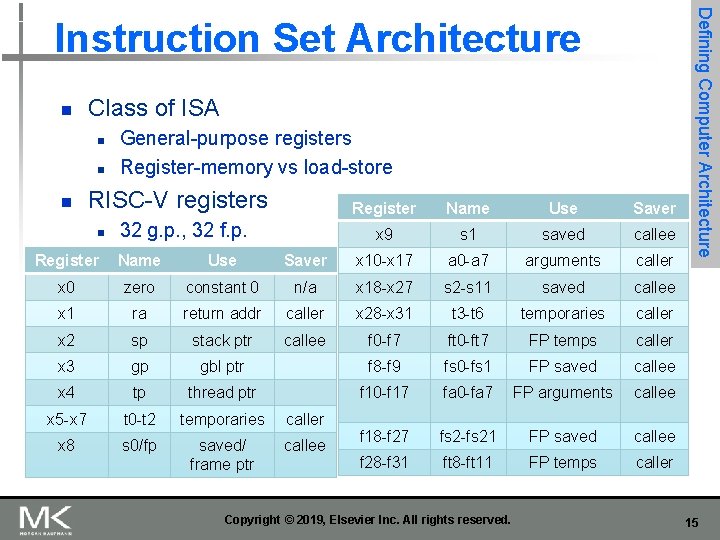
n Class of ISA n n n General-purpose registers Register-memory vs load-store RISC-V registers n 32 g. p. , 32 f. p. Register Name Use Saver x 9 s 1 saved callee Register Name Use Saver x 10 -x 17 a 0 -a 7 arguments caller x 0 zero constant 0 n/a x 18 -x 27 s 2 -s 11 saved callee x 1 ra return addr caller x 28 -x 31 t 3 -t 6 temporaries caller x 2 sp stack ptr callee f 0 -f 7 ft 0 -ft 7 FP temps caller x 3 gp gbl ptr f 8 -f 9 fs 0 -fs 1 FP saved callee x 4 tp thread ptr f 10 -f 17 fa 0 -fa 7 FP arguments callee x 5 -x 7 t 0 -t 2 temporaries caller x 8 s 0/fp saved/ frame ptr callee f 18 -f 27 fs 2 -fs 21 FP saved callee f 28 -f 31 ft 8 -ft 11 FP temps caller Copyright © 2019, Elsevier Inc. All rights reserved. Defining Computer Architecture Instruction Set Architecture 15
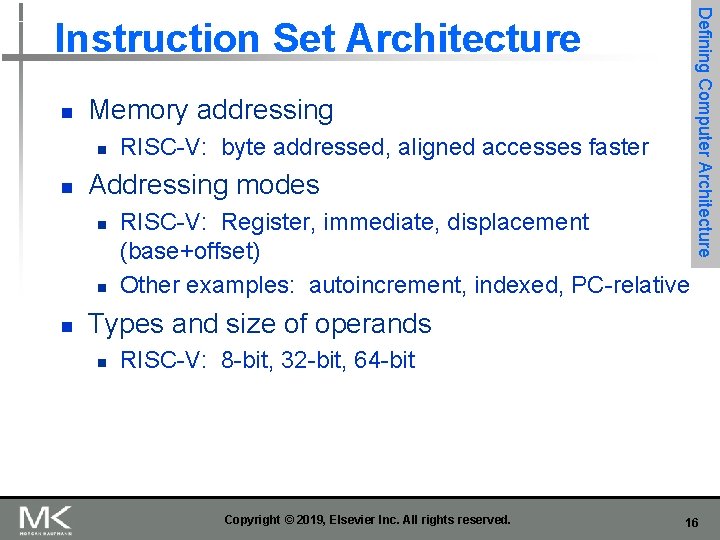
n Memory addressing n n Addressing modes n n n RISC-V: byte addressed, aligned accesses faster RISC-V: Register, immediate, displacement (base+offset) Other examples: autoincrement, indexed, PC-relative Defining Computer Architecture Instruction Set Architecture Types and size of operands n RISC-V: 8 -bit, 32 -bit, 64 -bit Copyright © 2019, Elsevier Inc. All rights reserved. 16
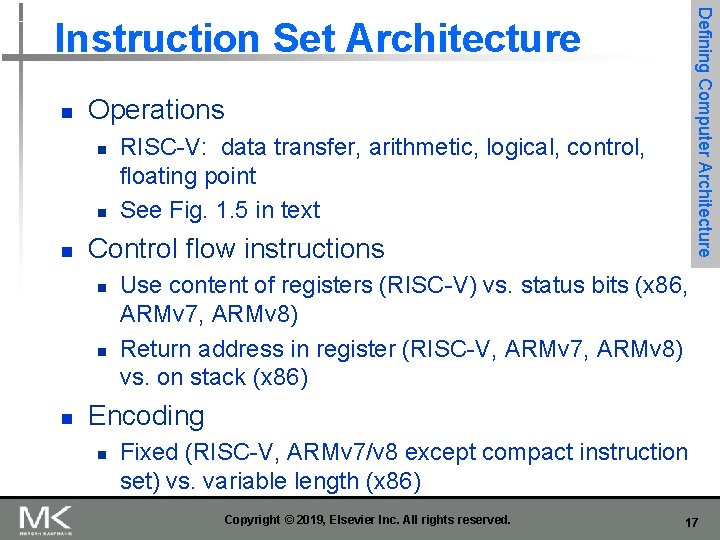
Defining Computer Architecture Instruction Set Architecture n Operations n n n Control flow instructions n n n RISC-V: data transfer, arithmetic, logical, control, floating point See Fig. 1. 5 in text Use content of registers (RISC-V) vs. status bits (x 86, ARMv 7, ARMv 8) Return address in register (RISC-V, ARMv 7, ARMv 8) vs. on stack (x 86) Encoding n Fixed (RISC-V, ARMv 7/v 8 except compact instruction set) vs. variable length (x 86) Copyright © 2019, Elsevier Inc. All rights reserved. 17
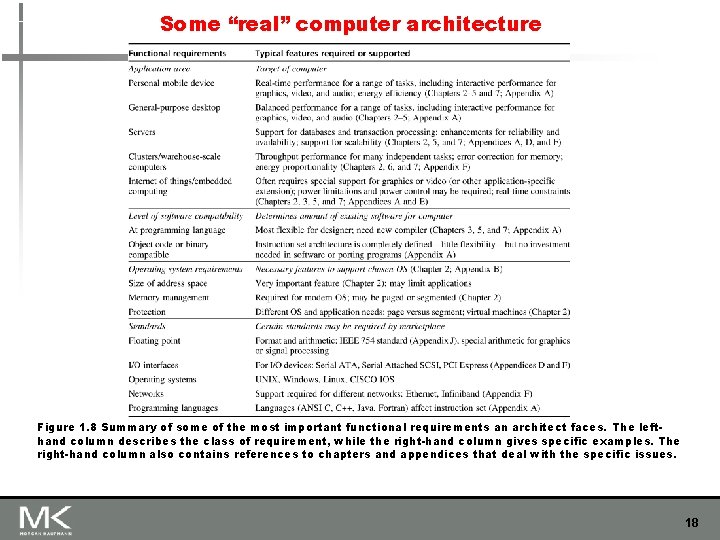
Some “real” computer architecture Figure 1. 8 Summary of some of the most important functional requirements an architect faces. The lefthand column describes the class of requirement, while the right-hand column gives specific examples. The right-hand column also contains references to chapters and appendices that deal with the specific issues. 18
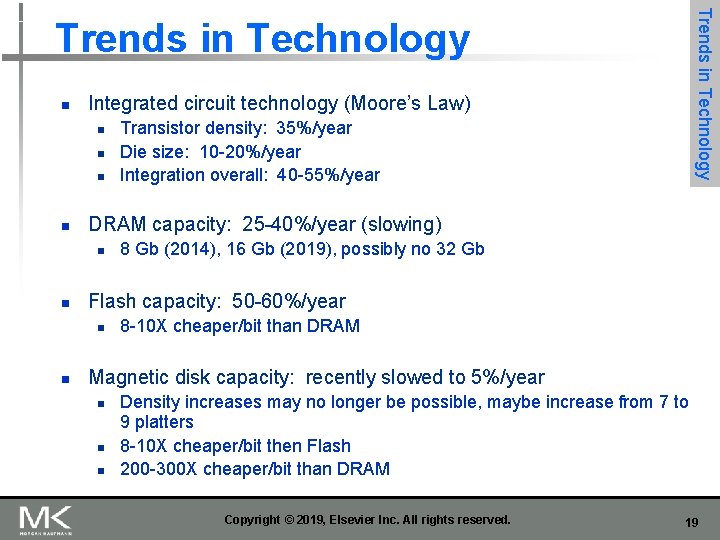
Trends in Technology n Integrated circuit technology (Moore’s Law) n n DRAM capacity: 25 -40%/year (slowing) n n 8 Gb (2014), 16 Gb (2019), possibly no 32 Gb Flash capacity: 50 -60%/year n n Transistor density: 35%/year Die size: 10 -20%/year Integration overall: 40 -55%/year 8 -10 X cheaper/bit than DRAM Magnetic disk capacity: recently slowed to 5%/year n n n Density increases may no longer be possible, maybe increase from 7 to 9 platters 8 -10 X cheaper/bit then Flash 200 -300 X cheaper/bit than DRAM Copyright © 2019, Elsevier Inc. All rights reserved. 19
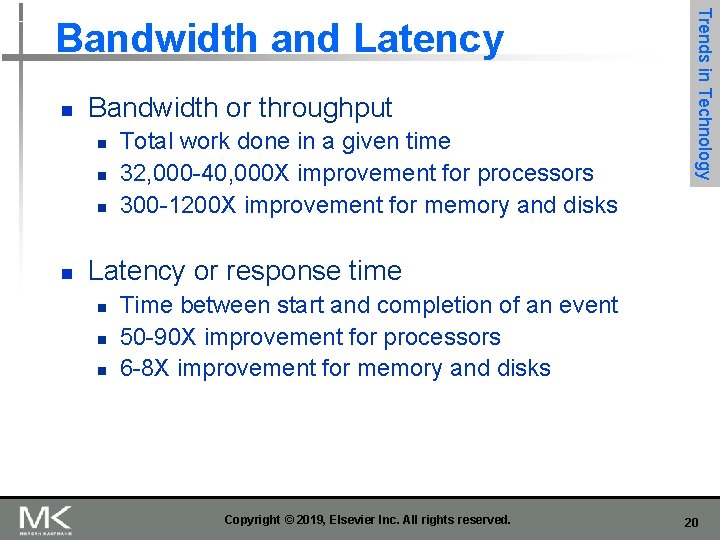
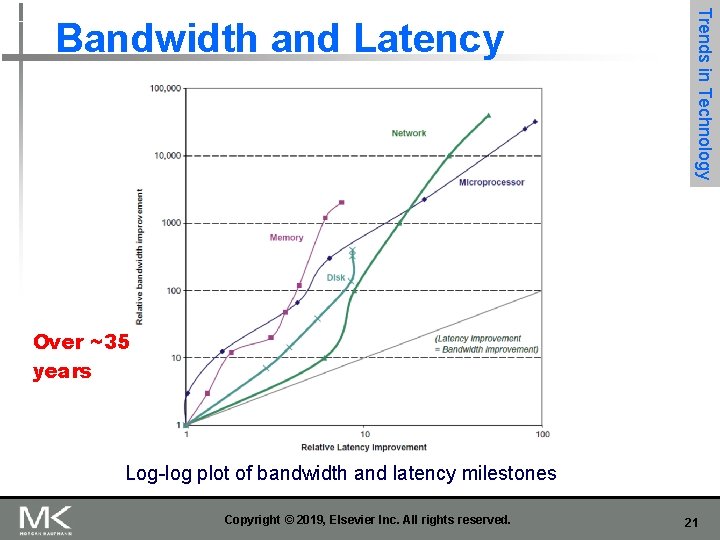
n Bandwidth or throughput n n Total work done in a given time 32, 000 -40, 000 X improvement for processors 300 -1200 X improvement for memory and disks Trends in Technology Bandwidth and Latency or response time n n n Time between start and completion of an event 50 -90 X improvement for processors 6 -8 X improvement for memory and disks Copyright © 2019, Elsevier Inc. All rights reserved. 20
Trends in Technology Bandwidth and Latency Over ~35 years Log-log plot of bandwidth and latency milestones Copyright © 2019, Elsevier Inc. All rights reserved. 21
n Feature size n n n Minimum size of transistor or wire in x or y dimension 10 microns in 1971 to. 011 microns in 2017 Transistor performance scales linearly n n Trends in Technology Transistors and Wires Wire delay does not improve with feature size! Integration density scales quadratically. Namely, 10 nm will mean 1 M larger density since 1971. Increase in chip size is extra…. Copyright © 2019, Elsevier Inc. All rights reserved. 22
n Problem: Get power in, get power out n Thermal Design Power (TDP) n n n Characterizes sustained power consumption Used as target for power supply and cooling system Lower than peak power (1. 5 X higher), higher than average power consumption Trends in Power and Energy Clock rate can be reduced dynamically to limit power consumption Energy per task is often a better measurement Copyright © 2019, Elsevier Inc. All rights reserved. 23
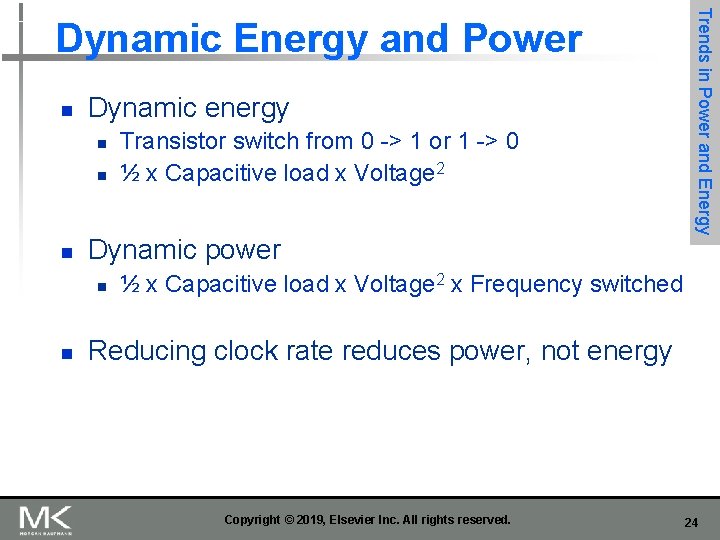
n Dynamic energy n n n Dynamic power n n Transistor switch from 0 -> 1 or 1 -> 0 ½ x Capacitive load x Voltage 2 Trends in Power and Energy Dynamic Energy and Power ½ x Capacitive load x Voltage 2 x Frequency switched Reducing clock rate reduces power, not energy Copyright © 2019, Elsevier Inc. All rights reserved. 24
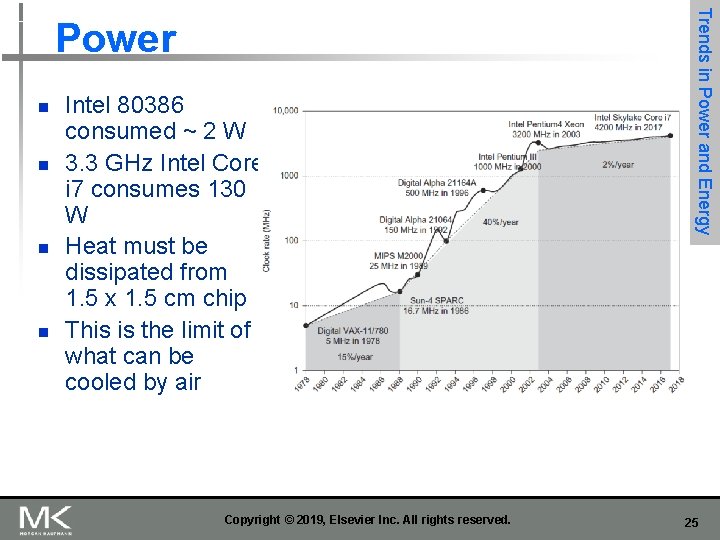
n n Intel 80386 consumed ~ 2 W 3. 3 GHz Intel Core i 7 consumes 130 W Heat must be dissipated from 1. 5 x 1. 5 cm chip This is the limit of what can be cooled by air Copyright © 2019, Elsevier Inc. All rights reserved. Trends in Power and Energy Power 25
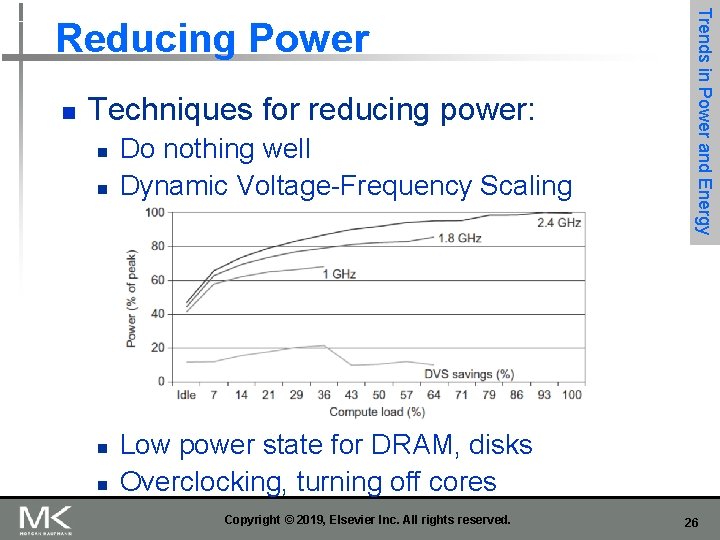
n Techniques for reducing power: n n Do nothing well Dynamic Voltage-Frequency Scaling Trends in Power and Energy Reducing Power Low power state for DRAM, disks Overclocking, turning off cores Copyright © 2019, Elsevier Inc. All rights reserved. 26
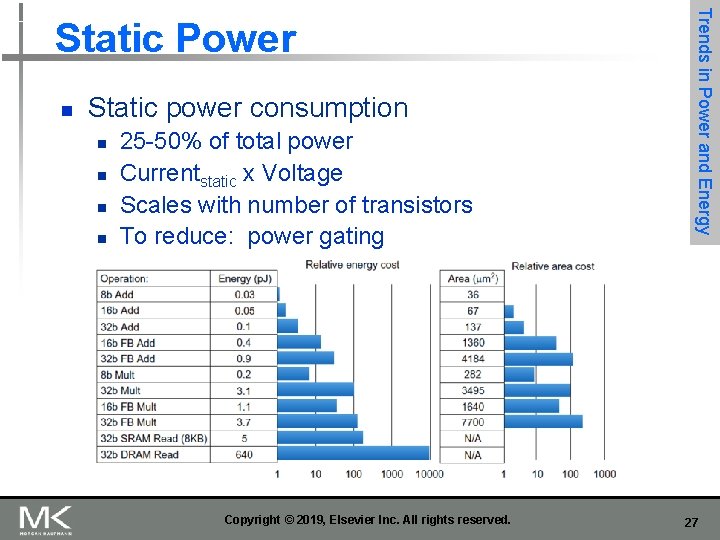
n Static power consumption n n 25 -50% of total power Currentstatic x Voltage Scales with number of transistors To reduce: power gating Copyright © 2019, Elsevier Inc. All rights reserved. Trends in Power and Energy Static Power 27
n Cost driven down by learning curve n n n Trends in Cost Yield DRAM: price closely tracks cost Microprocessors: price depends on volume n 10% less for each doubling of volume Copyright © 2019, Elsevier Inc. All rights reserved. 28
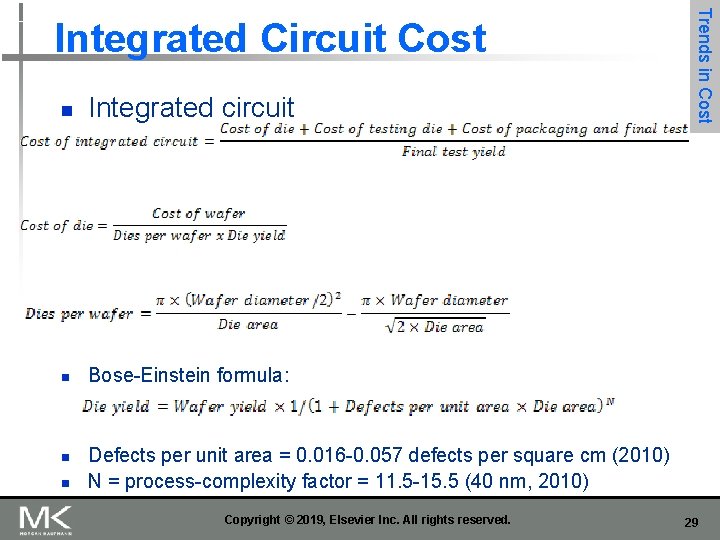
n Integrated circuit n Bose-Einstein formula: n n Trends in Cost Integrated Circuit Cost Defects per unit area = 0. 016 -0. 057 defects per square cm (2010) N = process-complexity factor = 11. 5 -15. 5 (40 nm, 2010) Copyright © 2019, Elsevier Inc. All rights reserved. 29
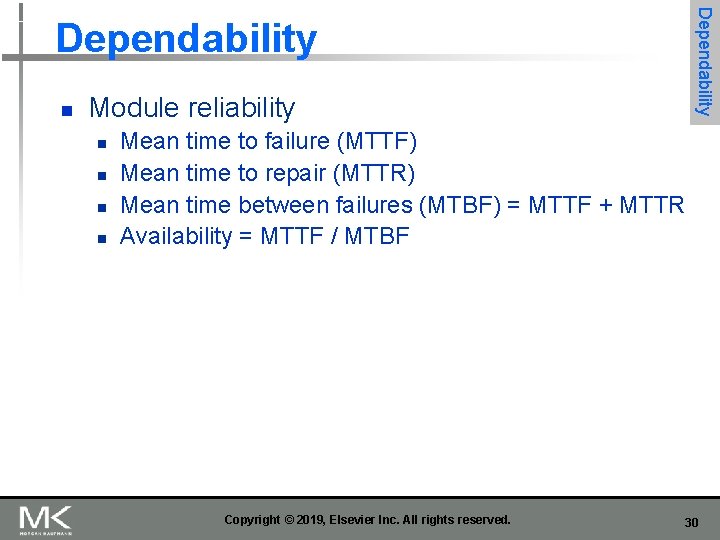
Dependability n Module reliability n n Mean time to failure (MTTF) Mean time to repair (MTTR) Mean time between failures (MTBF) = MTTF + MTTR Availability = MTTF / MTBF Copyright © 2019, Elsevier Inc. All rights reserved. 30
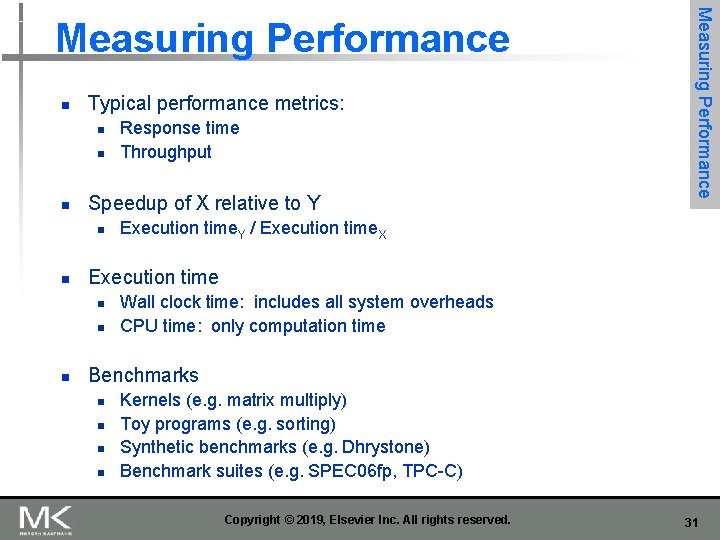
n Typical performance metrics: n n n Speedup of X relative to Y n n Execution time. Y / Execution time. X Execution time n n n Response time Throughput Measuring Performance Wall clock time: includes all system overheads CPU time: only computation time Benchmarks n n Kernels (e. g. matrix multiply) Toy programs (e. g. sorting) Synthetic benchmarks (e. g. Dhrystone) Benchmark suites (e. g. SPEC 06 fp, TPC-C) Copyright © 2019, Elsevier Inc. All rights reserved. 31
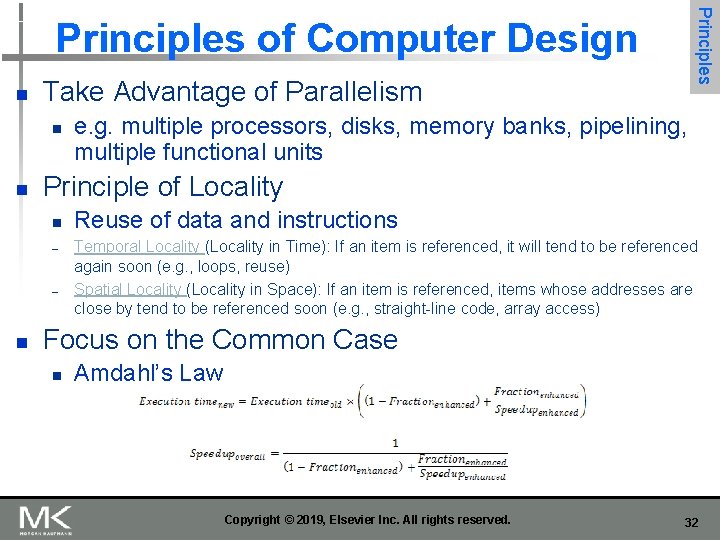
Principles of Computer Design n Take Advantage of Parallelism n n Principle of Locality n – – n e. g. multiple processors, disks, memory banks, pipelining, multiple functional units Reuse of data and instructions Temporal Locality (Locality in Time): If an item is referenced, it will tend to be referenced again soon (e. g. , loops, reuse) Spatial Locality (Locality in Space): If an item is referenced, items whose addresses are close by tend to be referenced soon (e. g. , straight-line code, array access) Focus on the Common Case n Amdahl’s Law Copyright © 2019, Elsevier Inc. All rights reserved. 32
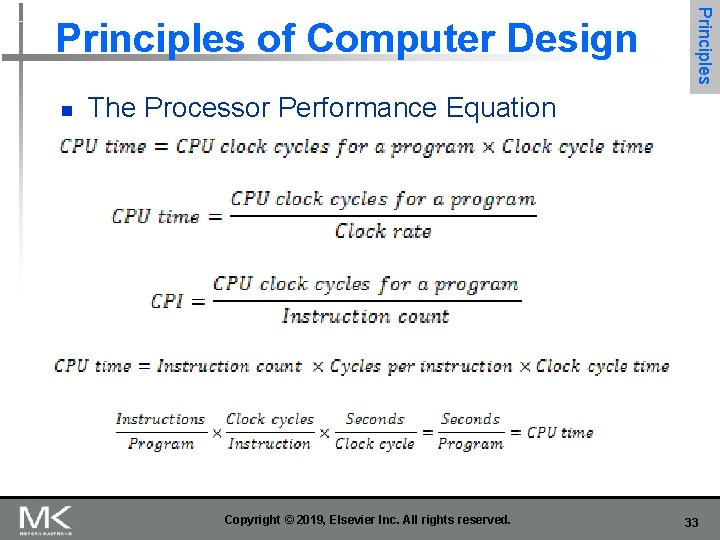
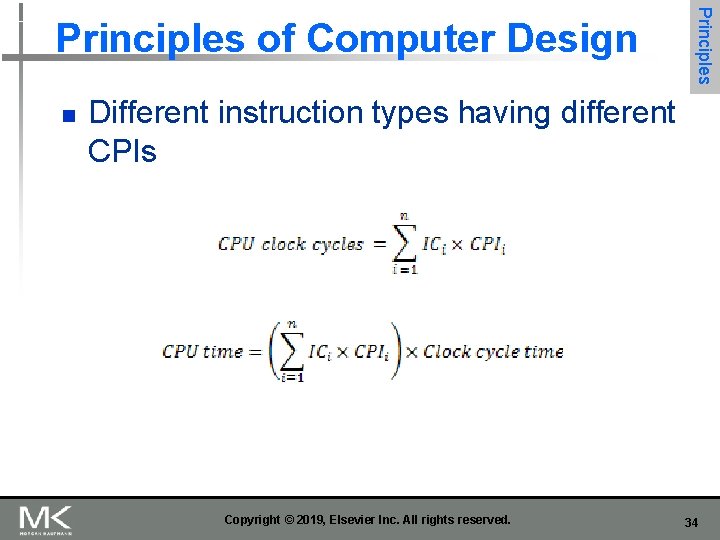
n Principles of Computer Design The Processor Performance Equation Copyright © 2019, Elsevier Inc. All rights reserved. 33
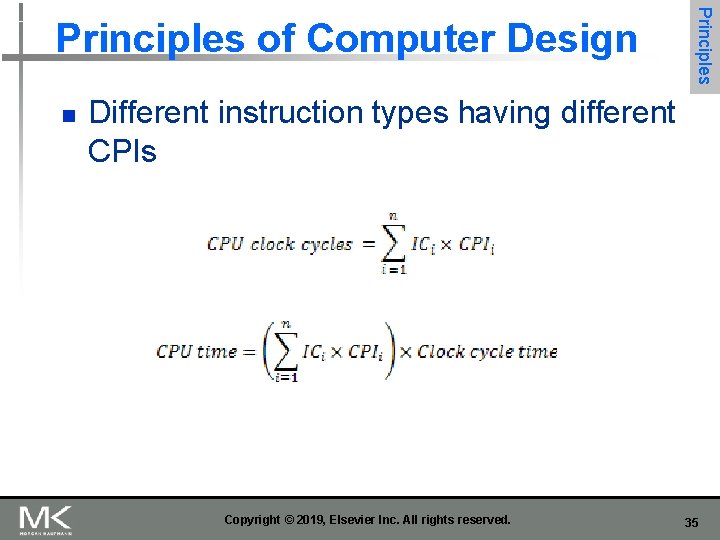
n Principles of Computer Design Different instruction types having different CPIs Copyright © 2019, Elsevier Inc. All rights reserved. 34
n Principles of Computer Design Different instruction types having different CPIs Copyright © 2019, Elsevier Inc. All rights reserved. 35
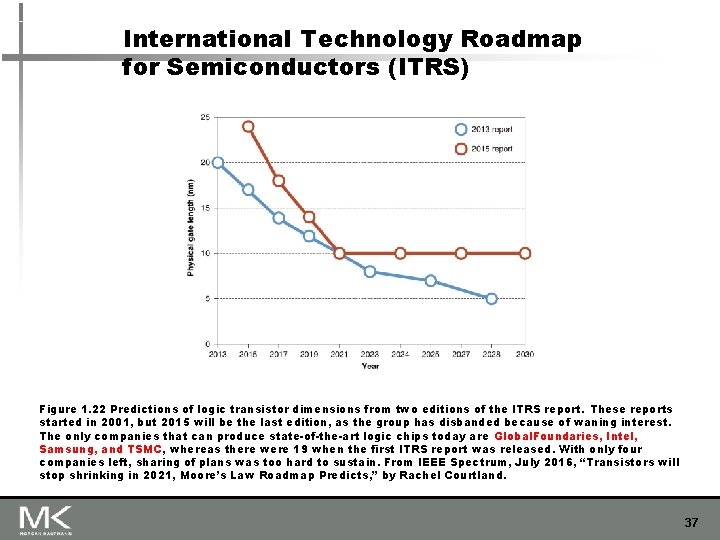
Fallacies and Pitfalls n All exponential laws must come to an end n Dennard scaling (constant power density) n n Disk capacity n n Stopped by threshold voltage 30 -100% per year to 5% per year Moore’s Law n n Most visible with DRAM capacity ITRS disbanded next slide Only four foundries left producing state-of-the-art logic chips 11 nm, 3 nm might be the limit Copyright © 2019, Elsevier Inc. All rights reserved. 36
International Technology Roadmap for Semiconductors (ITRS) Figure 1. 22 Predictions of logic transistor dimensions from two editions of the ITRS report. These reports started in 2001, but 2015 will be the last edition, as the group has disbanded because of waning interest. The only companies that can produce state-of-the-art logic chips today are Global. Foundaries, Intel, Samsung, and TSMC, whereas there were 19 when the first ITRS report was released. With only four companies left, sharing of plans was too hard to sustain. From IEEE Spectrum, July 2016, “Transistors will stop shrinking in 2021, Moore’s Law Roadmap Predicts, ” by Rachel Courtland. 37
Fallacies and Pitfalls n Microprocessors are a silver bullet n n n With multi-processors: Performance is now a programmer’s burden Falling prey to Amdahl’s Law A single point of failure add redundancy: no single component can fail the whole system n n Hardware enhancements that increase performance also improve energy efficiency, or are at worst energy neutral often worsen energy Benchmarks remain valid indefinitely n Compiler optimizations target benchmarks Copyright © 2019, Elsevier Inc. All rights reserved. 38
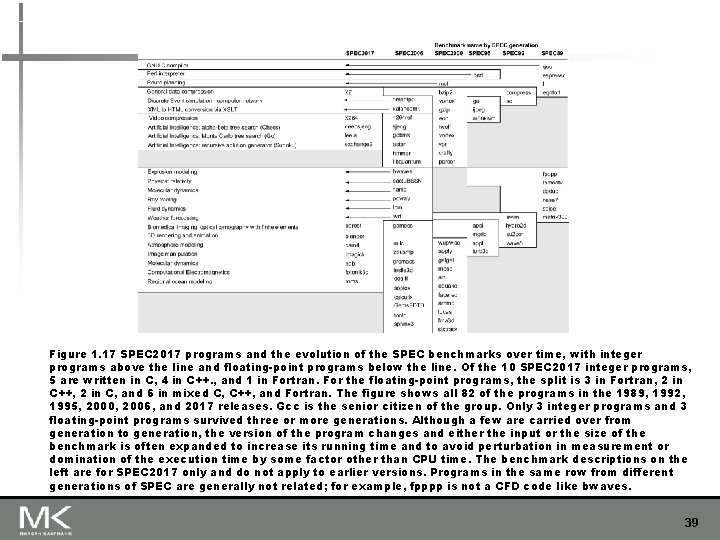
Figure 1. 17 SPEC 2017 programs and the evolution of the SPEC benchmarks over time, with integer programs above the line and floating-point programs below the line. Of the 10 SPEC 2017 integer programs, 5 are written in C, 4 in C++. , and 1 in Fortran. For the floating-point programs, the split is 3 in Fortran, 2 in C++, 2 in C, and 6 in mixed C, C++, and Fortran. The figure shows all 82 of the programs in the 1989, 1992, 1995, 2000, 2006, and 2017 releases. Gcc is the senior citizen of the group. Only 3 integer programs and 3 floating-point programs survived three or more generations. Although a few are carried over from generation to generation, the version of the program changes and either the input or the size of the benchmark is often expanded to increase its running time and to avoid perturbation in measurement or domination of the execution time by some factor other than CPU time. The benchmark descriptions on the left are for SPEC 2017 only and do not apply to earlier versions. Programs in the same row from different generations of SPEC are generally not related; for example, fpppp is not a CFD code like bwaves. 39
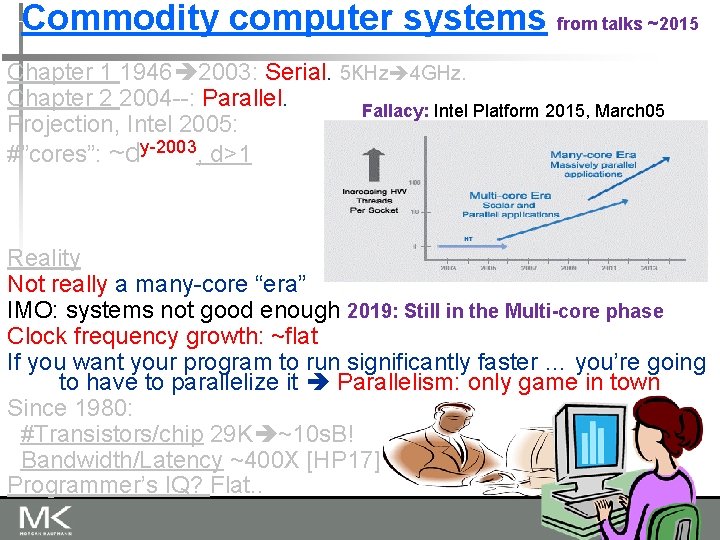
Commodity computer systems from talks ~2015 Chapter 1 1946 2003: Serial. 5 KHz 4 GHz. Chapter 2 2004 --: Parallel. Fallacy: Intel Platform 2015, March 05 Projection, Intel 2005: #”cores”: ~dy-2003, d>1 Reality Not really a many-core “era” IMO: systems not good enough 2019: Still in the Multi-core phase Clock frequency growth: ~flat If you want your program to run significantly faster … you’re going to have to parallelize it Parallelism: only game in town Since 1980: #Transistors/chip 29 K ~10 s. B! Bandwidth/Latency ~400 X [HP 17] Programmer’s IQ? Flat. . 40
Pitfall: Power above all Today’s hot research. I am not questioning that power is important. However, a pitfall since implies - building slightly more power efficient machines that are even more difficult to program; hence, - typical programs will end up being suboptimal possibly requiring more power, and - fewer program will be developed… saving even more power… and, disconnecting computers from power would be optimal…just kidding. The Industrial Revolution meant more electricity for better human productivity. Isn’t this about arguing the opposite? Copyright © 2019, Elsevier Inc. All rights reserved. 41
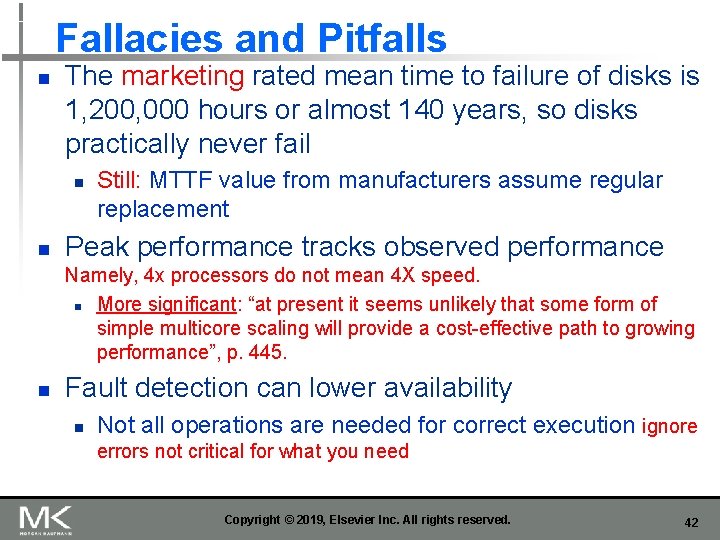
Fallacies and Pitfalls n The marketing rated mean time to failure of disks is 1, 200, 000 hours or almost 140 years, so disks practically never fail n n Still: MTTF value from manufacturers assume regular replacement Peak performance tracks observed performance Namely, 4 x processors do not mean 4 X speed. n More significant: “at present it seems unlikely that some form of simple multicore scaling will provide a cost-effective path to growing performance”, p. 445. n Fault detection can lower availability n Not all operations are needed for correct execution ignore errors not critical for what you need Copyright © 2019, Elsevier Inc. All rights reserved. 42
Last question n n How come that HP-17 does not mention the Intel i. GPU? Surprisingly little attention in academic papers prior to 2018. Not much even now Copyright © 2019, Elsevier Inc. All rights reserved. 43
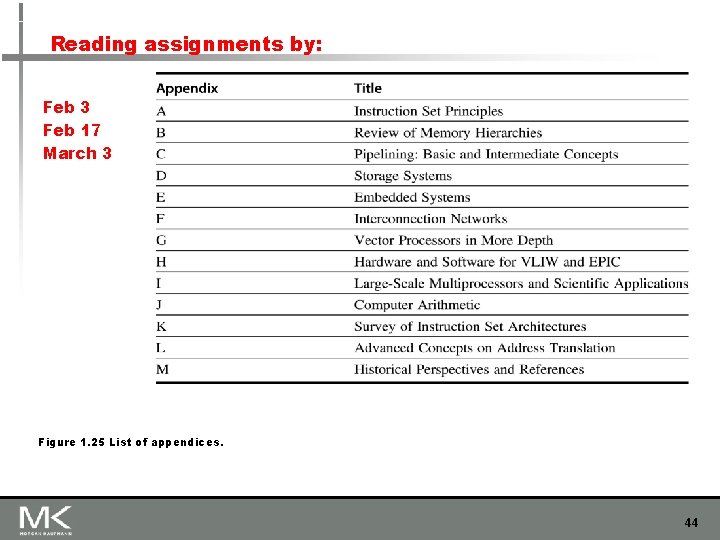
Reading assignments by: Feb 3 Feb 17 March 3 Figure 1. 25 List of appendices. 44