Compositional Human Pose Regression Xiao Sun Joint work




- Slides: 29
Compositional Human Pose Regression Xiao Sun Joint work with Yichen Wei
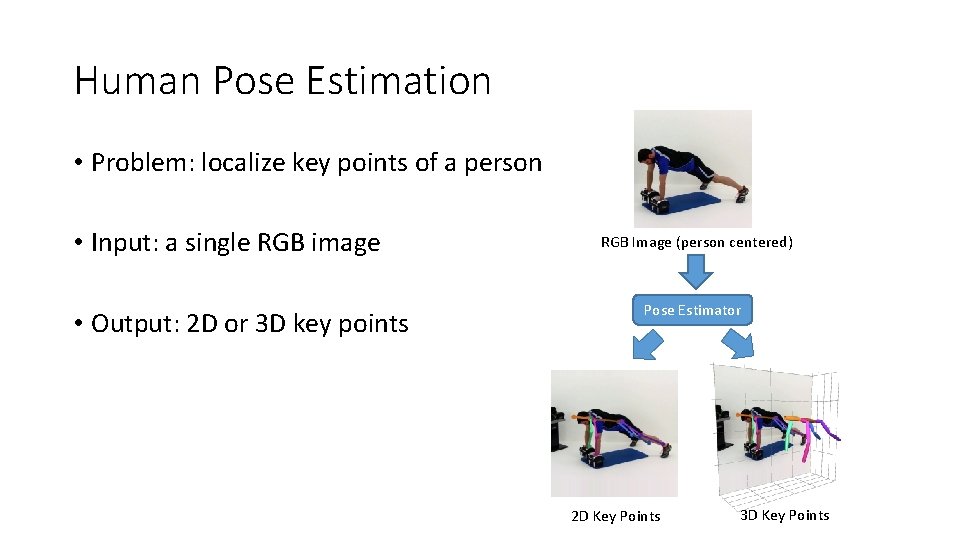
Human Pose Estimation • Problem: localize key points of a person • Input: a single RGB image • Output: 2 D or 3 D key points RGB Image (person centered) Pose Estimator 2 D Key Points 3 D Key Points
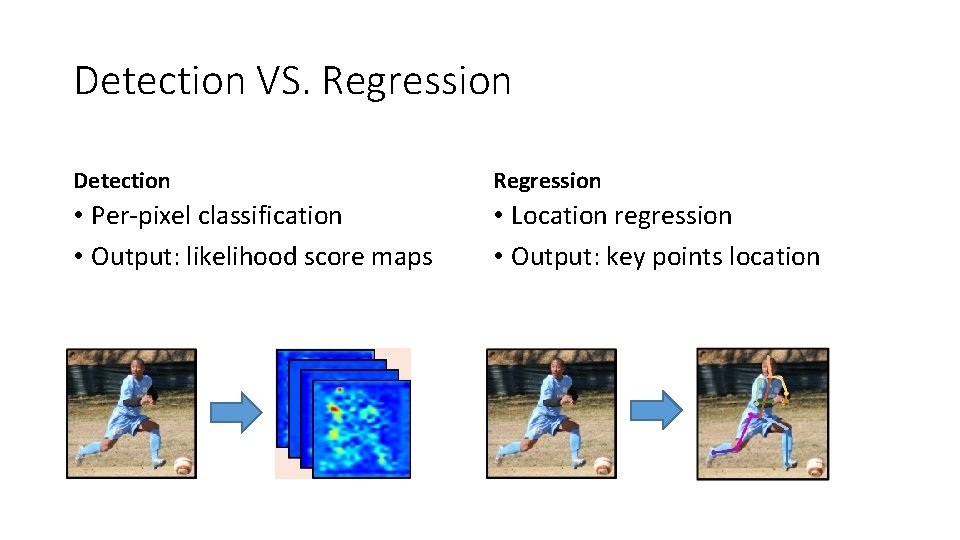
Detection VS. Regression Detection Regression • Per-pixel classification • Output: likelihood score maps • Location regression • Output: key points location
Performance Detection Regression • Per-pixel classification • Output: likelihood score maps • Used in most 2 D methods • State-of-the-art result • Location regression • Output: key points location • Only used in a few 2 D methods • Unsatisfactory result
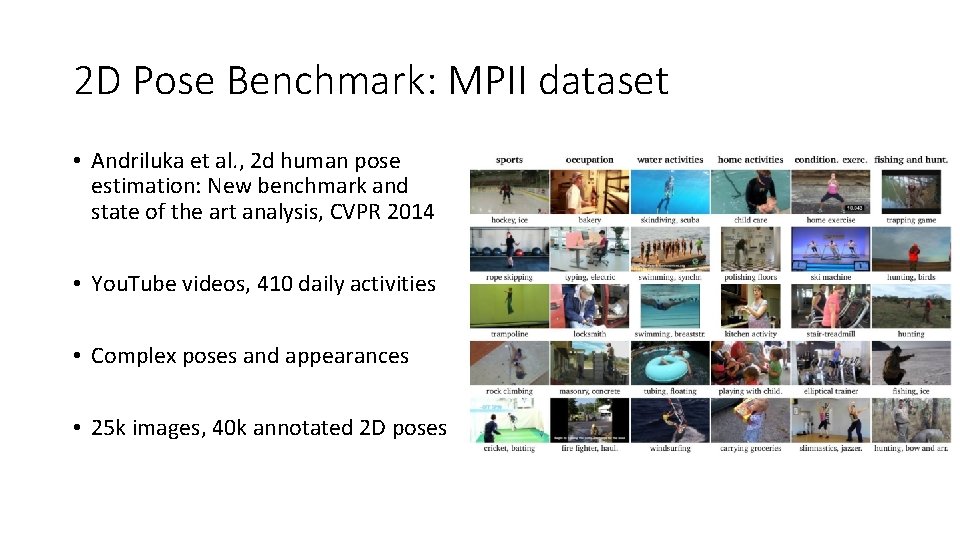
2 D Pose Benchmark: MPII dataset • Andriluka et al. , 2 d human pose estimation: New benchmark and state of the art analysis, CVPR 2014 • You. Tube videos, 410 daily activities • Complex poses and appearances • 25 k images, 40 k annotated 2 D poses
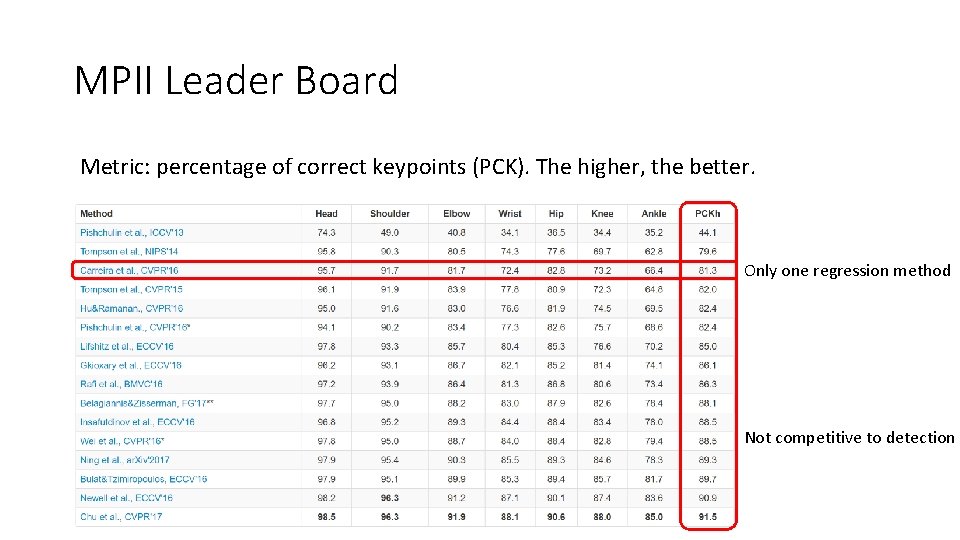
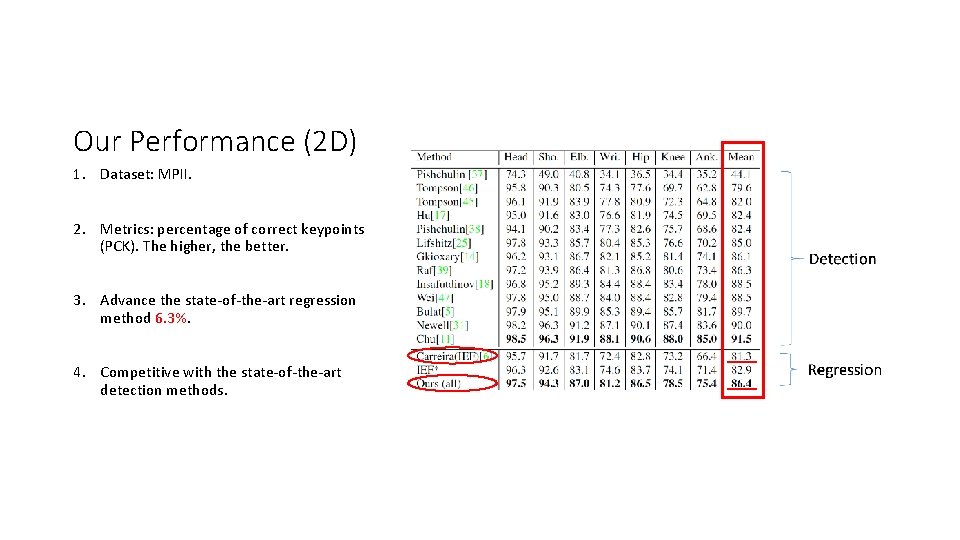
MPII Leader Board Metric: percentage of correct keypoints (PCK). The higher, the better. Only one regression method Not competitive to detection
Reason: exploit joint dependency Detection Regression • Per-pixel classification • Output: likelihood score maps • Used in most 2 D methods • State-of-the-art result • Scoremap is more expressive • Location regression • Output: key points location • Only used in a few 2 D methods • Unsatisfactory result • Dependency not well exploited
Generalization Detection Regression • Per-pixel classification • Output: likelihood score maps • Used in most 2 D methods • State-of-the-art result • Scoremap is more expressive • Hard to generalize to 3 D task • Location regression • Output: key points location • Only used in a few 2 D methods • Unsatisfactory result • Dependency not well exploited • General for both 2 D and 3 D task
Motivation of this work Detection Regression • Per-pixel classification • Output: likelihood score maps • Used in most 2 D methods • State-of-the-art result • Scoremaps are more expressive • Hard to generalize to 3 D task • Location regression • Output: key points location • Only used in a few 2 D methods • Unsatisfactory result • Dependency not well exploited • General for both 2 D and 3 D task
Proposed: structure-aware regression method • A novel pose representation and novel loss function • Better exploit joint dependency • Unified framework for 3 D and 2 D tasks • Complementary to network architectures • State-of-the-art on both 2 D and 3 D tasks (ICCV 2017 submission)
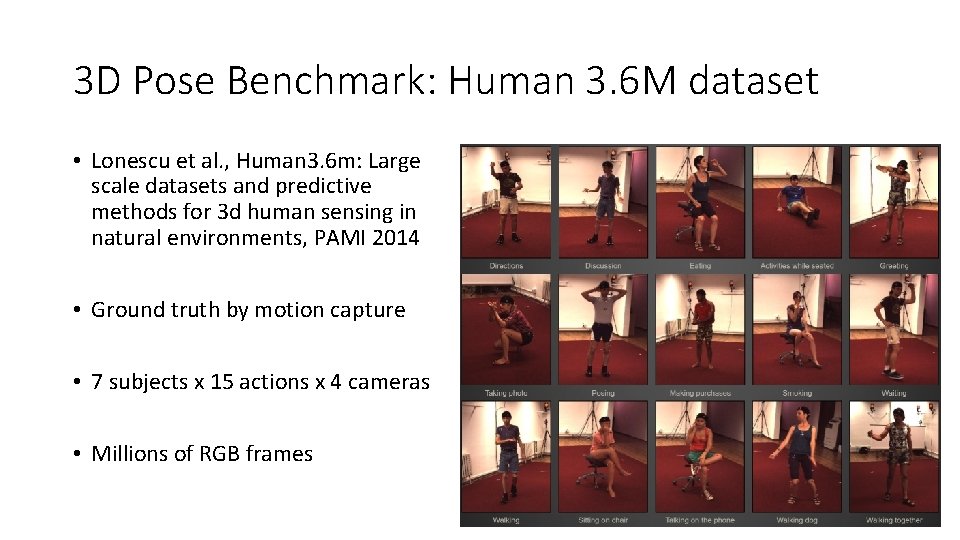
3 D Pose Benchmark: Human 3. 6 M dataset • Lonescu et al. , Human 3. 6 m: Large scale datasets and predictive methods for 3 d human sensing in natural environments, PAMI 2014 • Ground truth by motion capture • 7 subjects x 15 actions x 4 cameras • Millions of RGB frames
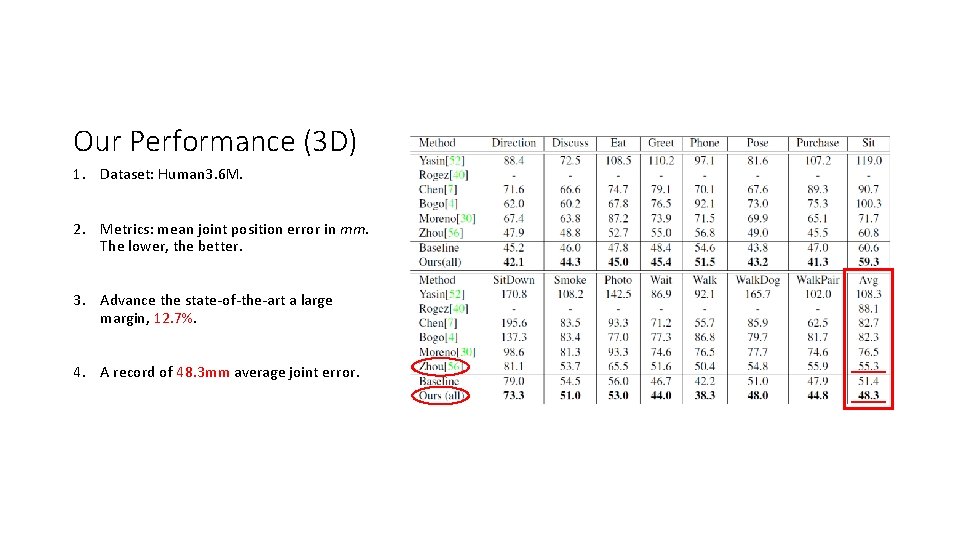
Our Performance (3 D) 1. Dataset: Human 3. 6 M. 2. Metrics: mean joint position error in mm. The lower, the better. 3. Advance the state-of-the-art a large margin, 12. 7%. 4. A record of 48. 3 mm average joint error.
Our Performance (2 D) 1. Dataset: MPII. 2. Metrics: percentage of correct keypoints (PCK). The higher, the better. 3. Advance the state-of-the-art regression method 6. 3%. 4. Competitive with the state-of-the-art detection methods.
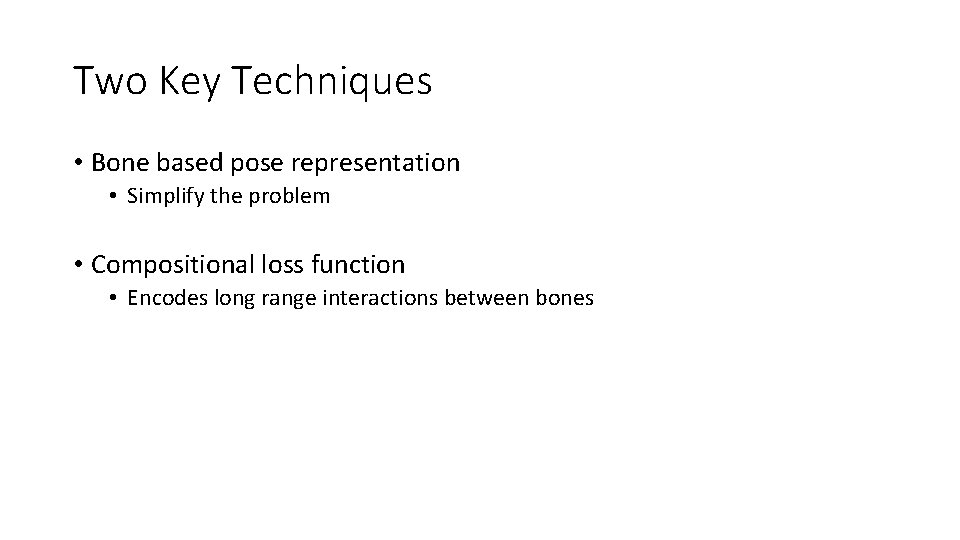
Two Key Techniques • Bone based pose representation • Simplify the problem • Compositional loss function • Encodes long range interactions between bones
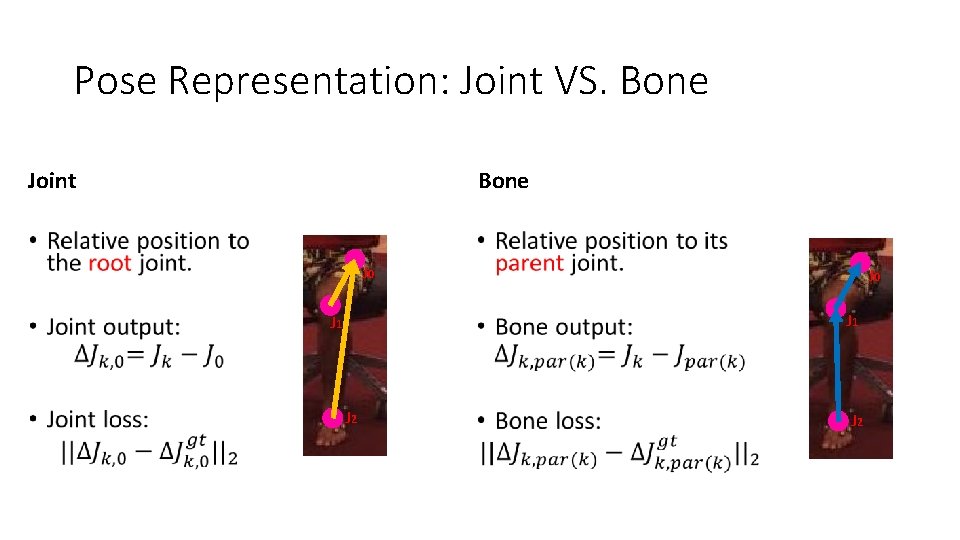
Pose Representation: Joint VS. Bone Joint Bone • J 0 J 1 J 2
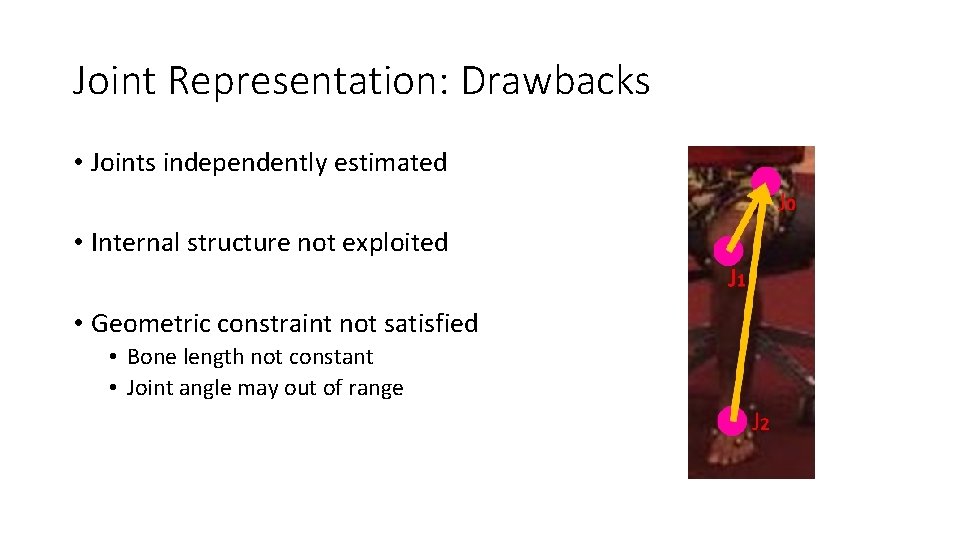
Joint Representation: Drawbacks • Joints independently estimated • Internal structure not exploited • Geometric constraint not satisfied • Bone length not constant • Joint angle may out of range
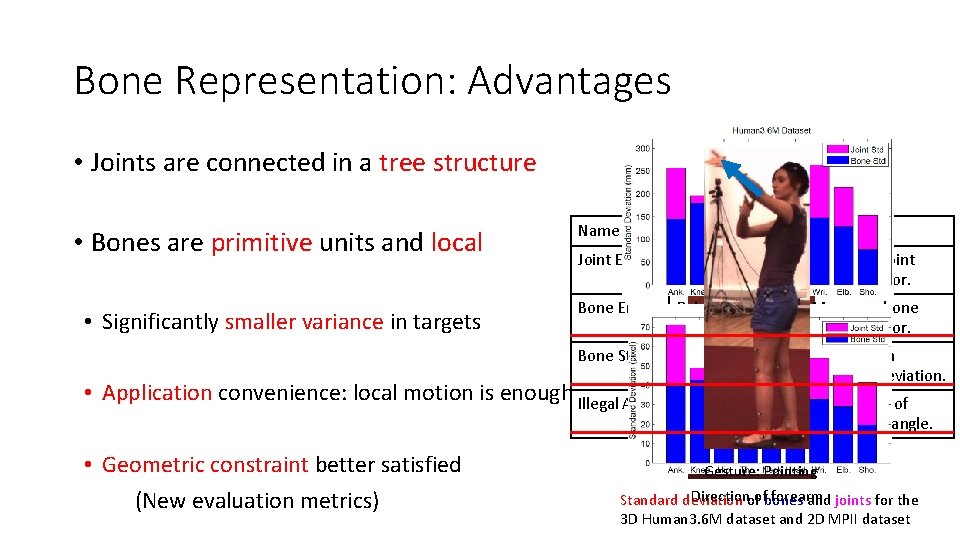
Bone Representation: Advantages • Joints are connected in a tree structure • Bones are primitive units and local • Significantly smaller variance in targets Name Type Joint Error Absolute location Mean per joint position error. Bone Error Relative location Mean per bone position error. Bone Std Physical validity Bone length standard deviation. Physical validity Percentage of illegal joint angle. • Application convenience: local motion is enough Illegal Angle • Geometric constraint better satisfied (New evaluation metrics) Definition Gesture: Pointing Direction of forearm Standard deviation of bones and joints for the 3 D Human 3. 6 M dataset and 2 D MPII dataset
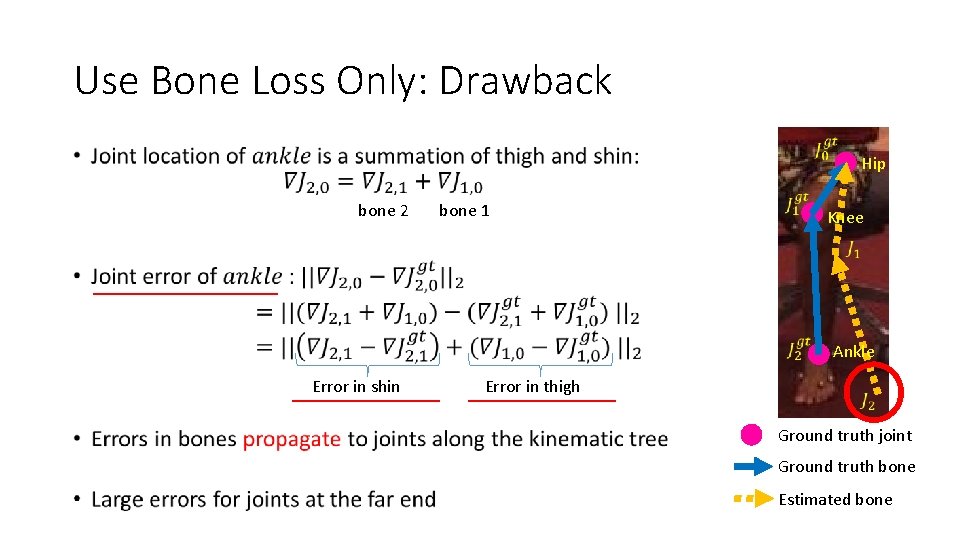
Use Bone Loss Only: Drawback • bone 2 bone 1 Hip Knee Error in shin Error in thigh Ankle Ground truth joint Ground truth bone Estimated bone
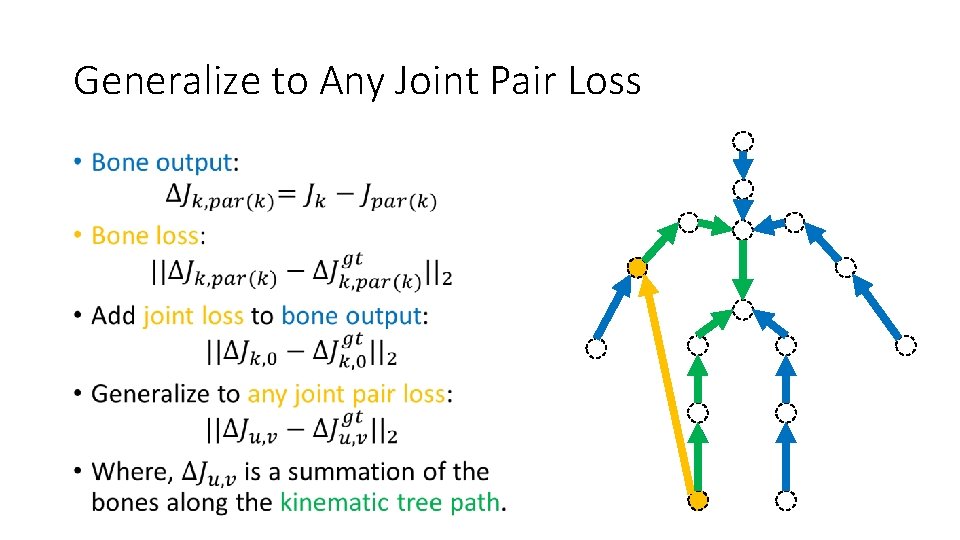
Motivation • Besides local bone loss only • Long-range losses should also be considered and balanced over the intermediate bones.
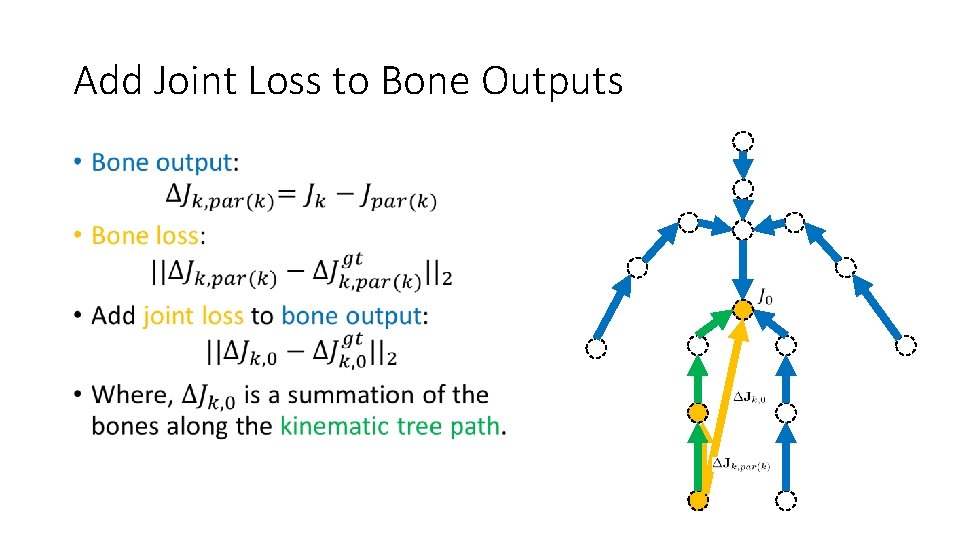
Add Joint Loss to Bone Outputs •
Generalize to Any Joint Pair Loss •
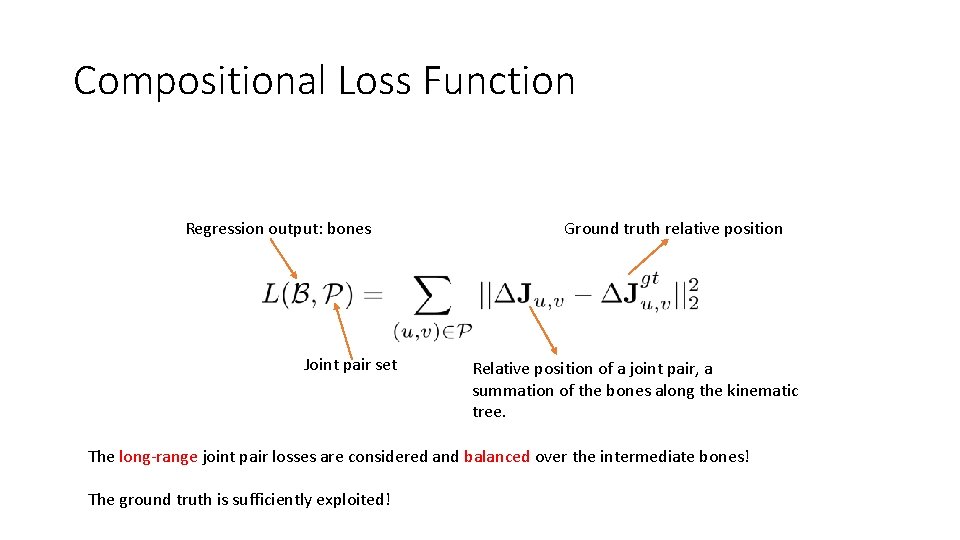
Compositional Loss Function Regression output: bones Joint pair set Ground truth relative position Relative position of a joint pair, a summation of the bones along the kinematic tree. The long-range joint pair losses are considered and balanced over the intermediate bones! The ground truth is sufficiently exploited!
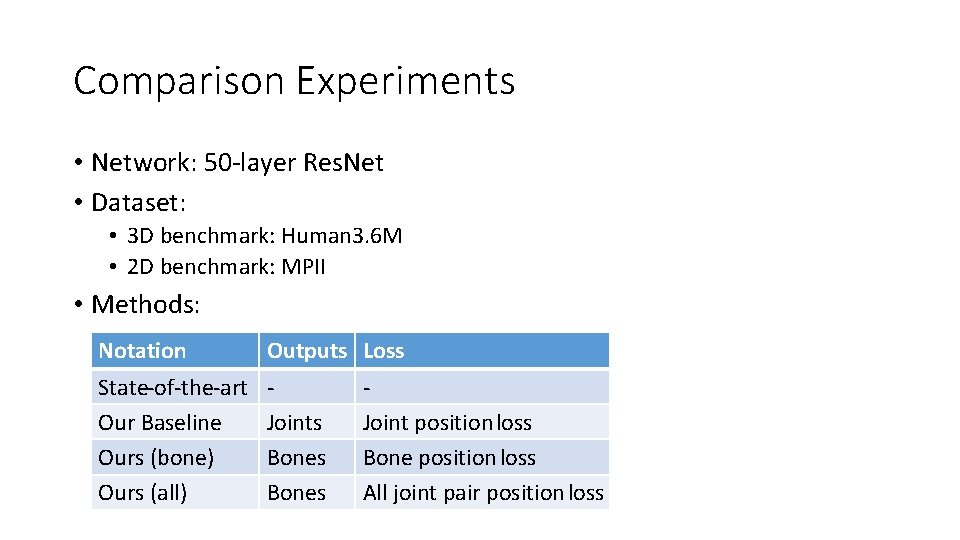
Comparison Experiments • Network: 50 -layer Res. Net • Dataset: • 3 D benchmark: Human 3. 6 M • 2 D benchmark: MPII • Methods: Notation Outputs Loss State-of-the-art Our Baseline Ours (bone) Ours (all) Joints Bones Joint position loss Bone position loss All joint pair position loss
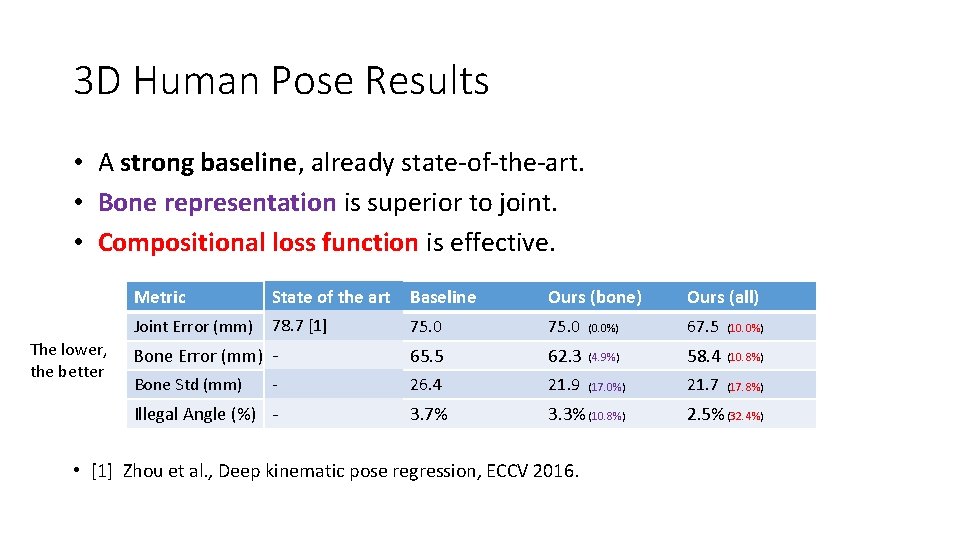
3 D Human Pose Results • A strong baseline, already state-of-the-art. • Bone representation is superior to joint. • Compositional loss function is effective. The lower, the better Metric State of the art Baseline Ours (bone) Ours (all) Joint Error (mm) 78. 7 [1] 75. 0 (0. 0%) 67. 5 (10. 0%) Bone Error (mm) - 65. 5 62. 3 (4. 9%) 58. 4 (10. 8%) - 26. 4 21. 9 (17. 0%) 21. 7 (17. 8%) 3. 7% 3. 3% (10. 8%) 2. 5% (32. 4%) Bone Std (mm) Illegal Angle (%) - • [1] Zhou et al. , Deep kinematic pose regression, ECCV 2016.
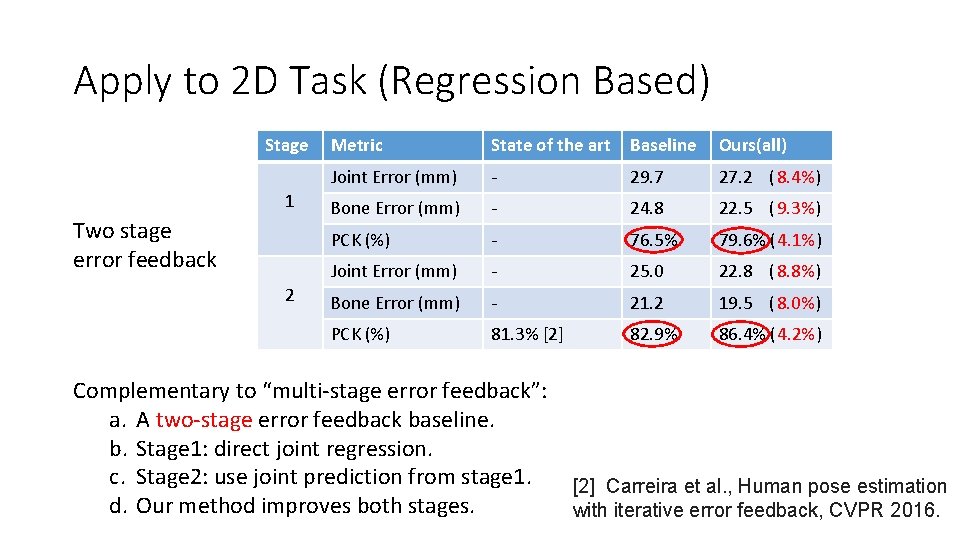
Apply to 2 D Task (Regression Based) Stage 1 Two stage error feedback 2 Metric State of the art Baseline Ours(all) Joint Error (mm) - 29. 7 27. 2 (8. 4%) Bone Error (mm) - 24. 8 22. 5 (9. 3%) PCK (%) - 76. 5% 79. 6% (4. 1%) Joint Error (mm) - 25. 0 22. 8 (8. 8%) Bone Error (mm) - 21. 2 19. 5 (8. 0%) PCK (%) 81. 3% [2] 82. 9% 86. 4% (4. 2%) Complementary to “multi-stage error feedback”: a. A two-stage error feedback baseline. b. Stage 1: direct joint regression. c. Stage 2: use joint prediction from stage 1. d. Our method improves both stages. [2] Carreira et al. , Human pose estimation with iterative error feedback, CVPR 2016.
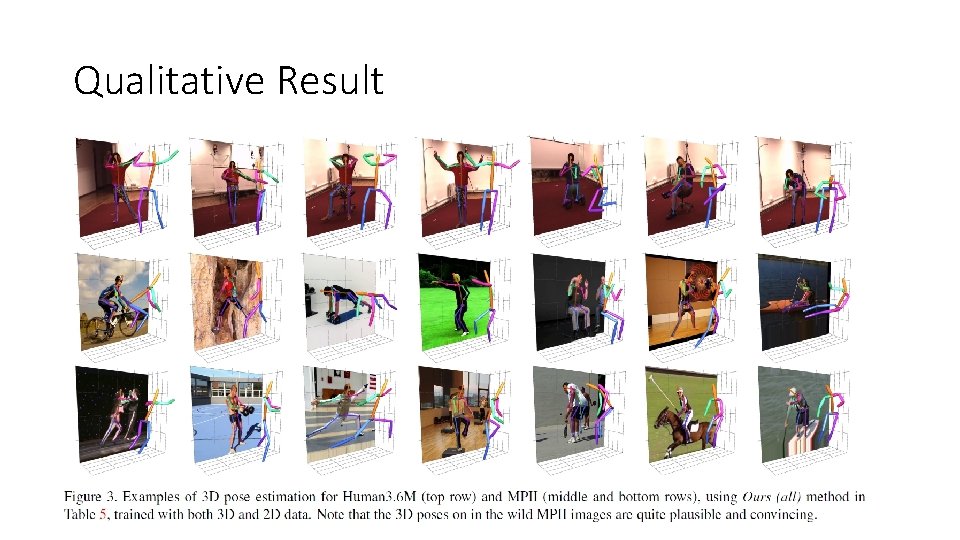
Unified 2 D and 3 D Pose Regression • Our method general for 3 D and 2 D task. • Easily mixed 3 D and 2 D data training: • Decompose the loss into xy part and z part. • xy part is always valid for both 3 D and 2 D samples. • z part is only computed for 3 D samples and set to 0 for 2 D samples. • Significantly improve 3 D pose performance • Joint Error 67. 5 ->48. 3, 28. 4%. • Plausible and convincing 3 D pose on in-the-wild image.
Qualitative Result
Video Result
Thanks!