Experiments in XRay Physics Lulu Liu Partner Pablo

Experiments in X-Ray Physics Lulu Liu Partner: Pablo Solis Junior Lab 8. 13 Lab 1 October 22 nd, 2007
 image from Cathode Ray Tube Site image")
Discovery of X-Rays l Wilhelm Roentgen (1895) image from Cathode Ray Tube Site image from Wolfram Research l Penetrating High Energy Photons l Bremsstrahlung Radiation

High Energy Photons and Matter l Production – – l Fluorescence – l Bremsstrahlung Radiation (Continuum) Atomic and Nuclear Processes (Radioactive Decay) Characteristic Lines (Inner Shell) Scatter – – – Photoelectric Effect (<50 ke. V) Compton Scattering (50 ke. V to 1 Me. V) Pair Production (> 5 Me. V) pair production from the wikipedia commons

Why X-Ray Physics? l Characteristic energy range of many atomic processes and transitions - regularity l Interacts with matter in many ways – – l easy to produce and characterize scattered and absorbed by all substances Medium penetration power – region of interest is normal matter, can be tuned, medicine

Presentation Outline l Calibration of Equipment and Error Determination l Production of X-Rays: – l Bremsstrahlung and e- e+ Annihilation X-Ray Fluorescence – – Motivation and Experimental Set-up Energy of Characteristic Lines vs. Atomic Number (Z) Doublet Separation between K 1 and K 2 lines Error and Applications

Equipment and Calibration l Germanium Solid-State Detector and MCA l Energy Calibration (optimally three points) – l For characteristic lines: - Tb K line (44. 5 ke. V) - Mo K line (17. 5 ke. V) - Fe 55 line (5. 89 ke. V) Linear Model: N = m. E + b, N = bin # E = energy (ke. V)

Calibration Fit 2 of 2. 6 Linear fit to determine energy and error on energy 2 E =. 027 + 4*10 -9(N -20. 5)2 Different calibration for each range
 (impact parameter) l Continuous Spectrum l E max =")
Bremsstrahlung Production l E (b) (impact parameter) l Continuous Spectrum l E max = Ke- max Strontium-90 Source/Lead Target n -> p+ + e- + e’ Sr 90 -> Y 90 -> Zr 90 max 2. 25 Me. V plot from lab guide

Bremsstrahlung Spectrum and Results Theoretical Value: 2. 25 Me. V - energy loss in trajectory - detector efficiency

Characteristic Lines - Motivation l X-Ray fluorescence of elements – – – l l sharp peaks, independent of incident energy uniquely characterizes an element low variability of spectrum – shift How are they produced? What is the relation? ATOMIC STRUCTURE!

Characteristic Lines Hypothesis l Innermost-shell electron transitions – l Ionization Bohr Model Energy Level Approximation: E = Rhc(Z- )2 (1/nf 2 – 1/ni 2}) For K : ni=2 -> nf=1 E = 3/4 Rhc(Z- )2 Image courtesy of Nuclear Society of Thailand

Experimental Design
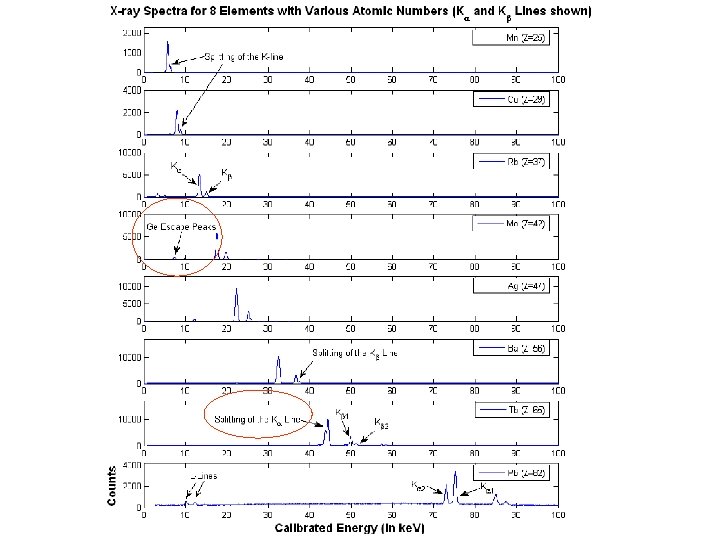
 K 1 K")
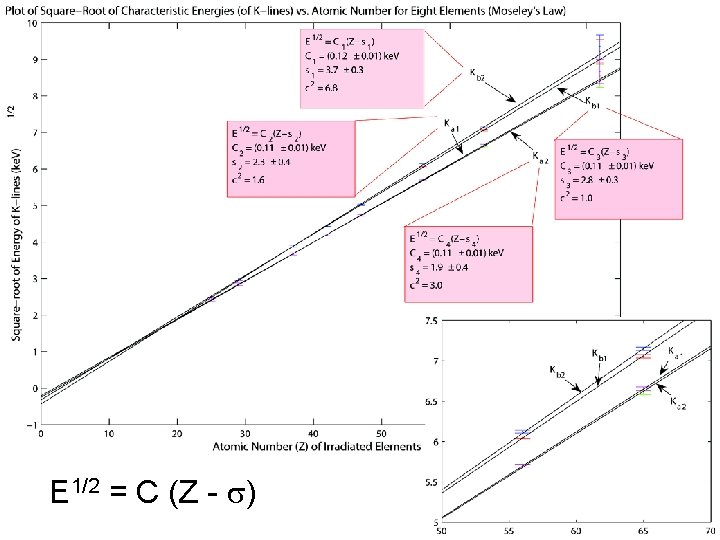
Comparison with Theoretical Model E 1/2 = C (Z - ) K 1 K 2 C predicted 0. 101 0. 110 0. 113 C obtained 0. 11 § 0. 01 0. 12 § 0. 01 Bohr’s simple model of atomic energy levels is a sufficient approximation for the behavior of this system Why does the K line split?

Doublet Separation l Briefly: spin-up and spin-down electrons in same n and l state have slightly different energies! E = C’(Z - ’)4 from Compton and Allison E 1/4 vs. Z fits a linear regression to a 2 of 3. 5

Statement on Error l Dominated by calibration error - a systematic that includes random error l Too few calibration points (Pb) – large error

Conclusions and Applications l K-line emission a result of inner shell electron transitions (to n=1) l Strong quadratic relationship (E vs. Z) Each element – unique K line energies l – l compositional analysis technique Determine atomic numbers of elements – predict the existence of elements


Doublet Separation l j=l+s -- vector sum: total angular momentum E = R 2(Z - )4 / hn 3 l(l+1)

Relative Intensities Statistical weight: 2 j + 1 for n = 1 state transitions: Relative intensity = ratio of statistical weights K-alpha: 4/2 = 2

Germanium Solid State Detector l l l p-type doping: impurities that only makes 3 bonds w/ Ge, leaving a charge carrying hole n-type doping: impurities that want to make 5 bonds, unsaturated, charge carrier – adds electron close to conduction band p-n junction, p-part neg wrt n – no current flow – reverse bias.

- Slides: 24