CHAPTER FOUR Longterm financial planning and corporate growth


- Slides: 47
CHAPTER FOUR Long-term financial planning and corporate growth Copyright © 2017 Mc. Graw-Hill Education (Australia) Pty Ltd PPTs to accompany Fundamentals of Corporate Finance 7 e by Ross et al. 2 -1
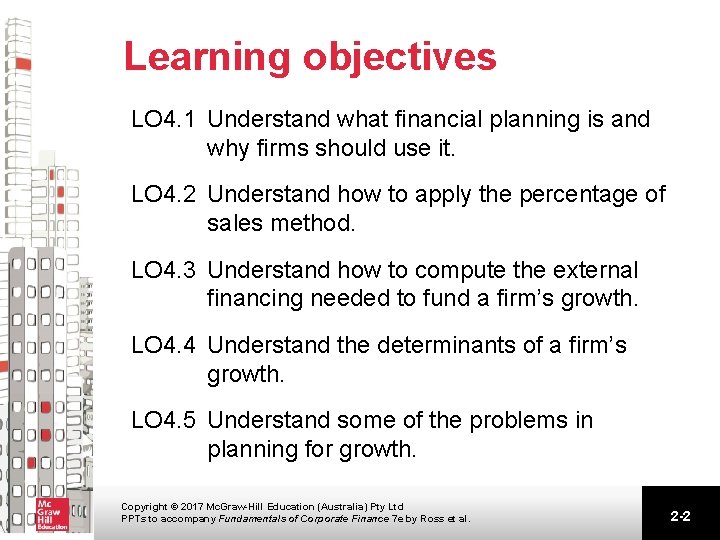
Learning objectives LO 4. 1 Understand what financial planning is and why firms should use it. LO 4. 2 Understand how to apply the percentage of sales method. LO 4. 3 Understand how to compute the external financing needed to fund a firm’s growth. LO 4. 4 Understand the determinants of a firm’s growth. LO 4. 5 Understand some of the problems in planning for growth. Copyright © 2017 Mc. Graw-Hill Education (Australia) Pty Ltd PPTs to accompany Fundamentals of Corporate Finance 7 e by Ross et al. 2 -2
Chapter organisation • • • What is financial planning? Financial planning models: a first look The percentage of sales approach External financing and growth Some caveats of financial planning models Summary and conclusions Copyright © 2017 Mc. Graw-Hill Education (Australia) Pty Ltd PPTs to accompany Fundamentals of Corporate Finance 7 e by Ross et al. 2 -3
What is financial planning? • Formulates the way financial goals are to be achieved. • Requires that decisions be made about an uncertain future. • Recall that the goal of the firm is to maximise the market value of the owner’s equity. If a frim is successful in doing this, growth will usually result. continued Copyright © 2017 Mc. Graw-Hill Education (Australia) Pty Ltd PPTs to accompany Fundamentals of Corporate Finance 7 e by Ross et al. 2 -4
What is financial planning? • The basic policy elements of financial planning are: – the firm’s needed investment in new assets – the degree of financial leverage the firm chooses to employ – the amount of cash the firm thinks it is necessary and appropriate to pay shareholders – the amount of liquidity and working capital the firm needs on an ongoing basis. Copyright © 2017 Mc. Graw-Hill Education (Australia) Pty Ltd PPTs to accompany Fundamentals of Corporate Finance 7 e by Ross et al. 2 -5
Important questions • It is important to remember that we are working with accounting numbers, and we should ask ourselves some important questions as we go through the planning process. For example: – How does our plan affect the timing and risk of our cash flows? – Does the plan point out inconsistencies in our goals? – If we follow this plan, will we maximise owners’ wealth? Copyright © 2017 Mc. Graw-Hill Education (Australia) Pty Ltd PPTs to accompany Fundamentals of Corporate Finance 7 e by Ross et al. 2 -6
Dimensions of financial planning • The planning horizon is the long-range period that the process focuses on (usually two to five years). • Aggregation is the process by which the smaller investment proposals of each of a firm’s operational units are added up and treated as one big project. • Financial planning usually requires three alternative plans: a worst case, a normal case and a best case. Copyright © 2017 Mc. Graw-Hill Education (Australia) Pty Ltd PPTs to accompany Fundamentals of Corporate Finance 7 e by Ross et al. 2 -7
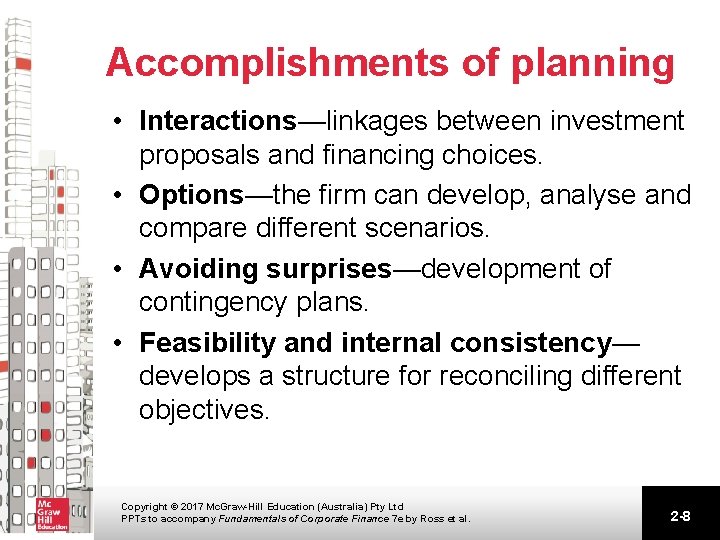
Accomplishments of planning • Interactions—linkages between investment proposals and financing choices. • Options—the firm can develop, analyse and compare different scenarios. • Avoiding surprises—development of contingency plans. • Feasibility and internal consistency— develops a structure for reconciling different objectives. Copyright © 2017 Mc. Graw-Hill Education (Australia) Pty Ltd PPTs to accompany Fundamentals of Corporate Finance 7 e by Ross et al. 2 -8
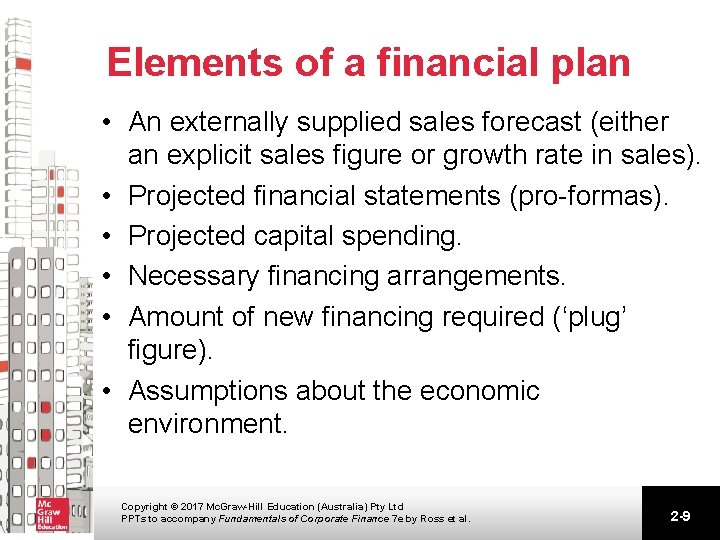
Elements of a financial plan • An externally supplied sales forecast (either an explicit sales figure or growth rate in sales). • Projected financial statements (pro-formas). • Projected capital spending. • Necessary financing arrangements. • Amount of new financing required (‘plug’ figure). • Assumptions about the economic environment. Copyright © 2017 Mc. Graw-Hill Education (Australia) Pty Ltd PPTs to accompany Fundamentals of Corporate Finance 7 e by Ross et al. 2 -9
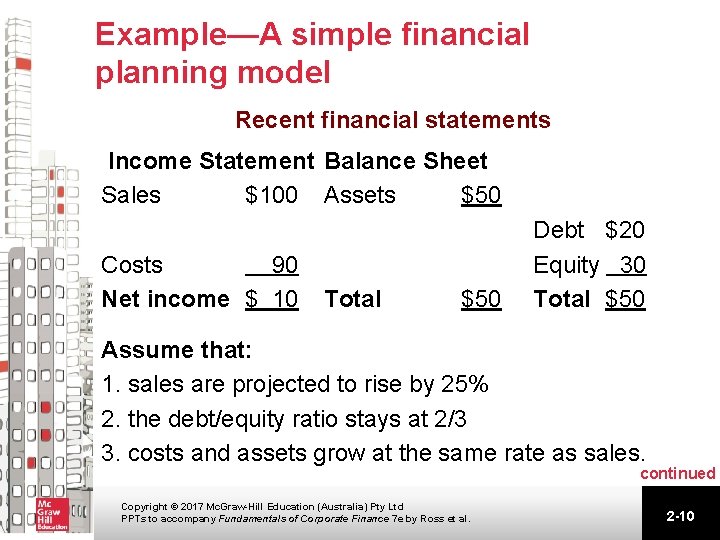
Example—A simple financial planning model Recent financial statements Income Statement Balance Sheet Sales $100 Assets $50 Costs 90 Net income $ 10 Total $50 Debt $20 Equity 30 Total $50 Assume that: 1. sales are projected to rise by 25% 2. the debt/equity ratio stays at 2/3 3. costs and assets grow at the same rate as sales. continued Copyright © 2017 Mc. Graw-Hill Education (Australia) Pty Ltd PPTs to accompany Fundamentals of Corporate Finance 7 e by Ross et al. 2 -10
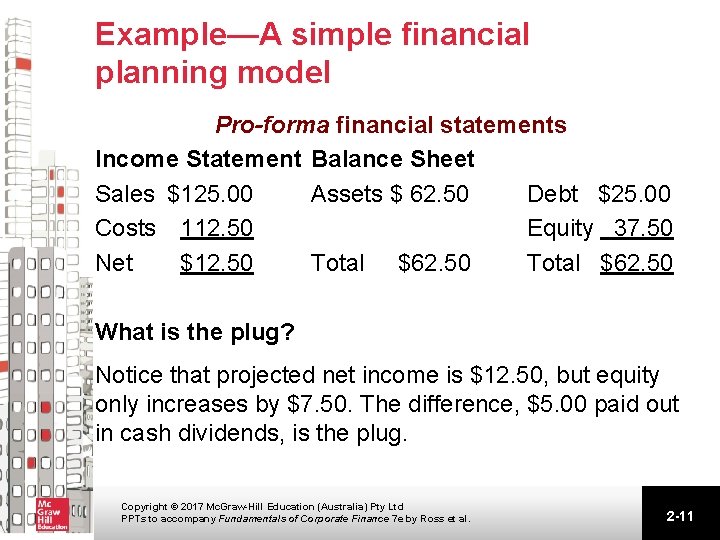
Example—A simple financial planning model Pro-forma financial statements Income Statement Balance Sheet Sales $125. 00 Assets $ 62. 50 Debt $25. 00 Costs 112. 50 Equity 37. 50 Net $12. 50 Total $62. 50 What is the plug? Notice that projected net income is $12. 50, but equity only increases by $7. 50. The difference, $5. 00 paid out in cash dividends, is the plug. Copyright © 2017 Mc. Graw-Hill Education (Australia) Pty Ltd PPTs to accompany Fundamentals of Corporate Finance 7 e by Ross et al. 2 -11
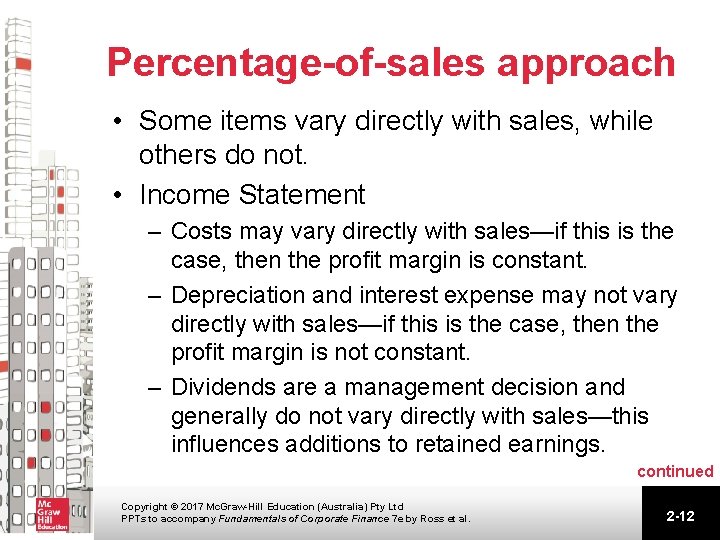
Percentage-of-sales approach • Some items vary directly with sales, while others do not. • Income Statement – Costs may vary directly with sales—if this is the case, then the profit margin is constant. – Depreciation and interest expense may not vary directly with sales—if this is the case, then the profit margin is not constant. – Dividends are a management decision and generally do not vary directly with sales—this influences additions to retained earnings. continued Copyright © 2017 Mc. Graw-Hill Education (Australia) Pty Ltd PPTs to accompany Fundamentals of Corporate Finance 7 e by Ross et al. 2 -12
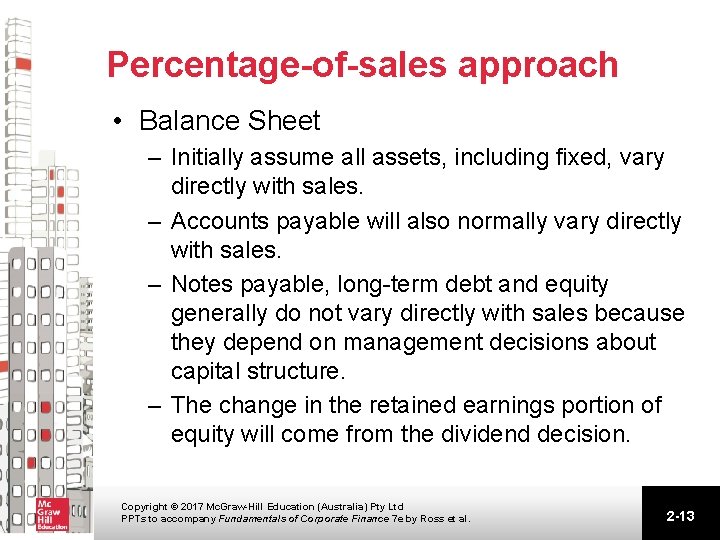
Percentage-of-sales approach • Balance Sheet – Initially assume all assets, including fixed, vary directly with sales. – Accounts payable will also normally vary directly with sales. – Notes payable, long-term debt and equity generally do not vary directly with sales because they depend on management decisions about capital structure. – The change in the retained earnings portion of equity will come from the dividend decision. Copyright © 2017 Mc. Graw-Hill Education (Australia) Pty Ltd PPTs to accompany Fundamentals of Corporate Finance 7 e by Ross et al. 2 -13
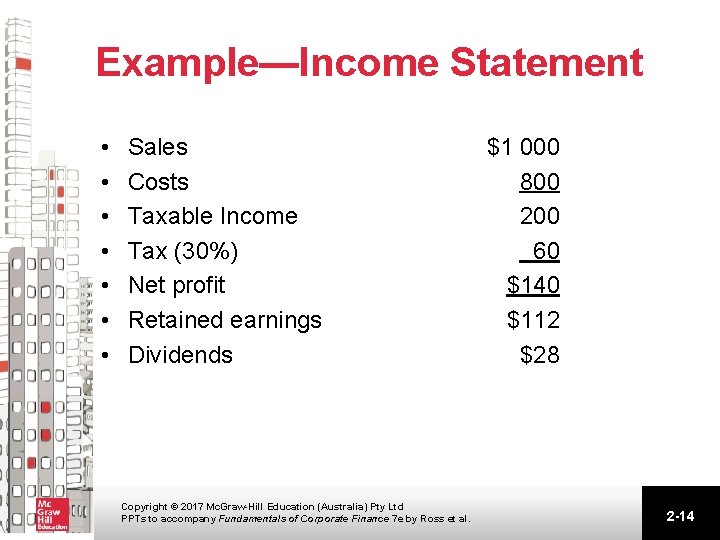
Example—Income Statement • • Sales Costs Taxable Income Tax (30%) Net profit Retained earnings Dividends Copyright © 2017 Mc. Graw-Hill Education (Australia) Pty Ltd PPTs to accompany Fundamentals of Corporate Finance 7 e by Ross et al. $1 000 800 200 60 $140 $112 $28 2 -14
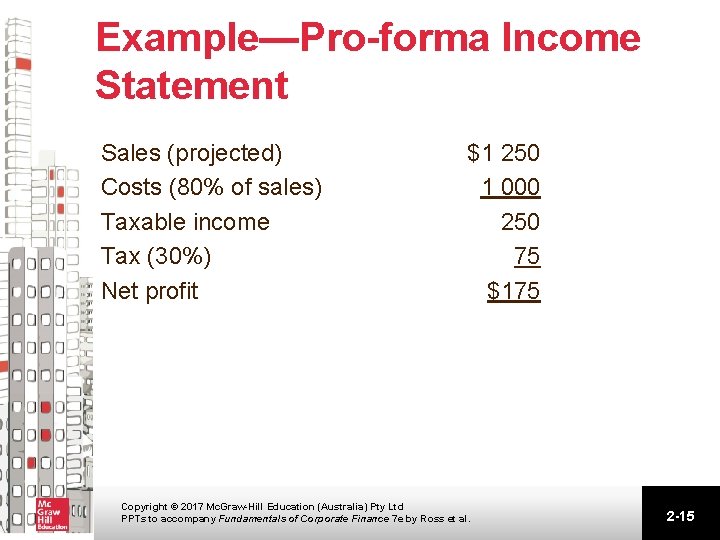
Example—Pro-forma Income Statement Sales (projected) Costs (80% of sales) Taxable income Tax (30%) Net profit $1 250 1 000 250 75 $175 Copyright © 2017 Mc. Graw-Hill Education (Australia) Pty Ltd PPTs to accompany Fundamentals of Corporate Finance 7 e by Ross et al. 2 -15
Example—Steps • Use the original Income Statement to create a pro-forma; some items will vary directly with sales. • Calculate the projected addition to retained earnings and the projected dividends paid to shareholders. • Calculate the capital intensity ratio. Copyright © 2017 Mc. Graw-Hill Education (Australia) Pty Ltd PPTs to accompany Fundamentals of Corporate Finance 7 e by Ross et al. 2 -16
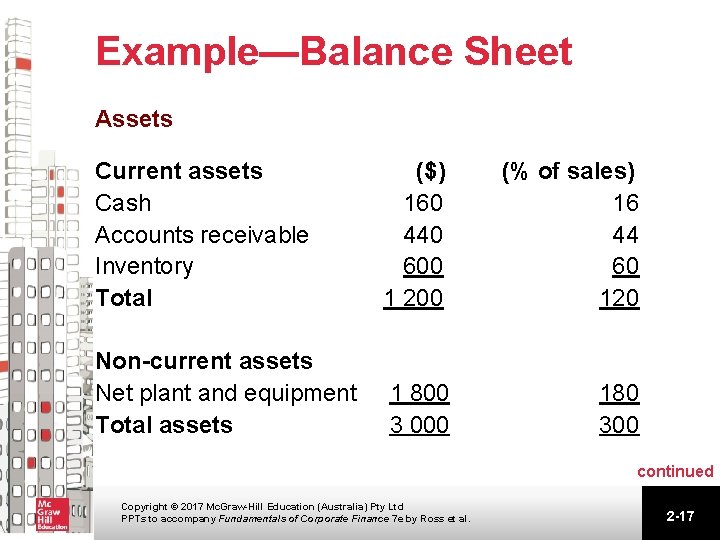
Example—Balance Sheet Assets Current assets Cash Accounts receivable Inventory Total ($) 160 440 600 1 200 (% of sales) 16 44 60 120 Non-current assets Net plant and equipment Total assets 1 800 3 000 180 300 continued Copyright © 2017 Mc. Graw-Hill Education (Australia) Pty Ltd PPTs to accompany Fundamentals of Corporate Finance 7 e by Ross et al. 2 -17
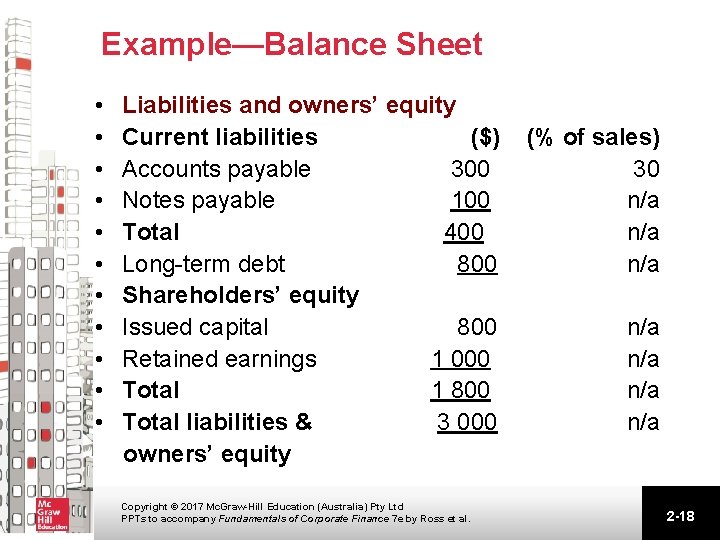
Example—Balance Sheet • • • Liabilities and owners’ equity Current liabilities ($) Accounts payable 300 Notes payable 100 Total 400 Long-term debt 800 Shareholders’ equity Issued capital 800 Retained earnings 1 000 Total 1 800 Total liabilities & 3 000 owners’ equity Copyright © 2017 Mc. Graw-Hill Education (Australia) Pty Ltd PPTs to accompany Fundamentals of Corporate Finance 7 e by Ross et al. (% of sales) 30 n/a n/a 2 -18
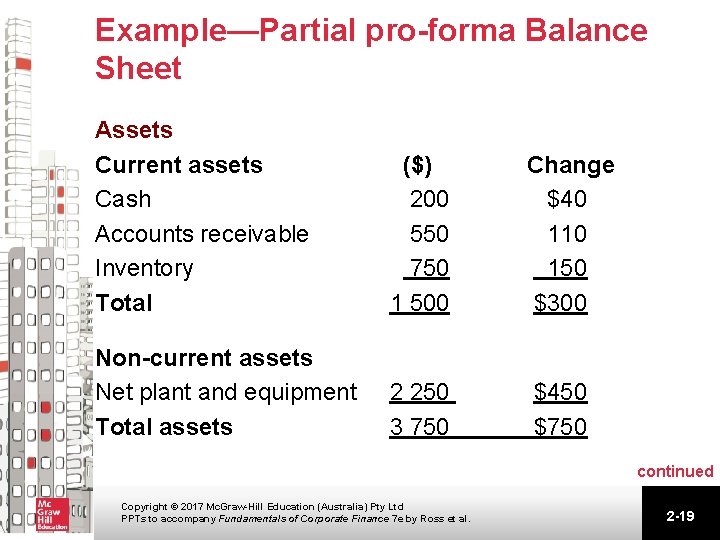
Example—Partial pro-forma Balance Sheet Assets Current assets Cash Accounts receivable Inventory Total ($) 200 550 750 1 500 Change $40 110 150 $300 Non-current assets Net plant and equipment Total assets 2 250 3 750 $450 $750 continued Copyright © 2017 Mc. Graw-Hill Education (Australia) Pty Ltd PPTs to accompany Fundamentals of Corporate Finance 7 e by Ross et al. 2 -19
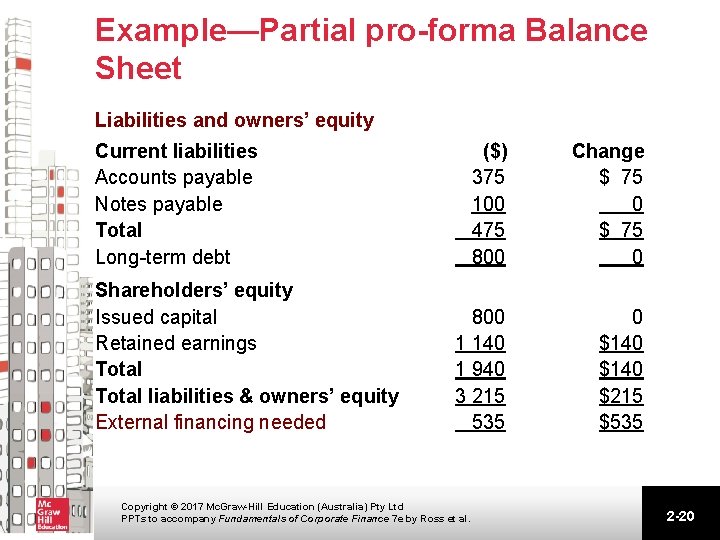
Example—Partial pro-forma Balance Sheet Liabilities and owners’ equity Current liabilities Accounts payable Notes payable Total Long-term debt Shareholders’ equity Issued capital Retained earnings Total liabilities & owners’ equity External financing needed ($) 375 100 475 800 Change $ 75 0 800 1 140 1 940 3 215 535 0 $140 $215 $535 Copyright © 2017 Mc. Graw-Hill Education (Australia) Pty Ltd PPTs to accompany Fundamentals of Corporate Finance 7 e by Ross et al. 2 -20
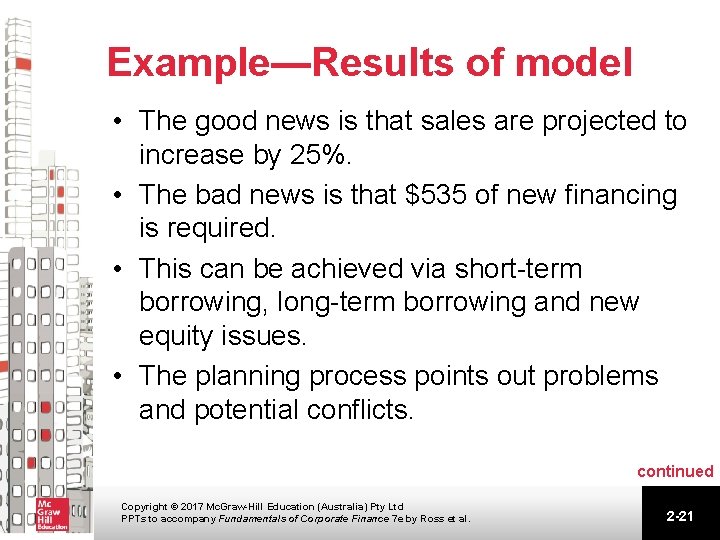
Example—Results of model • The good news is that sales are projected to increase by 25%. • The bad news is that $535 of new financing is required. • This can be achieved via short-term borrowing, long-term borrowing and new equity issues. • The planning process points out problems and potential conflicts. continued Copyright © 2017 Mc. Graw-Hill Education (Australia) Pty Ltd PPTs to accompany Fundamentals of Corporate Finance 7 e by Ross et al. 2 -21
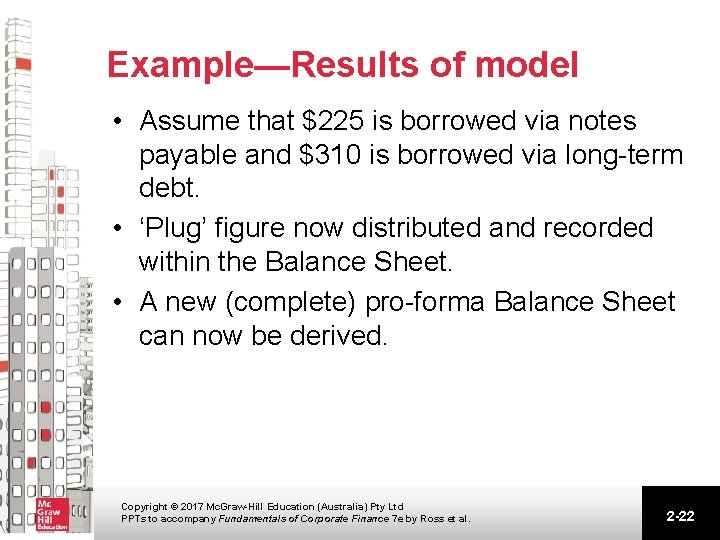
Example—Results of model • Assume that $225 is borrowed via notes payable and $310 is borrowed via long-term debt. • ‘Plug’ figure now distributed and recorded within the Balance Sheet. • A new (complete) pro-forma Balance Sheet can now be derived. Copyright © 2017 Mc. Graw-Hill Education (Australia) Pty Ltd PPTs to accompany Fundamentals of Corporate Finance 7 e by Ross et al. 2 -22
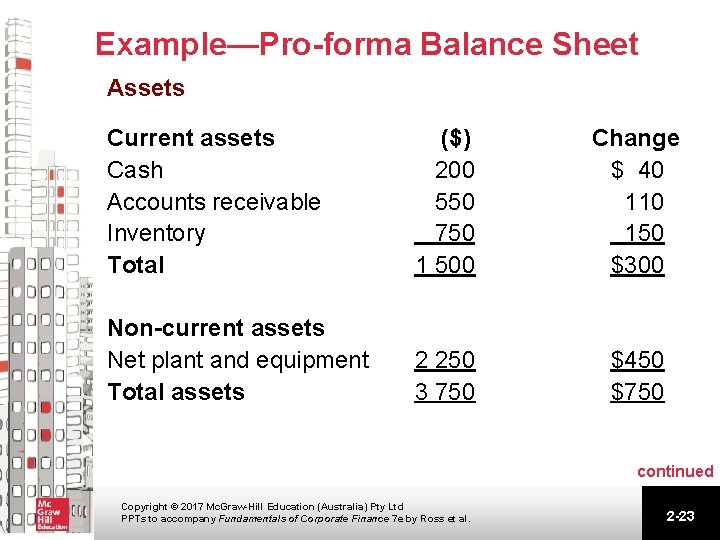
Example—Pro-forma Balance Sheet Assets Current assets Cash Accounts receivable Inventory Total ($) 200 550 750 1 500 Change $ 40 110 150 $300 Non-current assets Net plant and equipment Total assets 2 250 3 750 $450 $750 continued Copyright © 2017 Mc. Graw-Hill Education (Australia) Pty Ltd PPTs to accompany Fundamentals of Corporate Finance 7 e by Ross et al. 2 -23
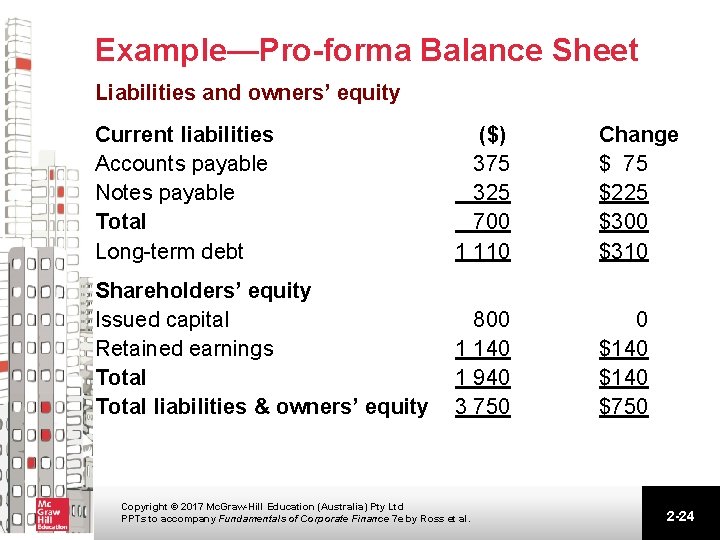
Example—Pro-forma Balance Sheet Liabilities and owners’ equity Current liabilities Accounts payable Notes payable Total Long-term debt ($) 375 325 700 1 110 Change $ 75 $225 $300 $310 Shareholders’ equity Issued capital Retained earnings Total liabilities & owners’ equity 800 1 140 1 940 3 750 0 $140 $750 Copyright © 2017 Mc. Graw-Hill Education (Australia) Pty Ltd PPTs to accompany Fundamentals of Corporate Finance 7 e by Ross et al. 2 -24
External financing and growth • The higher the rate of growth in sales or assets, the greater the external financing needed (EFN). • Growth is simply a convenient means of examining the interactions between investment and financing decisions. In effect, the use of growth as a basis for planning is just a reflection of the high level of aggregation used in the planning process. • Need to establish a relationship between EFN and growth (g). Copyright © 2017 Mc. Graw-Hill Education (Australia) Pty Ltd PPTs to accompany Fundamentals of Corporate Finance 7 e by Ross et al. 2 -25
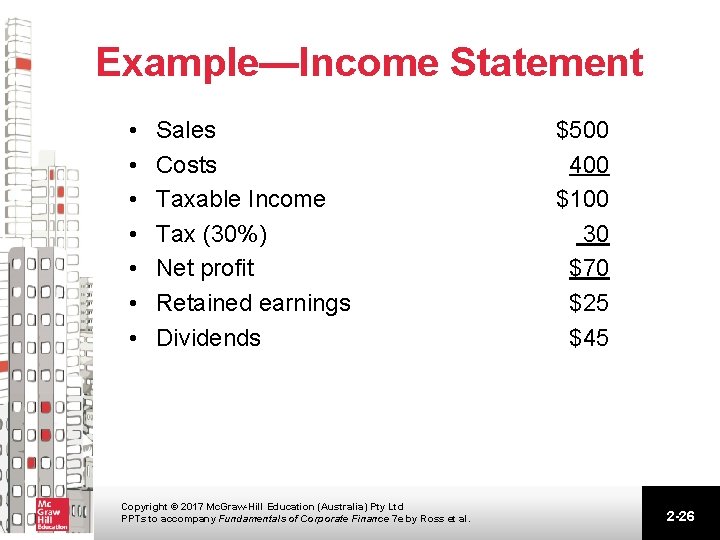
Example—Income Statement • • Sales Costs Taxable Income Tax (30%) Net profit Retained earnings Dividends Copyright © 2017 Mc. Graw-Hill Education (Australia) Pty Ltd PPTs to accompany Fundamentals of Corporate Finance 7 e by Ross et al. $500 400 $100 30 $70 $25 $45 2 -26
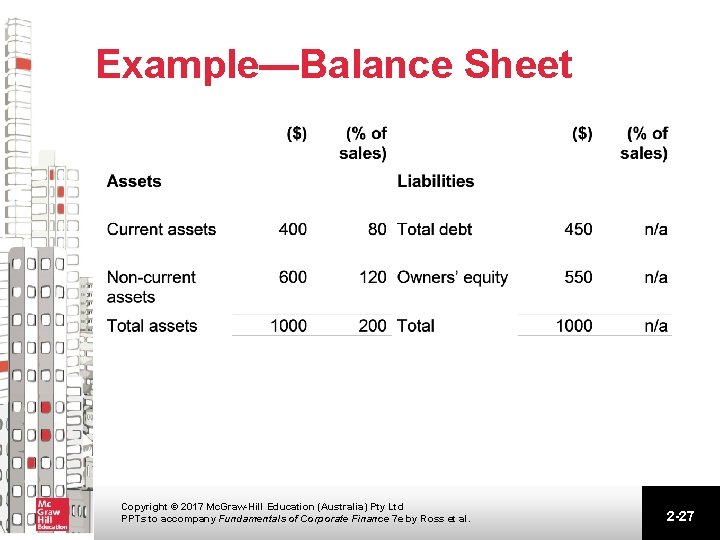
Example—Balance Sheet Copyright © 2017 Mc. Graw-Hill Education (Australia) Pty Ltd PPTs to accompany Fundamentals of Corporate Finance 7 e by Ross et al. 2 -27
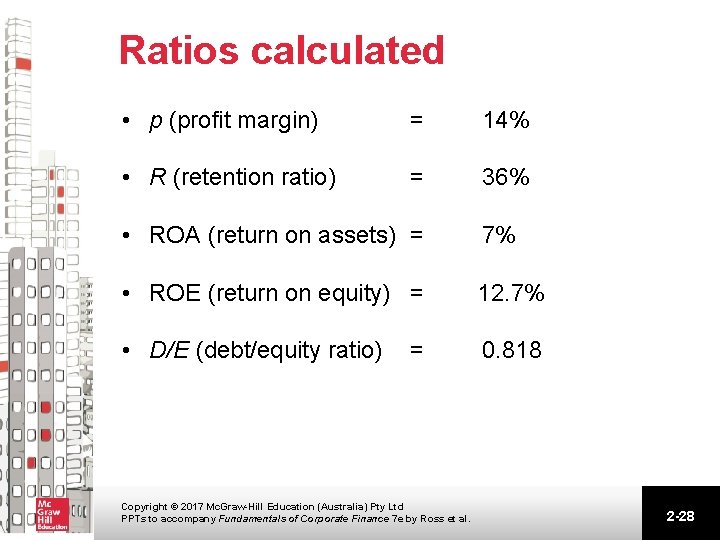
Ratios calculated • p (profit margin) = 14% • R (retention ratio) = 36% • ROA (return on assets) = 7% • ROE (return on equity) = 12. 7% • D/E (debt/equity ratio) 0. 818 = Copyright © 2017 Mc. Graw-Hill Education (Australia) Pty Ltd PPTs to accompany Fundamentals of Corporate Finance 7 e by Ross et al. 2 -28
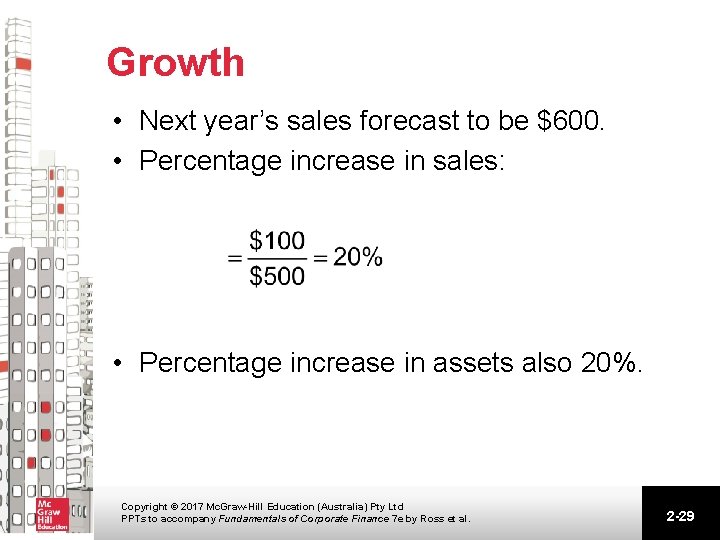
Growth • Next year’s sales forecast to be $600. • Percentage increase in sales: • Percentage increase in assets also 20%. Copyright © 2017 Mc. Graw-Hill Education (Australia) Pty Ltd PPTs to accompany Fundamentals of Corporate Finance 7 e by Ross et al. 2 -29
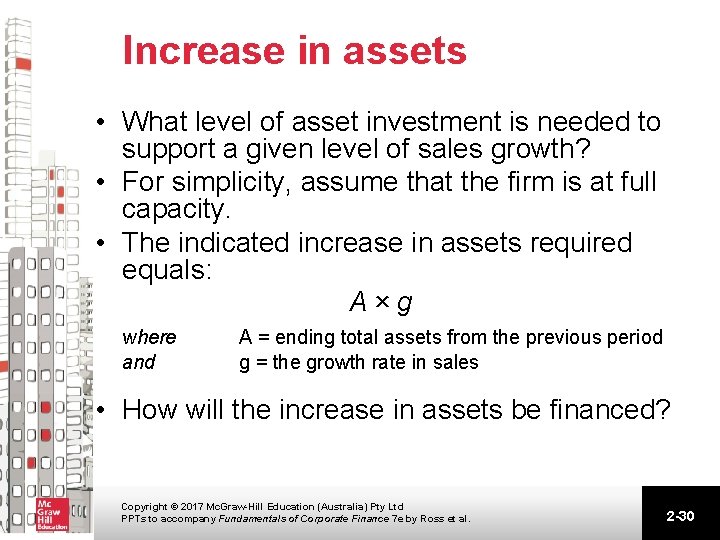
Increase in assets • What level of asset investment is needed to support a given level of sales growth? • For simplicity, assume that the firm is at full capacity. • The indicated increase in assets required equals: A×g where and A = ending total assets from the previous period g = the growth rate in sales • How will the increase in assets be financed? Copyright © 2017 Mc. Graw-Hill Education (Australia) Pty Ltd PPTs to accompany Fundamentals of Corporate Finance 7 e by Ross et al. 2 -30
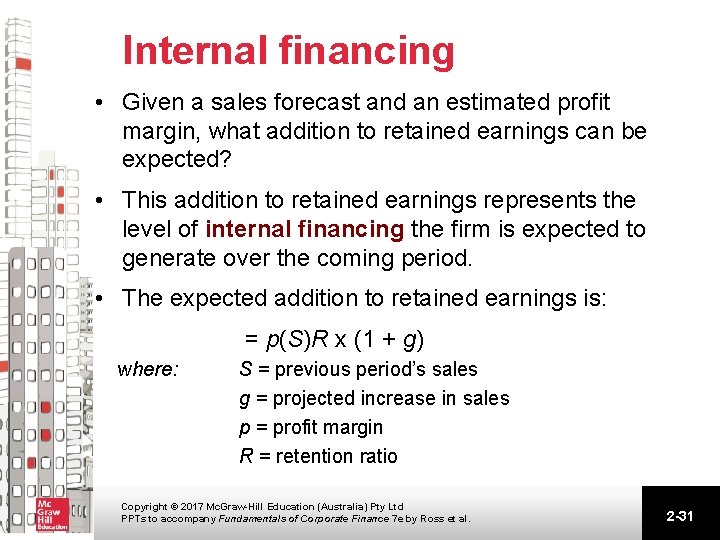
Internal financing • Given a sales forecast and an estimated profit margin, what addition to retained earnings can be expected? • This addition to retained earnings represents the level of internal financing the firm is expected to generate over the coming period. • The expected addition to retained earnings is: = p(S)R x (1 + g) where: S = previous period’s sales g = projected increase in sales p = profit margin R = retention ratio Copyright © 2017 Mc. Graw-Hill Education (Australia) Pty Ltd PPTs to accompany Fundamentals of Corporate Finance 7 e by Ross et al. 2 -31
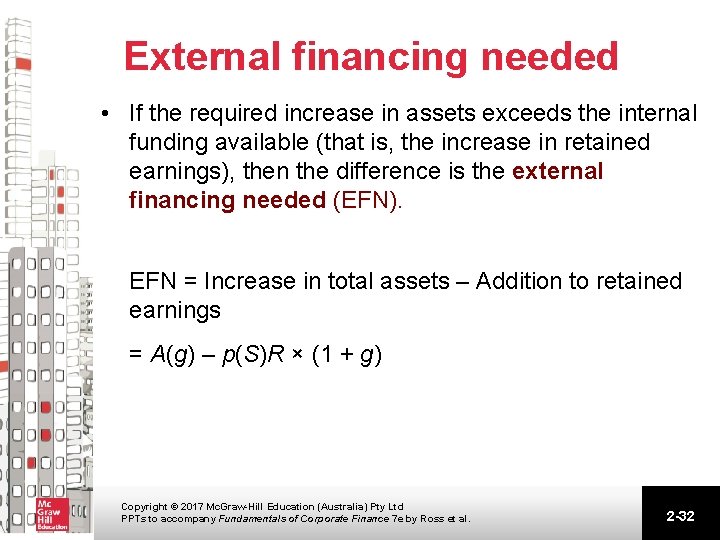
External financing needed • If the required increase in assets exceeds the internal funding available (that is, the increase in retained earnings), then the difference is the external financing needed (EFN). EFN = Increase in total assets – Addition to retained earnings = A(g) – p(S)R × (1 + g) Copyright © 2017 Mc. Graw-Hill Education (Australia) Pty Ltd PPTs to accompany Fundamentals of Corporate Finance 7 e by Ross et al. 2 -32
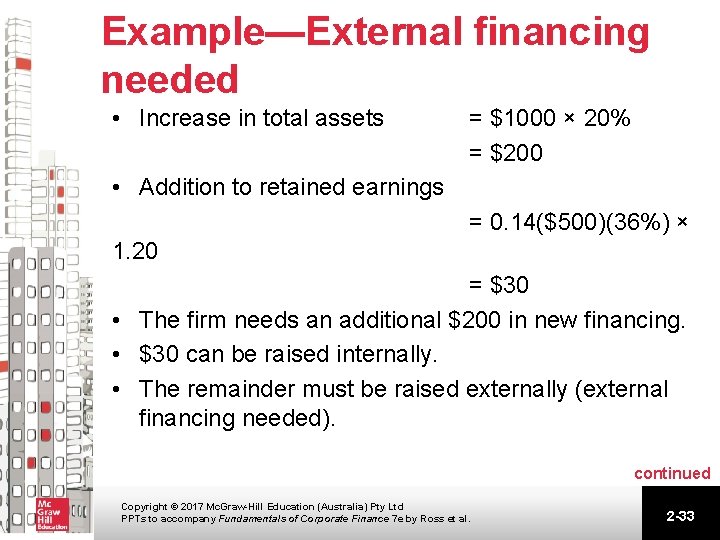
Example—External financing needed • Increase in total assets = $1000 × 20% = $200 • Addition to retained earnings = 0. 14($500)(36%) × 1. 20 = $30 • The firm needs an additional $200 in new financing. • $30 can be raised internally. • The remainder must be raised externally (external financing needed). continued Copyright © 2017 Mc. Graw-Hill Education (Australia) Pty Ltd PPTs to accompany Fundamentals of Corporate Finance 7 e by Ross et al. 2 -33
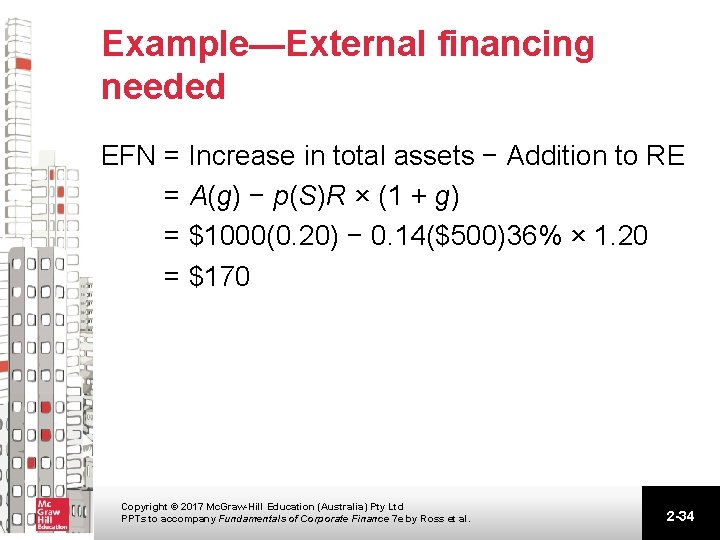
Example—External financing needed EFN = Increase in total assets − Addition to RE = A(g) − p(S)R × (1 + g) = $1000(0. 20) − 0. 14($500)36% × 1. 20 = $170 Copyright © 2017 Mc. Graw-Hill Education (Australia) Pty Ltd PPTs to accompany Fundamentals of Corporate Finance 7 e by Ross et al. 2 -34
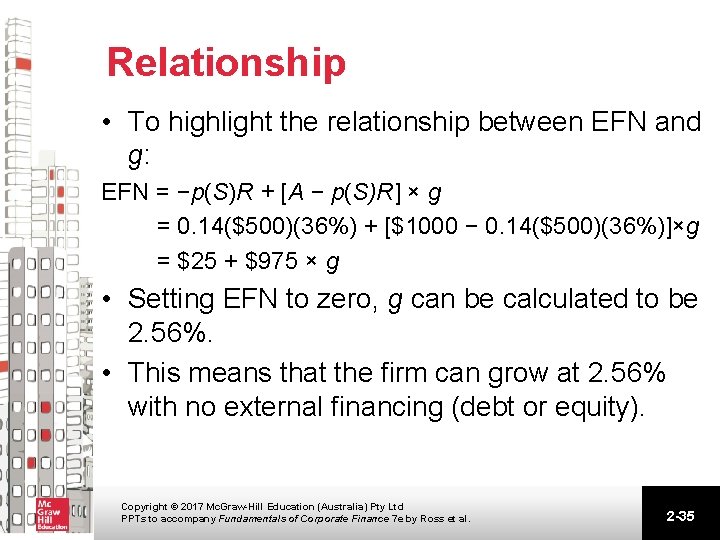
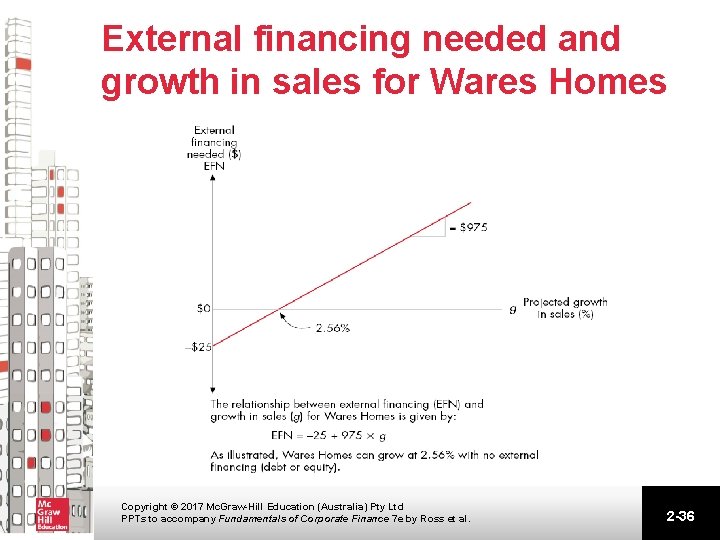
Relationship • To highlight the relationship between EFN and g: EFN = −p(S)R + [A − p(S)R] × g = 0. 14($500)(36%) + [$1000 − 0. 14($500)(36%)]×g = $25 + $975 × g • Setting EFN to zero, g can be calculated to be 2. 56%. • This means that the firm can grow at 2. 56% with no external financing (debt or equity). Copyright © 2017 Mc. Graw-Hill Education (Australia) Pty Ltd PPTs to accompany Fundamentals of Corporate Finance 7 e by Ross et al. 2 -35
External financing needed and growth in sales for Wares Homes Copyright © 2017 Mc. Graw-Hill Education (Australia) Pty Ltd PPTs to accompany Fundamentals of Corporate Finance 7 e by Ross et al. 2 -36
Financial policy and growth • The example so far sees equity increase (via retained earnings), debt remain constant and D/E decline. • If D/E declines, the firm has excess debt capacity. • If the firm borrows up to its debt capacity, what growth can be achieved? Copyright © 2017 Mc. Graw-Hill Education (Australia) Pty Ltd PPTs to accompany Fundamentals of Corporate Finance 7 e by Ross et al. 2 -37
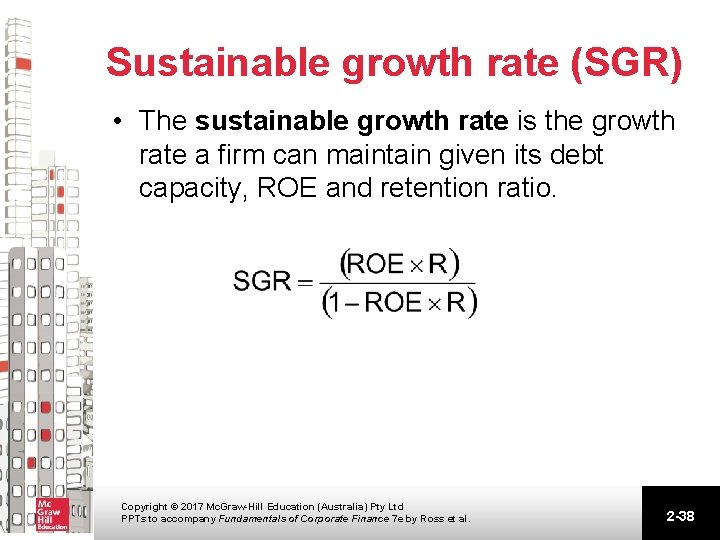
Sustainable growth rate (SGR) • The sustainable growth rate is the growth rate a firm can maintain given its debt capacity, ROE and retention ratio. Copyright © 2017 Mc. Graw-Hill Education (Australia) Pty Ltd PPTs to accompany Fundamentals of Corporate Finance 7 e by Ross et al. 2 -38
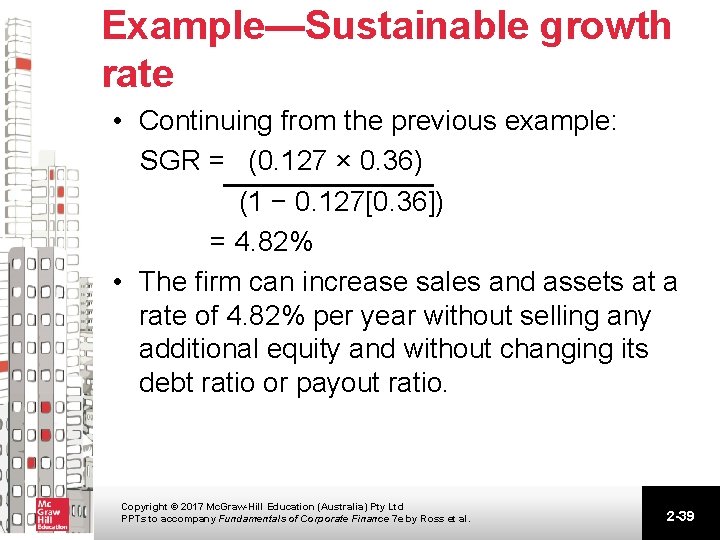
Example—Sustainable growth rate • Continuing from the previous example: SGR = (0. 127 × 0. 36) (1 − 0. 127[0. 36]) = 4. 82% • The firm can increase sales and assets at a rate of 4. 82% per year without selling any additional equity and without changing its debt ratio or payout ratio. Copyright © 2017 Mc. Graw-Hill Education (Australia) Pty Ltd PPTs to accompany Fundamentals of Corporate Finance 7 e by Ross et al. 2 -39
Determinants of growth • Growth rate depends on four factors: – – profitability (profit margin) dividend policy (dividend payout) financial policy (D/E ratio) asset utilisation (total asset turnover). continued Copyright © 2017 Mc. Graw-Hill Education (Australia) Pty Ltd PPTs to accompany Fundamentals of Corporate Finance 7 e by Ross et al. 2 -40
Determinants of growth • If a firm does not wish to sell new equity, and its profit margin, dividend policy, financial policy and total asset turnover (or capital intensity) are all fixed, then there is only one possible growth rate. • Do you see any relationship between the SGR and the Du Pont identity? Copyright © 2017 Mc. Graw-Hill Education (Australia) Pty Ltd PPTs to accompany Fundamentals of Corporate Finance 7 e by Ross et al. 2 -41
Some caveats of financial planning models • Financial planning models tend to rely on accounting relationships and not financial relationships. • Because of this, they sometimes do not produce output that gives the user meaningful clues about what strategies will lead to increases in value. continued Copyright © 2017 Mc. Graw-Hill Education (Australia) Pty Ltd PPTs to accompany Fundamentals of Corporate Finance 7 e by Ross et al. 2 -42
Some caveats of financial planning models • Financial planning is an iterative process, whereby the final plan—which is the result of negotiation—will implicitly contain different goals in different areas, and also satisfy many constraints. Copyright © 2017 Mc. Graw-Hill Education (Australia) Pty Ltd PPTs to accompany Fundamentals of Corporate Finance 7 e by Ross et al. 2 -43
Quick quiz • What is the purpose of long-range planning? • What are the major decision areas involved in developing a plan? • What is the percentage of sales approach? • How do you adjust the model when operating at less than full capacity? • What is the internal growth rate? • What is the sustainable growth rate? • What are the major determinants of growth? Copyright © 2017 Mc. Graw-Hill Education (Australia) Pty Ltd PPTs to accompany Fundamentals of Corporate Finance 7 e by Ross et al. 2 -44
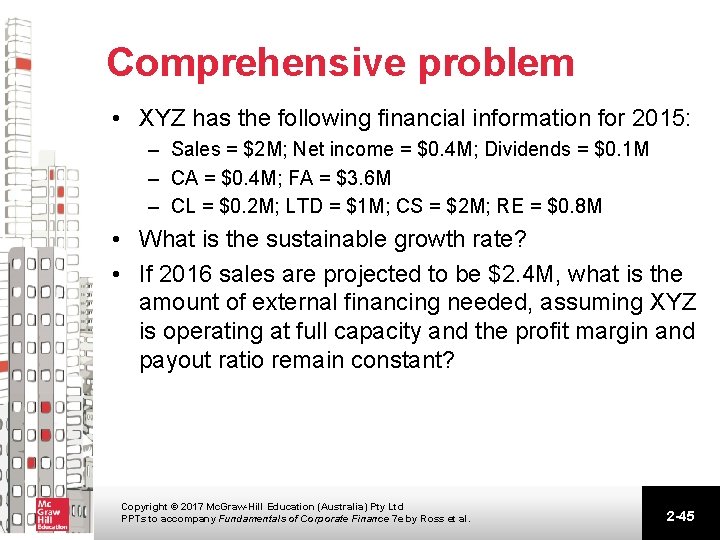
Comprehensive problem • XYZ has the following financial information for 2015: – Sales = $2 M; Net income = $0. 4 M; Dividends = $0. 1 M – CA = $0. 4 M; FA = $3. 6 M – CL = $0. 2 M; LTD = $1 M; CS = $2 M; RE = $0. 8 M • What is the sustainable growth rate? • If 2016 sales are projected to be $2. 4 M, what is the amount of external financing needed, assuming XYZ is operating at full capacity and the profit margin and payout ratio remain constant? Copyright © 2017 Mc. Graw-Hill Education (Australia) Pty Ltd PPTs to accompany Fundamentals of Corporate Finance 7 e by Ross et al. 2 -45
Summary and conclusions • Long-term financial planning forces the firm to think about the future and to anticipate problems before they arrive. • Financial planning establishes guidelines for change and growth in a firm and is concerned with the major elements of a firm’s financial and investment policies. continued Copyright © 2017 Mc. Graw-Hill Education (Australia) Pty Ltd PPTs to accompany Fundamentals of Corporate Finance 7 e by Ross et al. 2 -46
Summary and conclusions • Corporate financial planning should, however, not become a purely mechanical activity. In particular, plans are often formulated in terms of a growth target, with no explicit link to value creation. • The alternative to financial planning is ‘stumbling into the future’. Copyright © 2017 Mc. Graw-Hill Education (Australia) Pty Ltd PPTs to accompany Fundamentals of Corporate Finance 7 e by Ross et al. 2 -47