Chapter 15 Air Pollution and Stratospheric Ozone Depletion


- Slides: 48
Chapter 15 Air Pollution and Stratospheric Ozone Depletion Chattanooga Tennessee, Lookout Mountain
4/10 Agenda Read Opening Story CH 15 Cleaning up in Chattanooga Warm up Do the Math CH 15 Sarah– Current Event Go over Answers for CH 15 MC Study Guide Discuss Lab: Waste & CO 2 Notes CH 15 P. 25 NB Possible AP FRQ CH 14 & 15 Quiz Thursday 2001#4, 2007#1, 2009 #3, 1999#3, 2000#1, 2001#3, 2002#1, 2004#1, 2006#2, 2007#3, 2007 #4, 2008#1, 2009#1, 2010#1
Cleaning Up in Chattanooga Read the story P. 409 ESBK P. 24 NB AXES
4/27 Air Pollutants Review Topic VI CH 15 Obj. TSW identify the major air pollutants and where they come from. P. 52 NB 1. Identify the major air pollutants. 2. Where do each of them come from? 3. How are photochemical smog & acid deposition formed.
• • 4/11 agenda Warm up Pollution Topic 25 – 30% of AP Test Env. Current Events: Amanda, Susan, Sariya, Brianna 4/23 Lab – Waste & CO 2 Production (Data table) p. 25 NB Do the Math CH 14 p. 25 NB Study your FRQ from CH 15 Voc. Sheet Article Bolstering a Link between Alzheimer’s Disease & Lead Exposure p. 23 NB
5/6 Stratospheric Ozone & Indoor Air Pollution CH 15 Obj. TSW learn the benefit of Stratospheric Ozone, how it is formed and the causes and effects of it’s depletion. P. 66 NB 1. What are the equations in the formation and depletion of the closed loop cycle of stratospheric ozone. 2. Explain the causes and effects of stratospheric ozone depletion. 3. Discuss the hazard of indoor air pollution, especially in developing countries.
• • • 11: 42 – 11: 52 Warm Up 12/12 Agenda 11: 52 – 12: 00 Explanation & Answers 12: 00 – 12: 10 Env. Sci. current event: Lupita & Zuzeth 12: 15 turn in NB P. 62 – 69, 53 Lead AXES para, 57 Math-% change, & 59 Data table waste lab 12: 25 start quiz CH 14 & 15 (37 minutes) (Mc. Allister leaves at 12: 40) 1: 02 Finish Quiz Get HW CH 16 & 17 MC & Voc Study Guides CH 16 Due Monday; CH 17 Due Tuesday Topic VI Test Wednesday Dec. 18 th (CH 14 – 17)
5/1 Water & Air Pollution Review CH 14 Obj. TSW discuss thermal, & noise pollution and our Nations water laws. P. 44 NB 1. Discuss what thermal pollution is and a solution to the problem. 2. Why is Noise considered water pollution? 3. What are some of our Nations water laws?
12/8 Agenda • Warm up, pg. 62 • Air Pollution Presentations, pg. • CH 15 Opening Story • Ozone Pollution Video, pg. • HW: • CH 16 MC SG due tomorrow, pg. 61 • CH 16 Vocab due Wednesday, pg. 63 • Bring in card decks and silver spoons!
12/8 Air Pollution CH 15 Obj. TSW identify and describe primary and secondary pollutants, thermal inversion, and smog present their findings on different types of pollutants , pg. 62 1. What is the difference between a primary and secondary pollutant? 2. Describe Thermal Inversion and draw the graph/diagram that go along with it and “normal conditions”. 3. What is smog and what are some approaches to reducing it?
Primary Pollutants © Primary pollutants- polluting compounds that come directly out of the smoke-stack, exhaust pipe, or natural emission source. © Examples: CO, CO 2, SO 2, NOx, and most suspended particulate matter.
Secondary Pollutants © Secondary pollutants- pollutants that have undergone transformation in the presence of sunlight, water, oxygen, or other compounds. © Water and Sunlight involved= does not occur as rapidly at night © Examples: Ozone, sulfate and nitrate
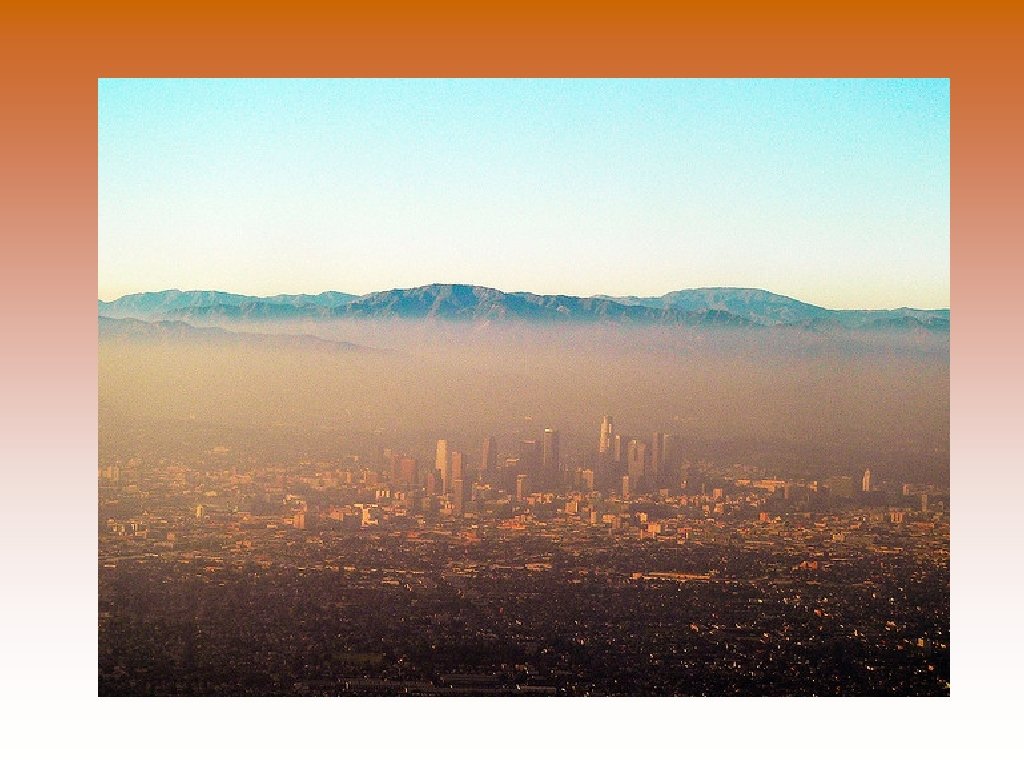
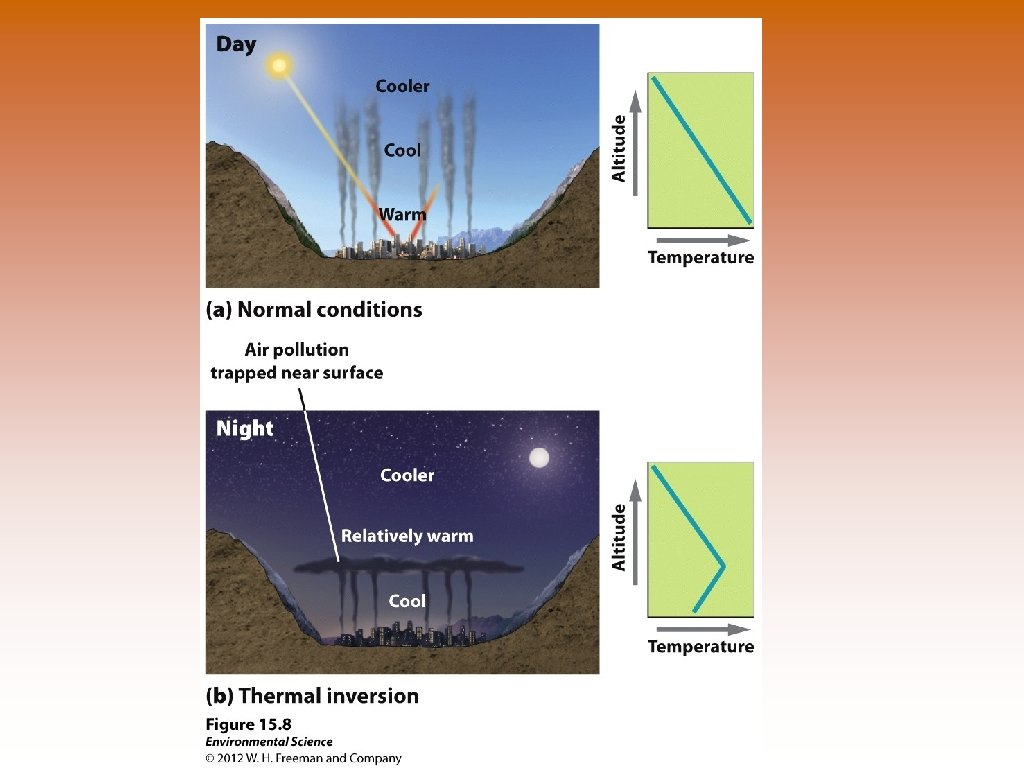
Thermal Inversions © Normal Conditions- Temp. decreases as altitude increases, BUT. . . © Thermal Inversion- when a relatively warm layer of air at mid-altitude covers a layer of cold, dense air below. © The warm inversion layer traps emissions that then accumulate beneath it. © Common in some cities where high concentrations of vehicle exhaust and industrial emissions are easily trapped © EX: ? ?
• • • Smog Combination of smoke and fog Two types: • • Photochemical smog Sulfurous Smog Forms when sunlight, nitrogen oxides, and VOCs are present Impairs respiratory function in human beings Hard to reduce secondary pollutant Focus on primary pollutants that contribute to smog • Reducing VOCs, Nitrogen Oxide emissions
Presentations • • 6 Groups of 3 Include: Symbol, What causes the pollution? Effects/impacts? Solutions? Sulfur Dioxide: Magda, Jonathan, Ellie Nitrogen Oxide: Taylor, Bryan, Brad Carbon Monoxide: Lovpret, Priya, Mandeep Particulate Matter: Rachana, Luis, Monica Lead: Ayat, Matthew, Jeanelle Ozone: Jasmine, Daniela, Joseph
Acid Deposition
Acid Deposition © Acid deposition- occurs when nitrogen oxides and sulfur oxides are released into the atmosphere and combine with atmospheric oxygen and water. These form the secondary pollutants nitric acid and sulfuric acid. © These secondary pollutants further break down into nitrate and sulfate which cause the acid in acid deposition. Hadrian’s Arch- Athens Greece Made of Marble which has calcium carbonate. Dry acid in the air and acid rain deteriorate the monument.
Effects of Acid Deposition © Lowering the p. H of lake water © Decreasing species diversity of aquatic organisms © Mobilizing metals that are found in soils and releasing these into surface waters © Damaging statues, monuments, and buildings
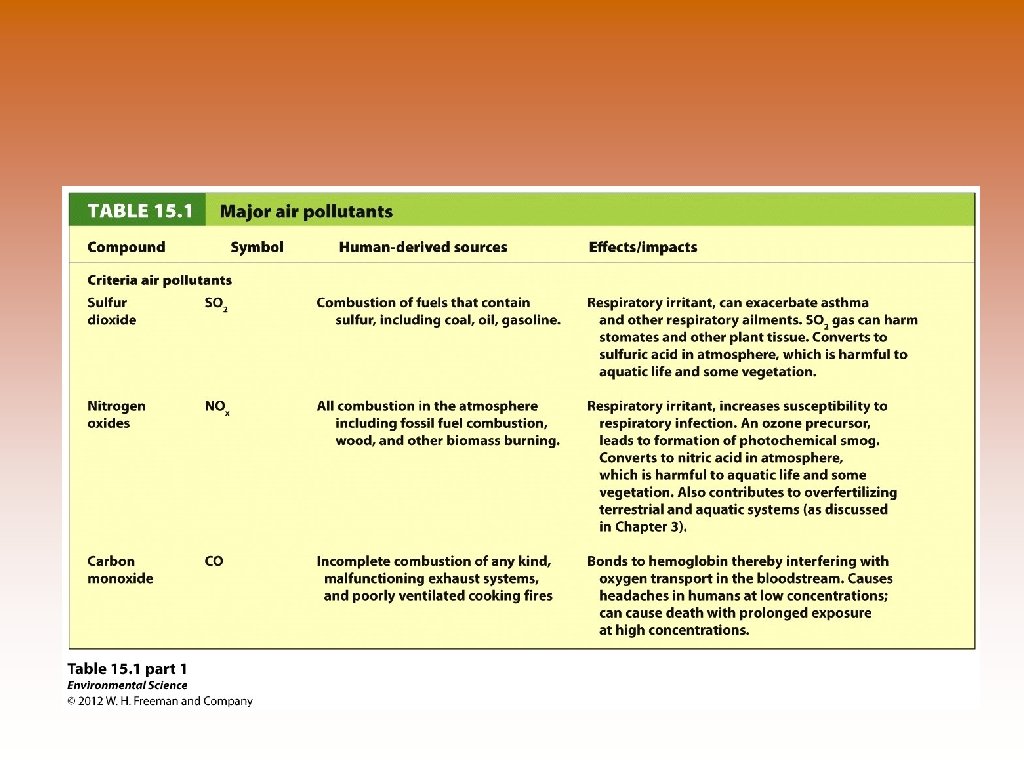
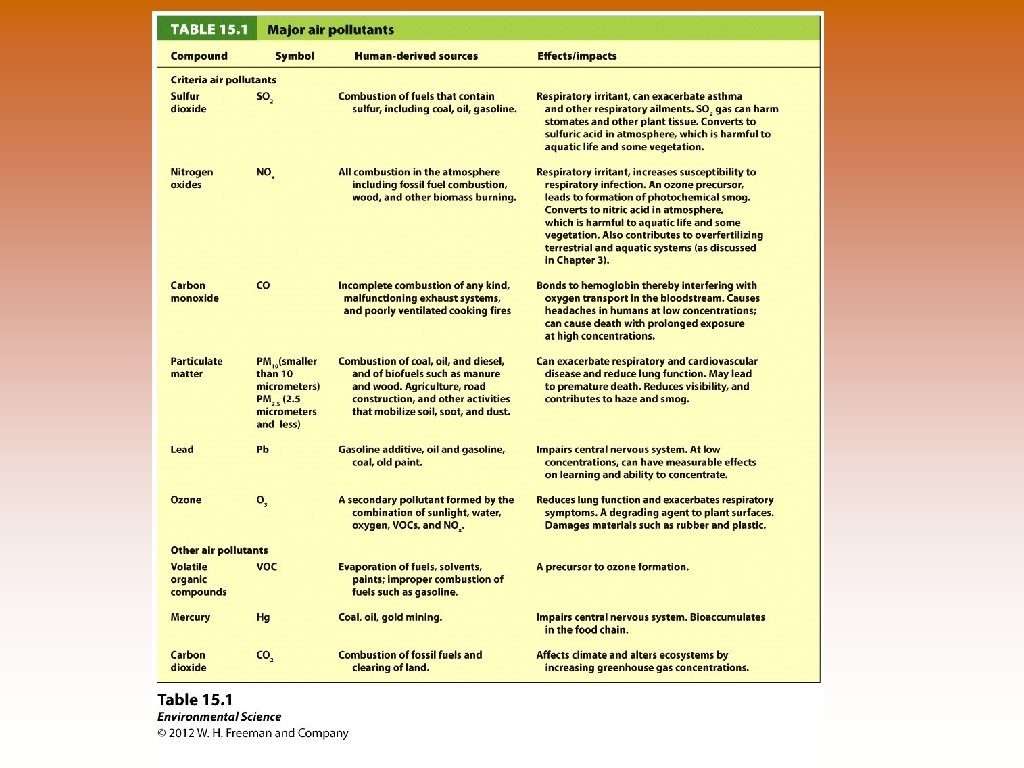
Major Air Pollutants © Sulfur Dioxide © Nitrogen Oxides © Carbon Oxides © Particulate Matter © Volatiles Organic Compounds © Ozone © Lead © Mercury
Thermal Pollution – Nuclear Reactors Empty the water into holding ponds before it returns to the river or lake or ocean. Iceland – Svartsengi Power Plant Solution – to use a cooling tower to reduce the temperature of water by evaporation.
Air Pollution © Air pollution- the introduction of chemicals, particulate matter, or microorganisms into the atmosphere at concentrations high enough to harm plants, animals, and materials such as buildings, or to alter ecosystems.
Major Air Pollutants © Sulfur Dioxide © Nitrogen Oxides © Carbon Oxides © Particulate Matter © Volatiles Organic Compounds © Ozone © Lead © Mercury
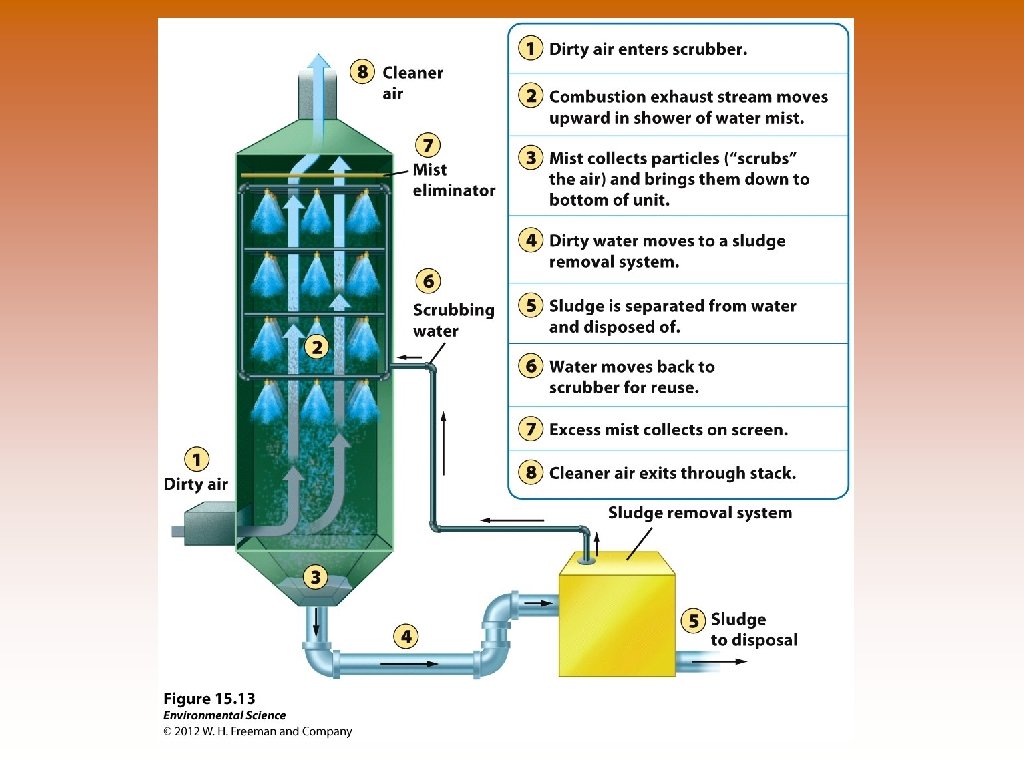
The scrubber Air Pollution control device Uses water droplets over the exhaust stream to create a “sludge” that is collected and processed for disposal.
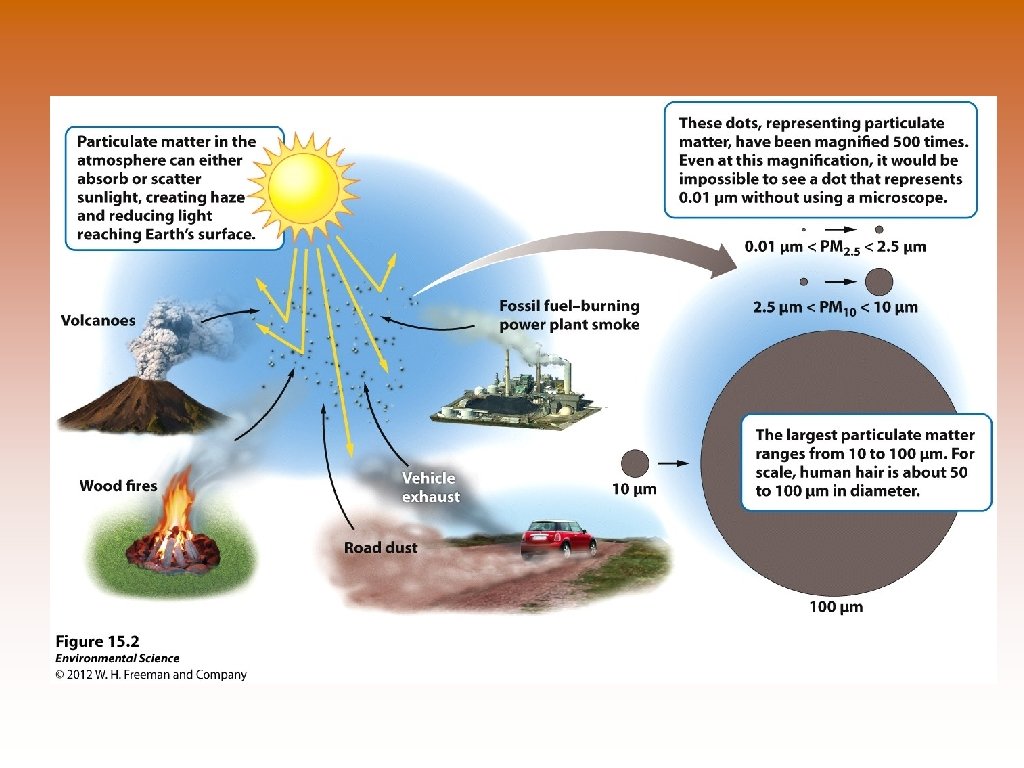
Natural Sources of Air Pollution © Volcanoes © Lightning © Forest fires © Plants
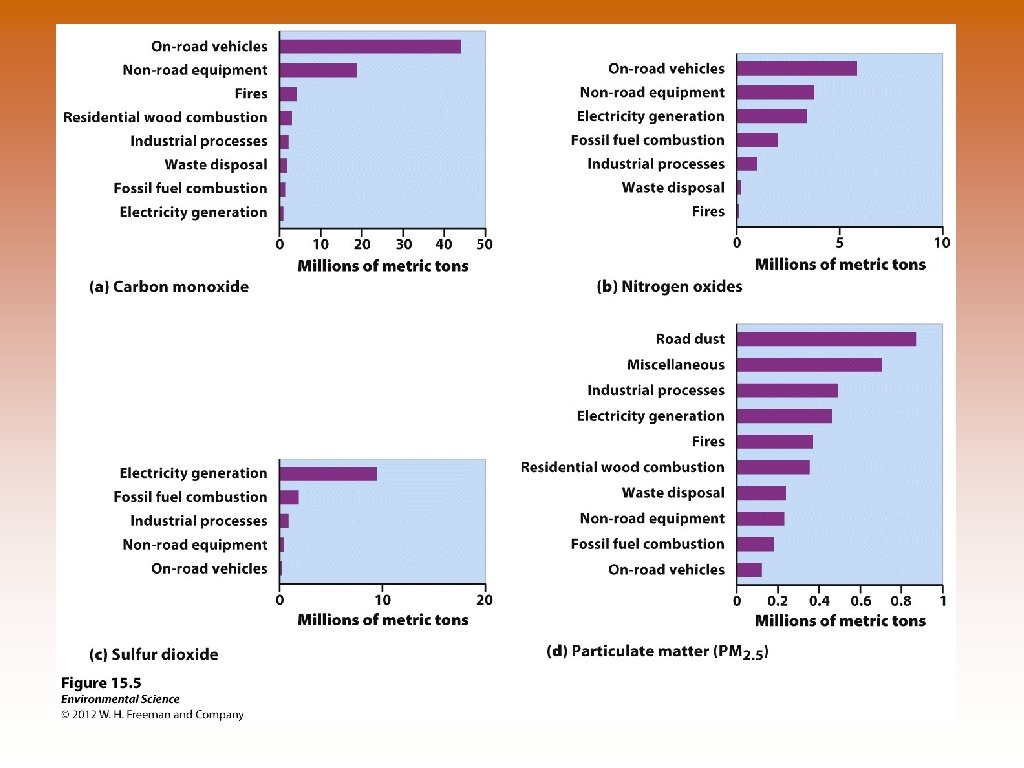
Anthropogenic Sources of Air Pollution © On-road vehicles © Power plants © Industrial processes © Waste disposal
Ways to Prevent Air Pollution © Removing sulfur dioxide from coal by fluidized bed combustion © Catalytic converters on cars © Scrubbers on smoke stacks © Baghouse filters © Electrostatic precipitators
Baghouse Filter Air pollution control device
Electrostatic Precipitator -particles are given a negative charge which causes then to be attracted to a positively charged plate. The particles are collected for disposal.
Stratospheric Ozone © The stratospheric ozone layer exists roughly 45 -60 kilometers above the Earth. © Ozone has the ability to absorb ultraviolet radiation and protect life on Earth. © CFC
Formation and Breakdown of Ozone © First, UV-C radiation breaks the bonds holding together the oxygen molecule ) 2, leaving two free oxygen atoms: O 2 + UV-C -> 2 O © Sometimes the free oxygen atoms result in ozone: O 2 + O -> O 3 © Ozone is broken down into O 2 and free oxygen atoms when it absorbs both UV-C and UV-B ultraviolet light: O 3 + UV-B or UV-C -> O 2 + O
Anthropogenic Contributions to Ozone Destruction © Certain chemicals can break down ozone, particularly chlorine. © The major source of chlorine in the stratosphere is a compound known as chlorofluorocarbons (CFCs) © CFCs are used in refrigeration and air conditioning, as propellants in aerosol cans and as “blowing agents” to inject air into foam products like Styrofoam, foam cushions.
Anthropogenic Contributions to Ozone Destruction © When CFCs are released into the troposphere they make their way to the stratosphere. © The ultraviolet radiation present has enough energy to break the bond connecting chlorine to the CFC molecule. © which can then break apart the ozone molecules.
Anthropogenic Contributions to Ozone Destruction © First, chlorine breaks ozone’s bonds and pulls off one atom of oxygen, forming a chlorine monoxide molecule and O 2: O 3 + Cl -> Cl. O + O 2 © Next, a free oxygen atoms pulls the oxygen atom from Cl. O, liberating the chlorine and creating one oxygen molecule: Cl. O + O -> Cl + O 2 © One chlorine atom can catalyze the breakdown of as many as 100, 000 ozone molecules before it leaves the stratosphere.
Depletion of the Ozone Layer © Global Ozone concentrations had decreased by more than 10%. © Depletion was greatest at the poles © Decreased stratospheric ozone has increased the amount of UV-B radiation that reaches the surface of Earth.
Indoor Air Pollutants Indoor Air Pollution - Zimbabwe © Wood, animal manure or coal used for cooking and heating in developing countries. © Asbestos © Carbon Monoxide © Radon © VOCs in home products
Sources of Indoor Air Pollution
Potential Radon exposure in United States
• • • Do the Math Calculating Annual Sulfur Reductions Calculate the total percentage reduction and the annual percentage reduction of SO 2 emissions. 23. 5 million metric tons – 10. 3 million metric tons -=13. 2 Divide the reduction by the original amount and multiply by 100 to obtain a percent reduction. The total reduction was 56 percent. To calculate the reduction per year divide 56 percent by the number of years from beginning to end: 2008 – 1982 = 26 years 56%/ 26 years = 2. 2%/year
Working Toward Sustainability • A New Cook Stove Design P. 430 ESBK