ASAS QTOF Mass Spectrometers Martin Middleditch ASAS Mass

 • • ~$70 -150 per sample")


- Slides: 16
ASAS Q-TOF Mass Spectrometers Martin Middleditch ASAS Mass Spectrometry Manager
ASAS Q-TOF Mass Spectrometers The QSTAR XL (2003) • • ~$70 -150 per sample Infusion or capillary-scale 1 D or 2 D LC-MS/MS. To be made available for direct access by trained users in 2015 Resolution ~10, 000, mass accuracy ~10 -50 ppm, ~1 MS/MS per sec. Suitable for intact protein MW determinations (+/- 0. 003%), identification of proteins from gel bands, biofluids, solubilised tissue etc, and quantitative comparisons of proteomes using i. TRAQ labelling. The Triple. TOF 6600 (2014) ~$120 -480 per sample Equipped for nanoscale infusion or nano. LC-MS/MS workflows. Resolution ~35 -50, 000, mass accuracy ~2 ppm, up to 100 MS/MS per sec. High speed acquisition rate permits new workflows such as SWATH. Best choice for identifying thousands of proteins per sample, relative quantitation of complex proteomes, and validating any changes in peptide abundance by scheduled MRM workflows. • By mid-July, will also have a Selex. ION Differential Mobility Separation module to separate analytes by their mobility in high and low electric fields. • Future directions: Comprehensive phosphoproteomics, lipidomics (Lipidyzer+Selex. ION), unknown/metabolite identification. • •
Intact Protein MW determinations
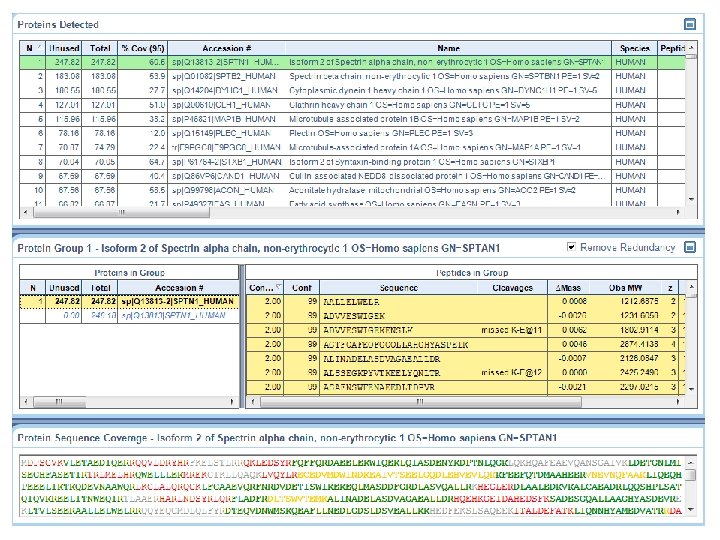
Human Alzheimers Brain on Triple. TOF Base Peak Chromatogram Data searched against all human sequences using Protein. Pilot v 5. 0 MS/MS trace 24, 230 MS/MS spectra 13, 672 peptides identified 1, 619 proteins identified 1 min window of MS/MS trace
MS/MS Spectral Matching
Relative Quantitation Using i. TRAQ Tagging
SWATH Analysis 1. Download or create (by a thorough IDA analysis of a pooled sample), an Ion Library for your species, containing the identification data for 1000 s of proteins. 2. Generate SWATH datasets for each sample by sequentially acquiring MS/MS data on small bins (e. g. 25 Da) of precursors across the entire mass range of interest in every cycle (~2 -5 seconds). 3. Post-acquisition, mine the data from each bin using very narrow extraction windows for the predetermined peptide fragment ion patterns in the ion library. Aebersold et al, 2014 4. Concurrent elution of fragment ions at the expected normalised RT, with the expected relative intensities to one another constitutes the assay data for quantitative comparisons of peptides.
SWATH-MS for Proteomics “…a generic large-scale human assay library to support protein quantification by SWATH-MS. It consists of 1, 164, 312 transitions identifying 139, 449 proteotypic peptides and 10, 316 proteins. Generated by combining the results from 331 measurements of fractions from different cell lines, tissue and affinity enriched protein samples. The assays consist of precursor and fragment ion m/z, normalized RT and relative ion intensities…”
SWATH-MS Proteomic Dataset Aebersold et al, 2013
Illumina’s Base. Space One. Omics Proteomic Tools Use Cloud Computing to process large SWATH-MS datasets. Protein Areas Link Proteomic results to Genomic datasets from the samples. Peptide Areas Transition Areas Can visualise quantitative comparisons at the Protein, Peptide and Transition levels
Selex. ION Differential Mobility Interface Differential Mobility Cell Modified Curtain Plate ESI source Triple. TOF
Selex. ION Differential Mobility Separation ESI source Sample Ions Triple. TOF Abdi, 2013
Lipid Class Separation Using Selex. ION MRM scan of 6 phospholipid standards using Selex. ION with a COV ramp PI PG PS PE PC PA Compensation Voltage Can resolve similar molecules by exploiting differences in their mobility when subjected to alternating high and low electric fields. Different molecules will have different optimal Compensation Voltage (COV) values for their transmission into the MS. Useful for structural isomers that can be difficult to resolve chromatographically, and are impossible to resolve by MS alone due to their identical formula. Abdi, 2013
Selex. ION DMS resolves both Positional and R and S Isomers of Hydroxy-eicosatetrenoate Abdi, 2013
Thank you for your attention