Analysis of Count Data Chapter 24 p p
- Slides: 46
Analysis of Count Data Chapter 24 p p Goodness of fit Formulas and models for two-way tables - tests for independence - tests of homogeneity
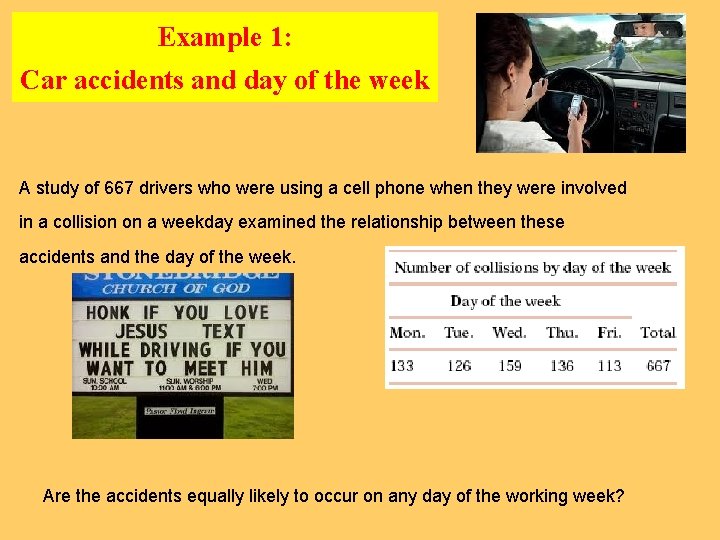
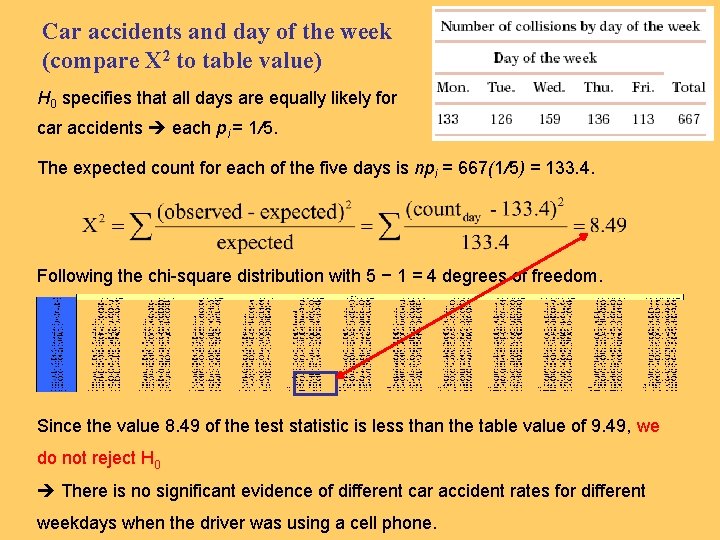
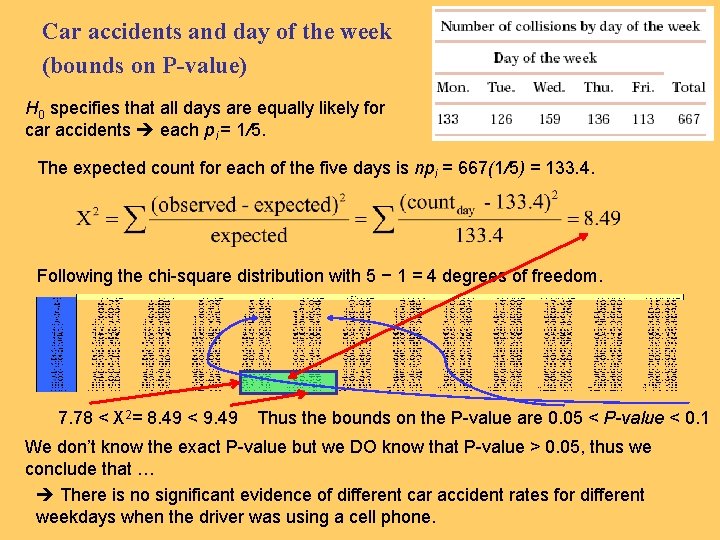
Example 1: Car accidents and day of the week A study of 667 drivers who were using a cell phone when they were involved in a collision on a weekday examined the relationship between these accidents and the day of the week. Are the accidents equally likely to occur on any day of the working week?
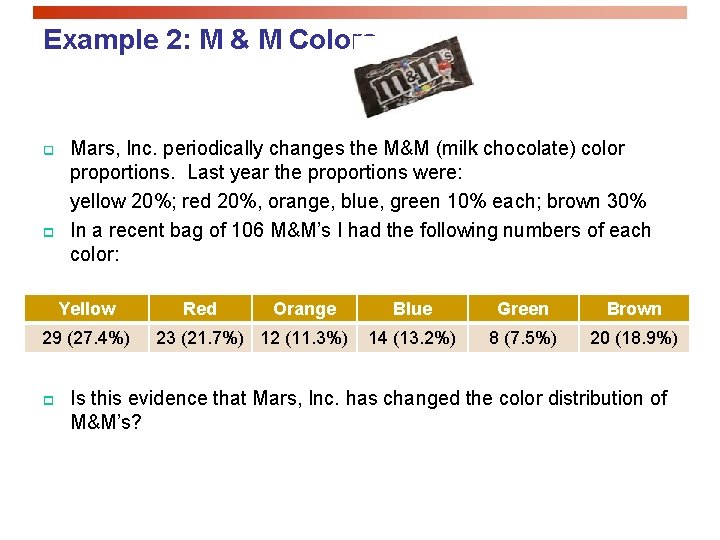
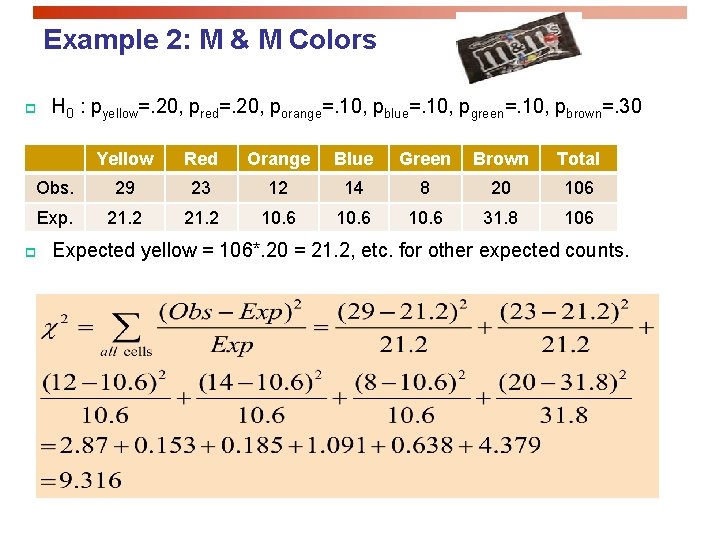
Example 2: M & M Colors q p Mars, Inc. periodically changes the M&M (milk chocolate) color proportions. Last year the proportions were: yellow 20%; red 20%, orange, blue, green 10% each; brown 30% In a recent bag of 106 M&M’s I had the following numbers of each color: Yellow 29 (27. 4%) p Red Orange 23 (21. 7%) 12 (11. 3%) Blue Green Brown 14 (13. 2%) 8 (7. 5%) 20 (18. 9%) Is this evidence that Mars, Inc. has changed the color distribution of M&M’s?
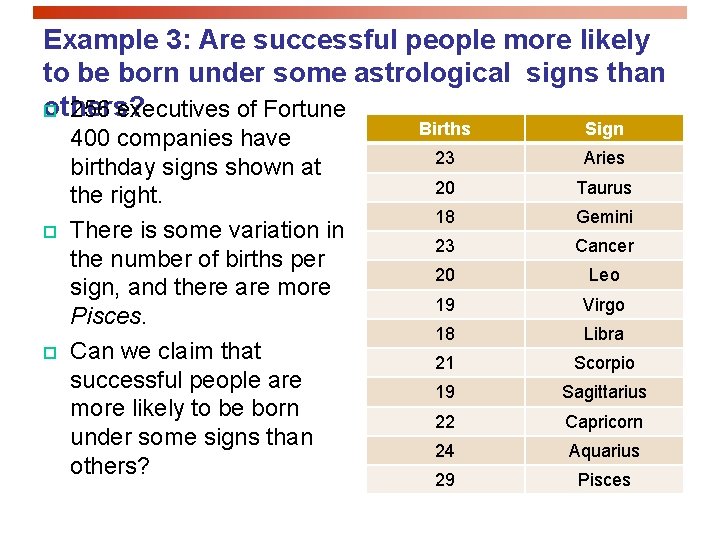
Example 3: Are successful people more likely to be born under some astrological signs than others? p 256 executives of Fortune p p 400 companies have birthday signs shown at the right. There is some variation in the number of births per sign, and there are more Pisces. Can we claim that successful people are more likely to be born under some signs than others? Births Sign 23 Aries 20 Taurus 18 Gemini 23 Cancer 20 Leo 19 Virgo 18 Libra 21 Scorpio 19 Sagittarius 22 Capricorn 24 Aquarius 29 Pisces
To answer these questions we use the chisquare goodness of fit test Data for n observations on a categorical variable (for example, day of week, color of M&M) with k possible outcomes (k=5 weekdays, k=6 M&M colors) are summarized as observed counts, n 1, n 2, . . . , nk in k cells. 2 hypotheses: null hypothesis H 0 and alternative hypothesis HA H 0 specifies probabilities p 1, p 2, . . . , pk for the possible outcomes. HA states that the probabilities are different from those in H 0
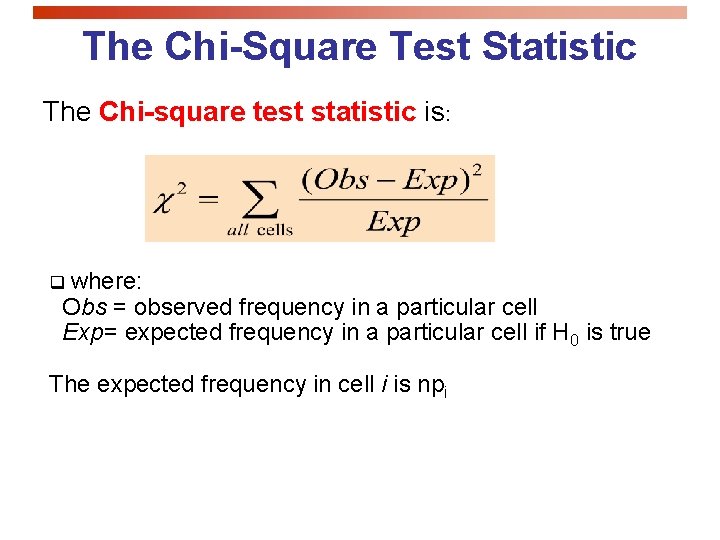
The Chi-Square Test Statistic The Chi-square test statistic is: q where: Obs = observed frequency in a particular cell Exp= expected frequency in a particular cell if H 0 is true The expected frequency in cell i is npi
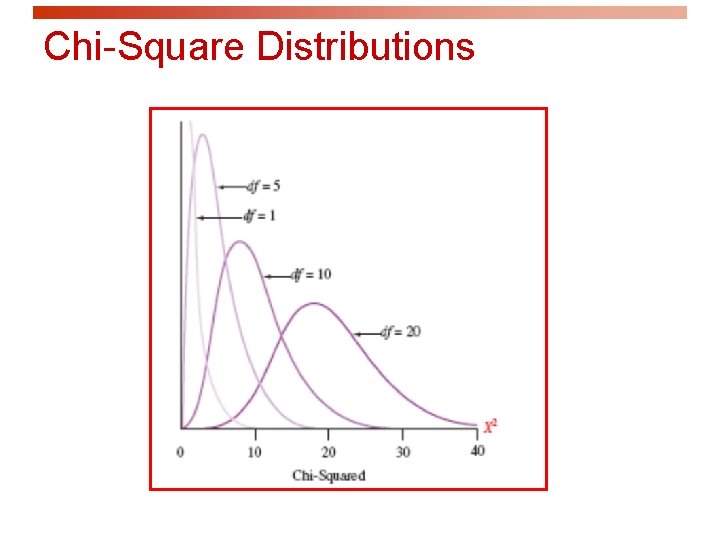
Chi-Square Distributions
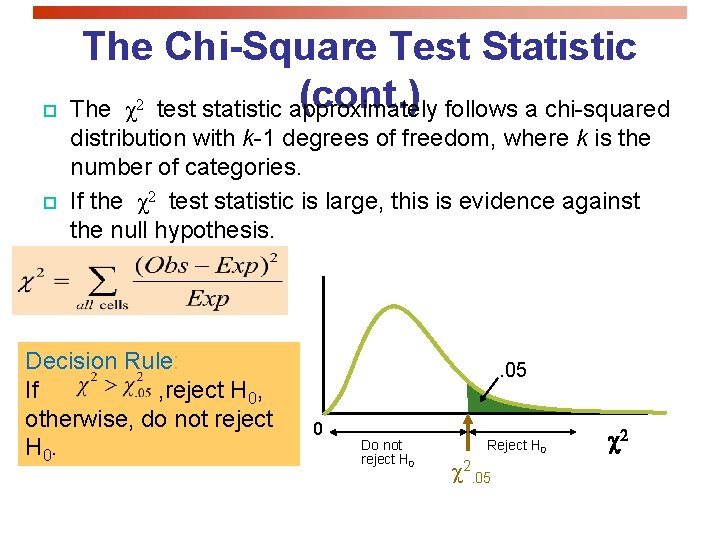
p p The Chi-Square Test Statistic (cont. ) The χ test statistic approximately follows a chi-squared 2 distribution with k-1 degrees of freedom, where k is the number of categories. If the χ2 test statistic is large, this is evidence against the null hypothesis. Decision Rule: If , reject H 0, otherwise, do not reject H 0. . 05 0 Do not reject H 0 Reject H 0 2. 05 2
Car accidents and day of the week (compare X 2 to table value) H 0 specifies that all days are equally likely for car accidents each pi = 1/5. The expected count for each of the five days is npi = 667(1/5) = 133. 4. Following the chi-square distribution with 5 − 1 = 4 degrees of freedom. Since the value 8. 49 of the test statistic is less than the table value of 9. 49, we do not reject H 0 There is no significant evidence of different car accident rates for different weekdays when the driver was using a cell phone.
Car accidents and day of the week (bounds on P-value) H 0 specifies that all days are equally likely for car accidents each pi = 1/5. The expected count for each of the five days is npi = 667(1/5) = 133. 4. Following the chi-square distribution with 5 − 1 = 4 degrees of freedom. 7. 78 < X 2= 8. 49 < 9. 49 Thus the bounds on the P-value are 0. 05 < P-value < 0. 1 We don’t know the exact P-value but we DO know that P-value > 0. 05, thus we conclude that … There is no significant evidence of different car accident rates for different weekdays when the driver was using a cell phone.
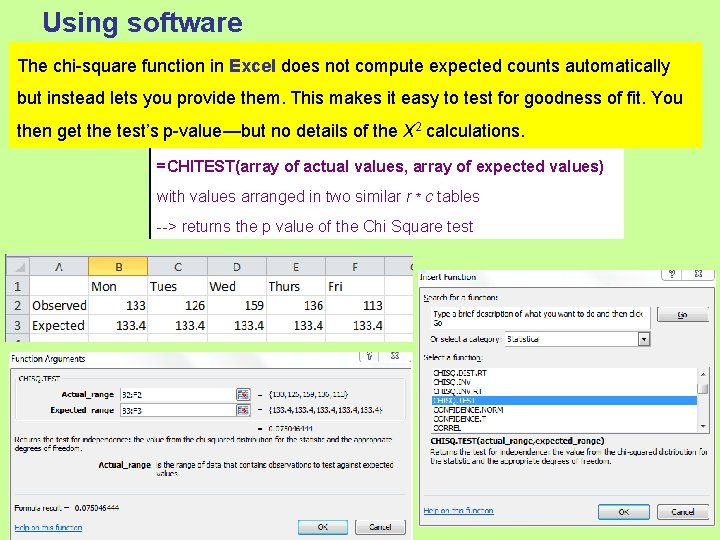
Using software The chi-square function in Excel does not compute expected counts automatically but instead lets you provide them. This makes it easy to test for goodness of fit. You then get the test’s p-value—but no details of the X 2 calculations. =CHITEST(array of actual values, array of expected values) with values arranged in two similar r * c tables --> returns the p value of the Chi Square test
Example 2: M & M Colors p H 0 : pyellow=. 20, pred=. 20, porange=. 10, pblue=. 10, pgreen=. 10, pbrown=. 30 Yellow Red Orange Blue Green Brown Total Obs. 29 23 12 14 8 20 106 Exp. 21. 2 10. 6 31. 8 106 p Expected yellow = 106*. 20 = 21. 2, etc. for other expected counts.
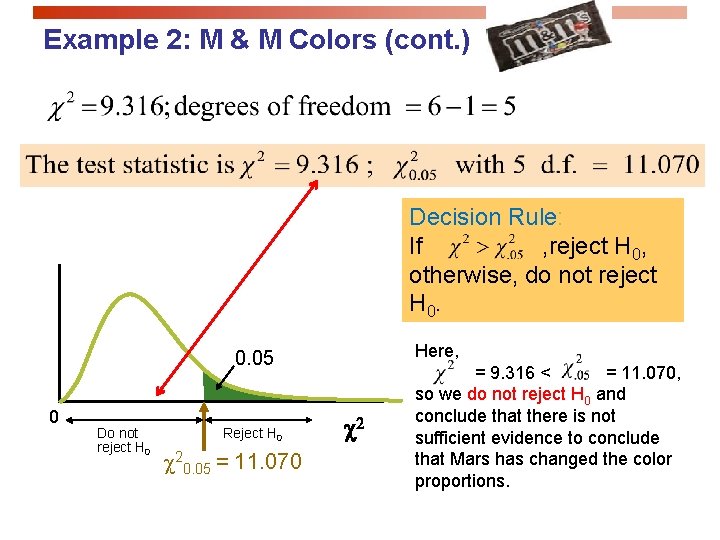
Example 2: M & M Colors (cont. ) Decision Rule: If , reject H 0, otherwise, do not reject H 0. 0. 05 0 Do not reject H 0 Reject H 0 20. 05 = 11. 070 2 Here, = 9. 316 < = 11. 070, so we do not reject H 0 and conclude that there is not sufficient evidence to conclude that Mars has changed the color proportions.
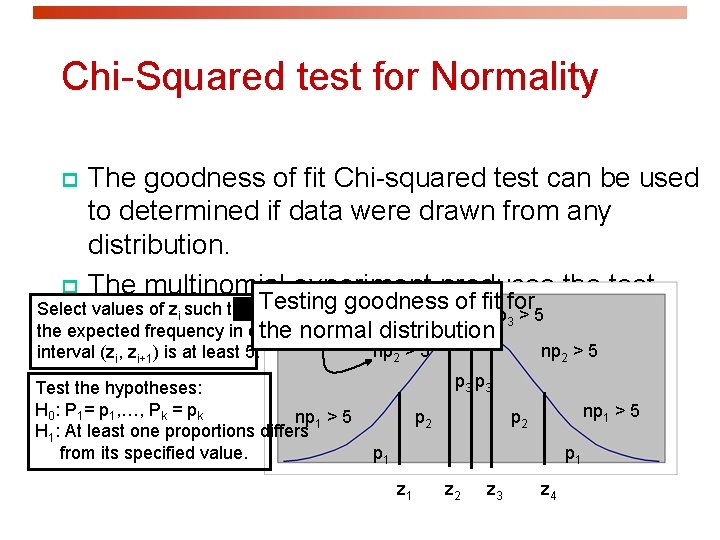
Chi-Squared test for Normality The goodness of fit Chi-squared test can be used to determined if data were drawn from any distribution. p The multinomial experiment produces the test For example: Select values of zi such that Testing goodness of fit for np 3 > 5 statistic. P(z <z<z )=p 1 2 2 the expected frequency in each the normal distribution p interval (zi, zi+1) is at least 5. Test the hypotheses: H 0: P 1= p 1, …, Pk = pk np 1 > 5 H 1: At least one proportions differs from its specified value. np 2 > 5 p 3 p 2 np 1 > 5 p 2 p 1 z 1 z 2 z 3 z 4
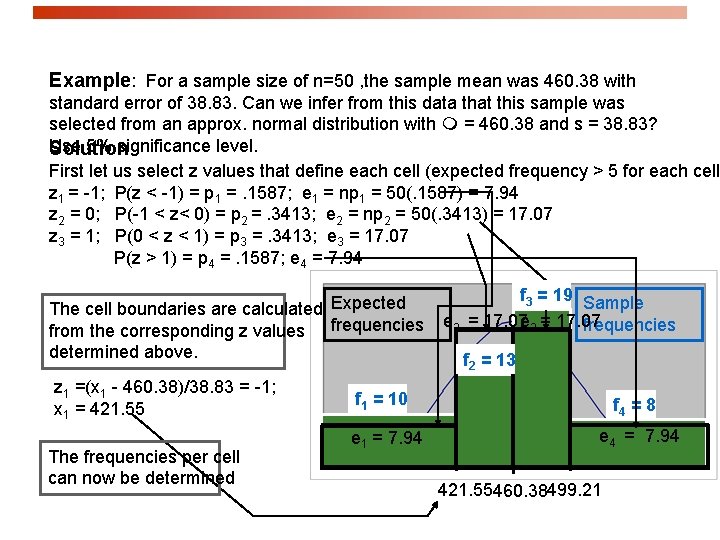
Example: For a sample size of n=50 , the sample mean was 460. 38 with standard error of 38. 83. Can we infer from this data that this sample was selected from an approx. normal distribution with = 460. 38 and s = 38. 83? Use 5% significance level. Solution First let us select z values that define each cell (expected frequency > 5 for each cell z 1 = -1; P(z < -1) = p 1 =. 1587; e 1 = np 1 = 50(. 1587) = 7. 94 z 2 = 0; P(-1 < z< 0) = p 2 =. 3413; e 2 = np 2 = 50(. 3413) = 17. 07 z 3 = 1; P(0 < z < 1) = p 3 =. 3413; e 3 = 17. 07 P(z > 1) = p 4 =. 1587; e 4 = 7. 94 The cell boundaries are calculated Expected from the corresponding z values frequencies determined above. z 1 =(x 1 - 460. 38)/38. 83 = -1; x 1 = 421. 55 The frequencies per cell can now be determined f 1 = 10 e 1 = 7. 94 p 1 f 3 = 19 Sample e 2 = 17. 07 e 3 = 17. 07 frequencies f 2 = 13 p 2 f 4 = 8 ep 4 = 7. 94 1 421. 55460. 38499. 21
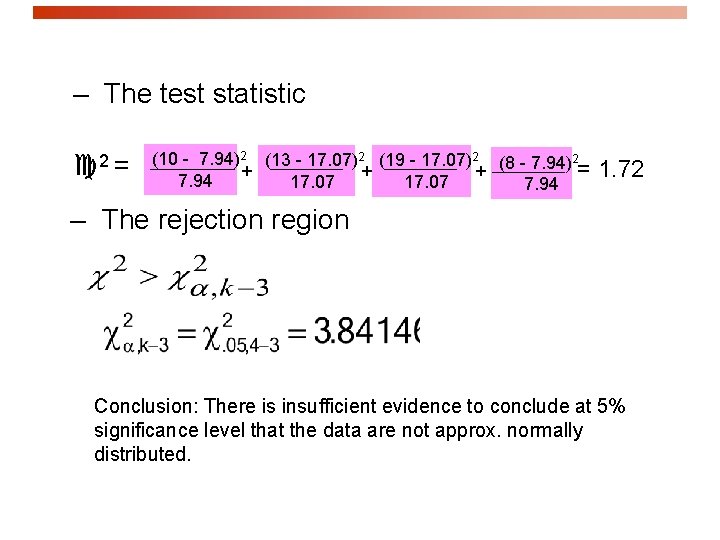
– The test statistic 2 = (10 - 7. 94)2 (13 - 17. 07)2 (19 - 17. 07)2 (8 - 7. 94)2 = 1. 72 + + + 7. 94 17. 07 7. 94 – The rejection region Conclusion: There is insufficient evidence to conclude at 5% significance level that the data are not approx. normally distributed.
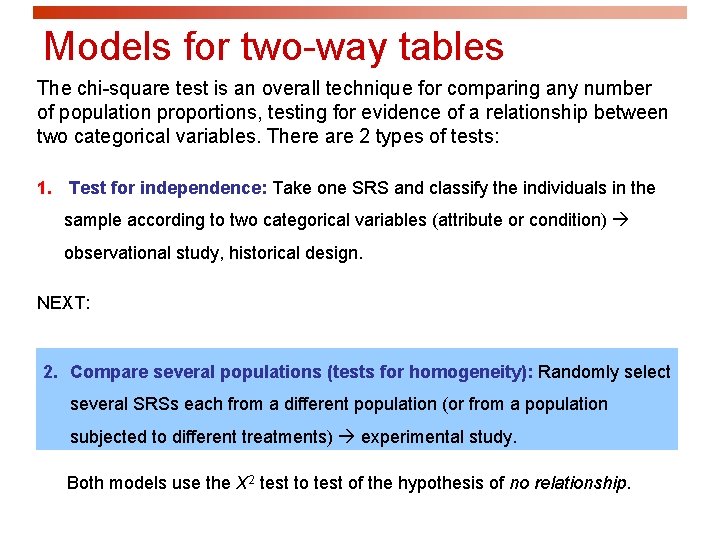
Models for two-way tables The chi-square test is an overall technique for comparing any number of population proportions, testing for evidence of a relationship between two categorical variables. There are 2 types of tests: 1. Test for independence: Take one SRS and classify the individuals in the sample according to two categorical variables (attribute or condition) observational study, historical design. 2. Compare several populations (tests for homogeneity): Randomly select several SRSs each from a different population (or from a population subjected to different treatments) experimental study. Both models use the X 2 test to test of the hypothesis of no relationship.
Testing for independence We have now a single sample from a single population. For each individual in this SRS of size n we measure two categorical variables. The results are then summarized in a two-way table. The null hypothesis is that the row and column variables are independent. The alternative hypothesis is that the row and column variables are dependent.
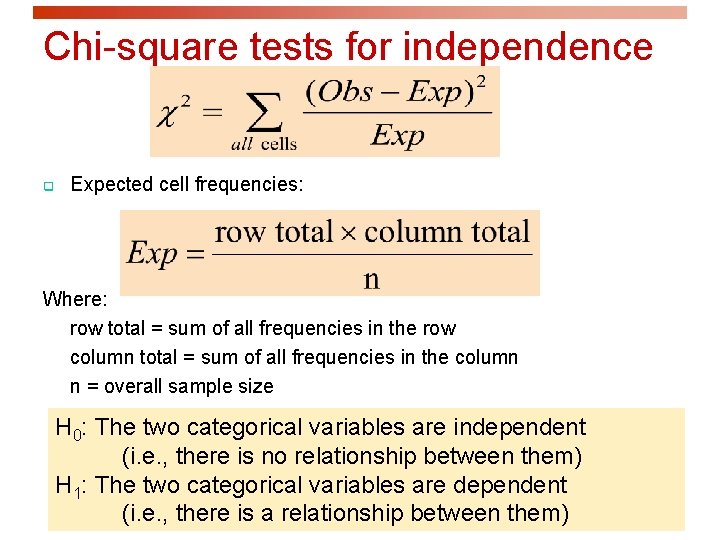
Chi-square tests for independence q Expected cell frequencies: Where: row total = sum of all frequencies in the row column total = sum of all frequencies in the column n = overall sample size H 0: The two categorical variables are independent (i. e. , there is no relationship between them) H 1: The two categorical variables are dependent (i. e. , there is a relationship between them)
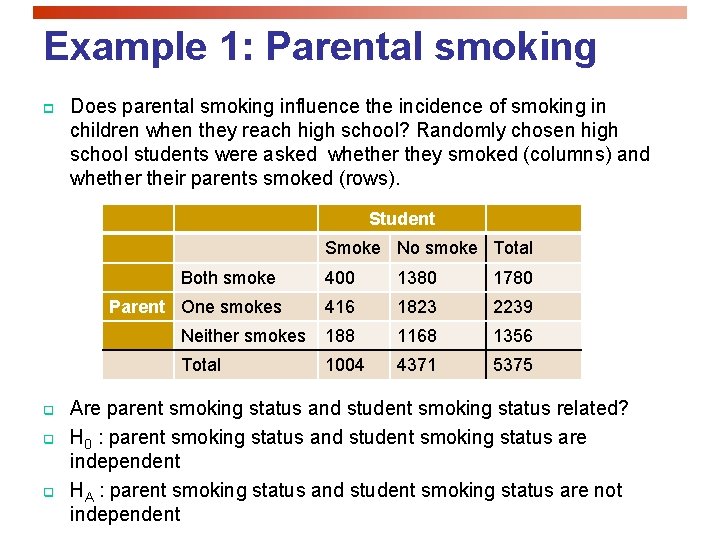
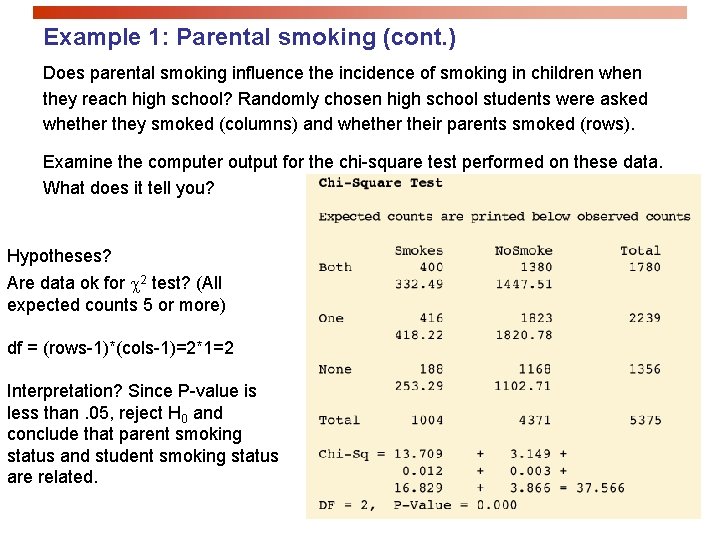
Example 1: Parental smoking p Does parental smoking influence the incidence of smoking in children when they reach high school? Randomly chosen high school students were asked whether they smoked (columns) and whether their parents smoked (rows). Student Smoke No smoke Total Both smoke 400 1380 1780 416 1823 2239 Neither smokes 188 1168 1356 Total 1004 4371 5375 Parent One smokes q q q Are parent smoking status and student smoking status related? H 0 : parent smoking status and student smoking status are independent HA : parent smoking status and student smoking status are not independent
Example 1: Parental smoking (cont. ) Does parental smoking influence the incidence of smoking in children when they reach high school? Randomly chosen high school students were asked whether they smoked (columns) and whether their parents smoked (rows). Examine the computer output for the chi-square test performed on these data. What does it tell you? Hypotheses? Are data ok for 2 test? (All expected counts 5 or more) df = (rows-1)*(cols-1)=2*1=2 Interpretation? Since P-value is less than. 05, reject H 0 and conclude that parent smoking status and student smoking status are related.
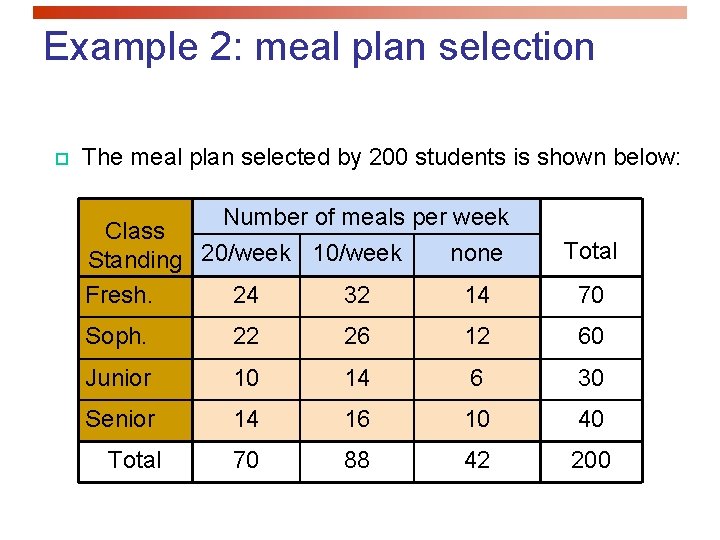
Example 2: meal plan selection p The meal plan selected by 200 students is shown below: Number of meals per week Class none Standing 20/week 10/week Fresh. 24 32 14 Total 70 Soph. 22 26 12 60 Junior 10 14 6 30 Senior 14 16 10 40 70 88 42 200 Total
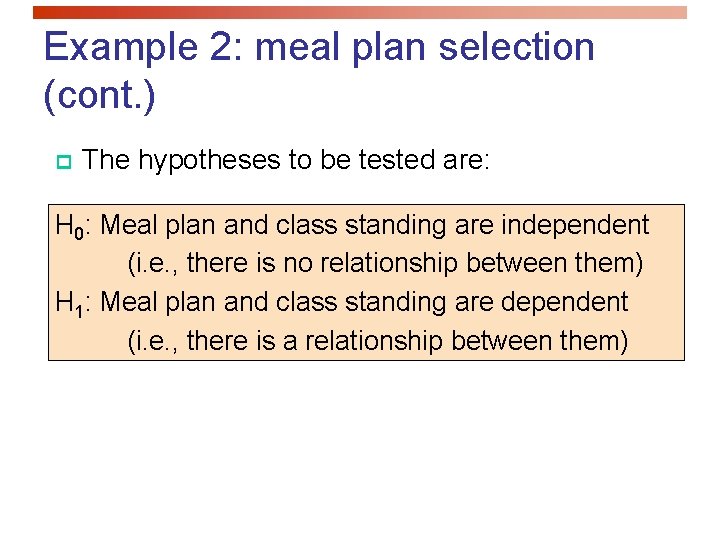
Example 2: meal plan selection (cont. ) p The hypotheses to be tested are: H 0: Meal plan and class standing are independent (i. e. , there is no relationship between them) H 1: Meal plan and class standing are dependent (i. e. , there is a relationship between them)
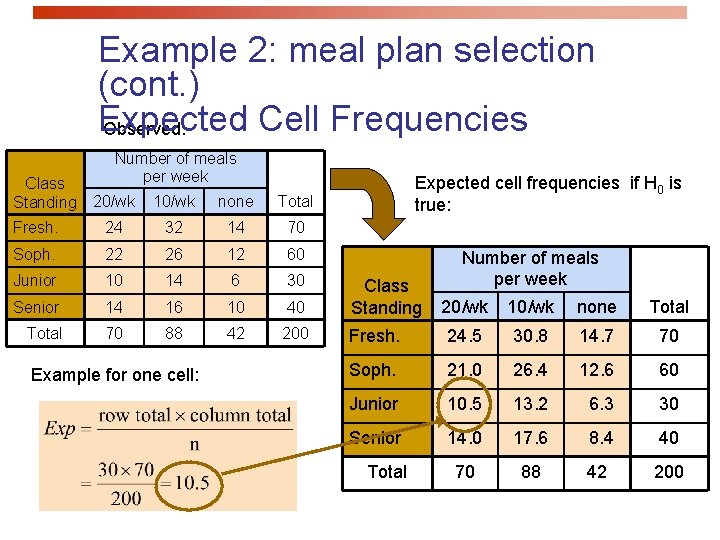
Example 2: meal plan selection (cont. ) Expected Cell Frequencies Observed: Class Standing Number of meals per week Expected cell frequencies if H 0 is true: 20/wk 10/wk none Total Fresh. 24 32 14 70 Soph. 22 26 12 60 Junior 10 14 6 30 Senior 14 16 10 40 Class Standing 70 88 42 200 Total Example for one cell: Number of meals per week 20/wk 10/wk none Total Fresh. 24. 5 30. 8 14. 7 70 Soph. 21. 0 26. 4 12. 6 60 Junior 10. 5 13. 2 6. 3 30 Senior 14. 0 17. 6 8. 4 40 70 88 42 200 Total
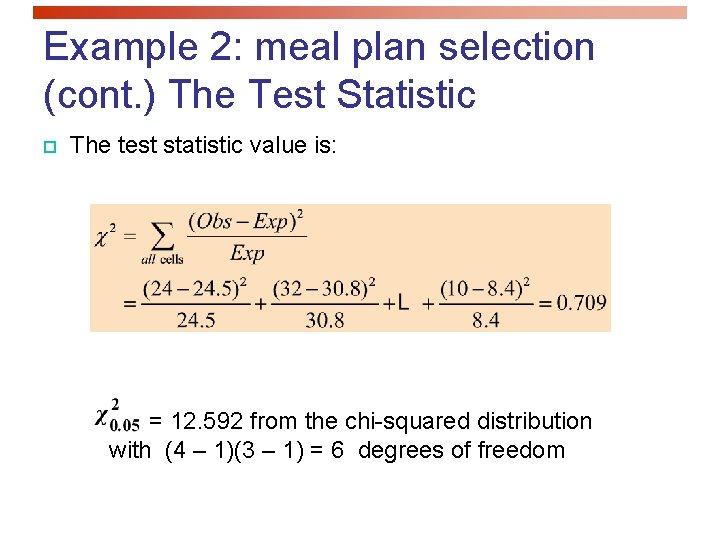
Example 2: meal plan selection (cont. ) The Test Statistic p The test statistic value is: = 12. 592 from the chi-squared distribution with (4 – 1)(3 – 1) = 6 degrees of freedom
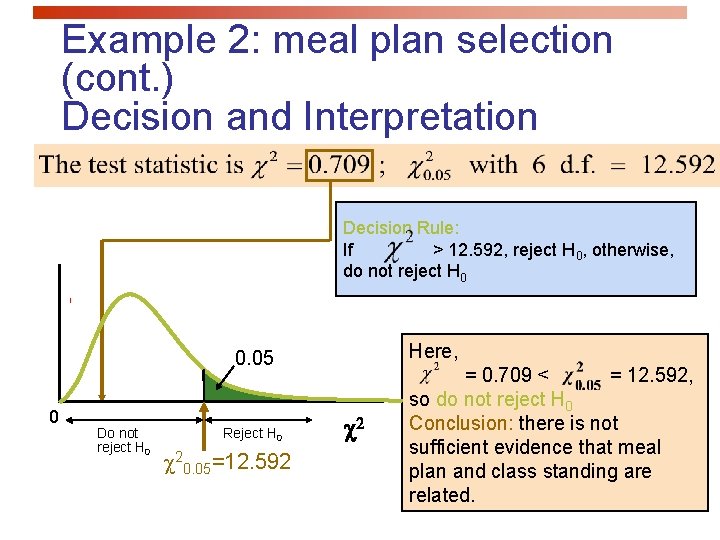
Example 2: meal plan selection (cont. ) Decision and Interpretation Decision Rule: If > 12. 592, reject H 0, otherwise, do not reject H 0 0. 05 0 Do not reject H 0 Reject H 0 20. 05=12. 592 2 Here, = 0. 709 < = 12. 592, so do not reject H 0 Conclusion: there is not sufficient evidence that meal plan and class standing are related.
Models for two-way tables The chi-square test is an overall technique for comparing any number of population proportions, testing for evidence of a relationship between two categorical variables. There are 2 types of tests: 1. Test for independence: Take one SRS and classify the individuals in the sample according to two categorical variables (attribute or condition) observational study, historical design. NEXT: 2. Compare several populations (tests for homogeneity): Randomly select several SRSs each from a different population (or from a population subjected to different treatments) experimental study. Both models use the X 2 test to test of the hypothesis of no relationship.
Comparing several populations (tests for homogeneity) Select independent SRSs from each of c populations, of sizes n 1, n 2, . . . , nc. Classify each individual in a sample according to a categorical response variable with r possible values. There are c different probability distributions, one for each population. The null hypothesis is that the distributions of the response variable are the same in all c populations. The alternative hypothesis says that these c distributions are not all the same.
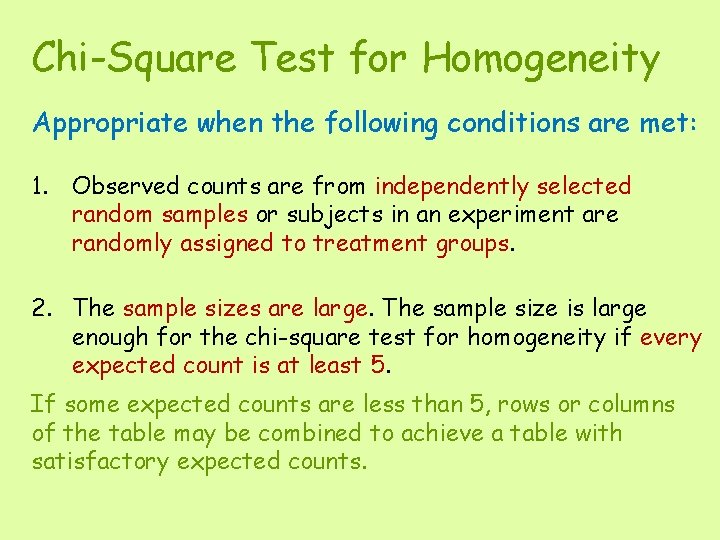
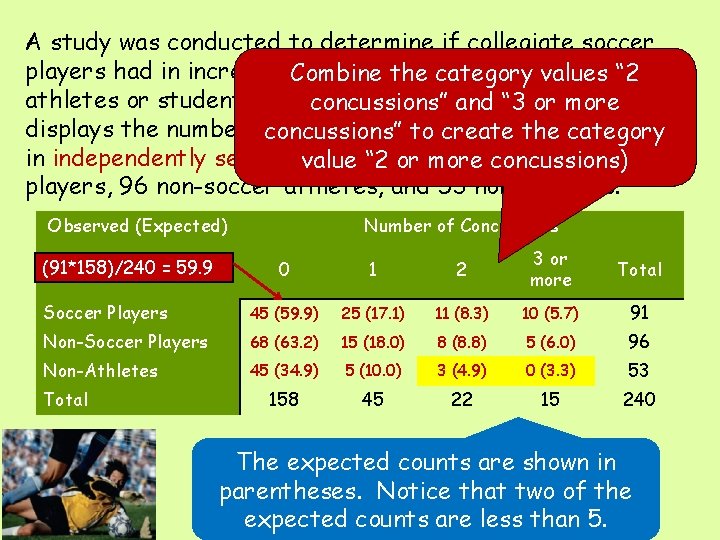
Chi-Square Test for Homogeneity Appropriate when the following conditions are met: 1. Observed counts are from independently selected random samples or subjects in an experiment are randomly assigned to treatment groups. 2. The sample sizes are large. The sample size is large enough for the chi-square test for homogeneity if every expected count is at least 5. If some expected counts are less than 5, rows or columns of the table may be combined to achieve a table with satisfactory expected counts.
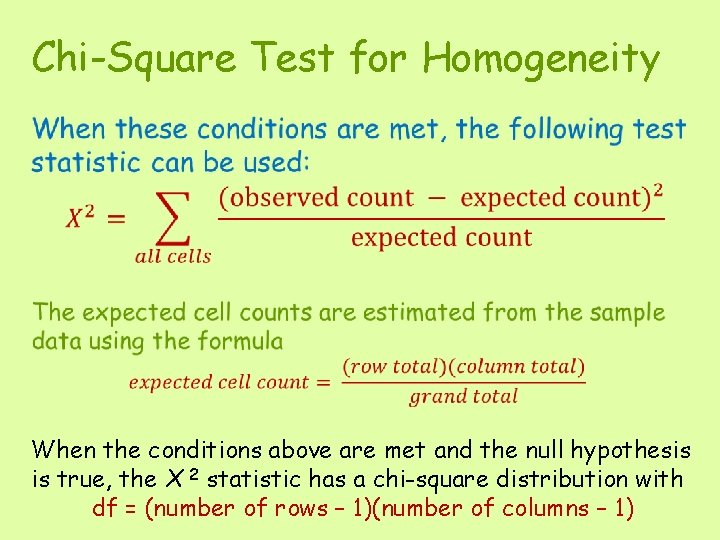
Chi-Square Test for Homogeneity • When the conditions above are met and the null hypothesis is true, the X 2 statistic has a chi-square distribution with df = (number of rows – 1)(number of columns – 1)
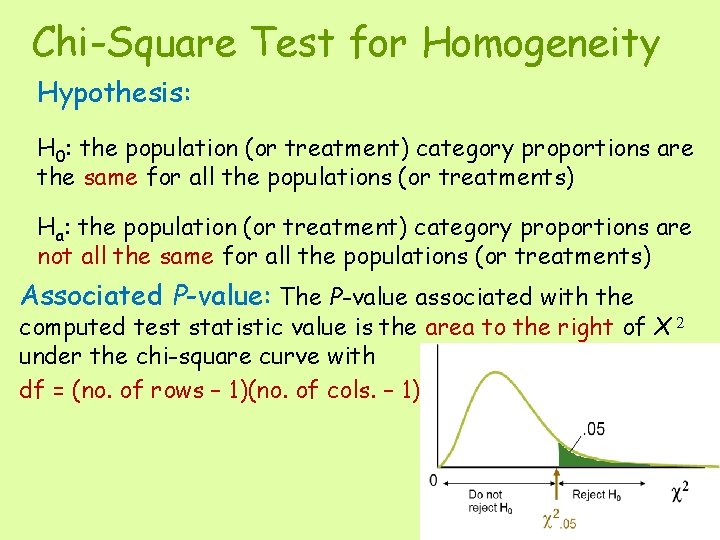
Chi-Square Test for Homogeneity Hypothesis: H 0: the population (or treatment) category proportions are the same for all the populations (or treatments) Ha: the population (or treatment) category proportions are not all the same for all the populations (or treatments) Associated P-value: The P-value associated with the computed test statistic value is the area to the right of X 2 under the chi-square curve with df = (no. of rows – 1)(no. of cols. – 1)
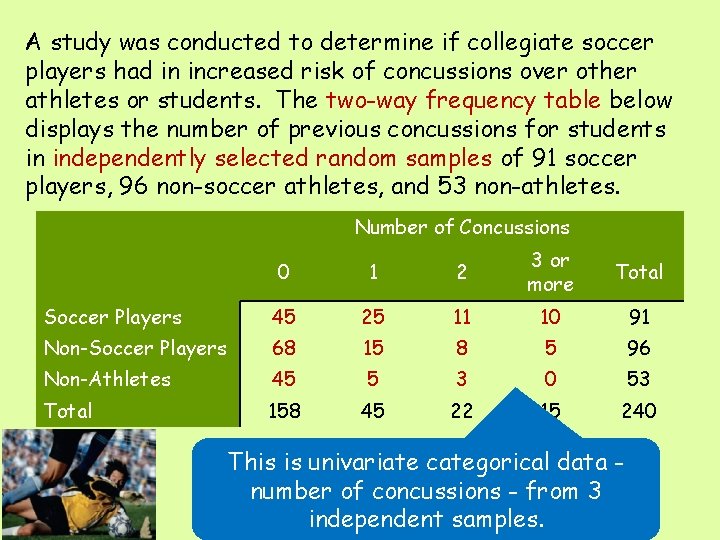
A study was conducted to determine if collegiate soccer players had in increased risk of concussions over other athletes or students. The two-way frequency table below displays the number of previous concussions for students in independently selected random samples of 91 soccer players, 96 non-soccer athletes, and 53 non-athletes. Number of Concussions 0 1 2 3 or more Total Soccer Players 45 25 11 10 91 Non-Soccer Players 68 15 8 5 96 Non-Athletes 45 5 3 0 53 Total 158 45 22 15 240 This is univariate categorical data number of concussions - from 3 independent samples.
A study was conducted to determine if collegiate soccer players had in increased. Combine risk of concussions over other the category values “ 2 athletes or students. Theconcussions” two-way frequency table and “ 3 or morebelow displays the number of previous concussions for category students concussions” to create the in independently selectedvalue random samples of 91 soccer “ 2 or more concussions) players, 96 non-soccer athletes, and 53 non-athletes. Observed (Expected) Number of Concussions 0 1 2 3 or more Total Soccer Players 45 (59. 9) 25 (17. 1) 11 (8. 3) 10 (5. 7) 91 Non-Soccer Players 68 (63. 2) 15 (18. 0) 8 (8. 8) 5 (6. 0) 96 Non-Athletes 45 (34. 9) 5 (10. 0) 3 (4. 9) 0 (3. 3) 53 158 45 22 15 240 (91*158)/240 = 59. 9 Total The expected counts are shown in parentheses. Notice that two of the expected counts are less than 5.
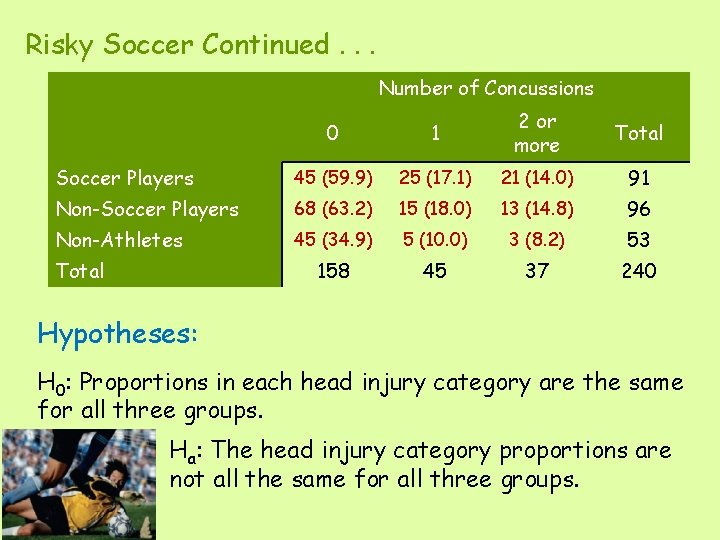
Risky Soccer Continued. . . Number of Concussions 0 1 2 or more Total Soccer Players 45 (59. 9) 25 (17. 1) 21 (14. 0) 91 Non-Soccer Players 68 (63. 2) 15 (18. 0) 13 (14. 8) 96 Non-Athletes 45 (34. 9) 5 (10. 0) 3 (8. 2) 53 158 45 37 240 Total Hypotheses: H 0: Proportions in each head injury category are the same for all three groups. Ha: The head injury category proportions are not all the same for all three groups.
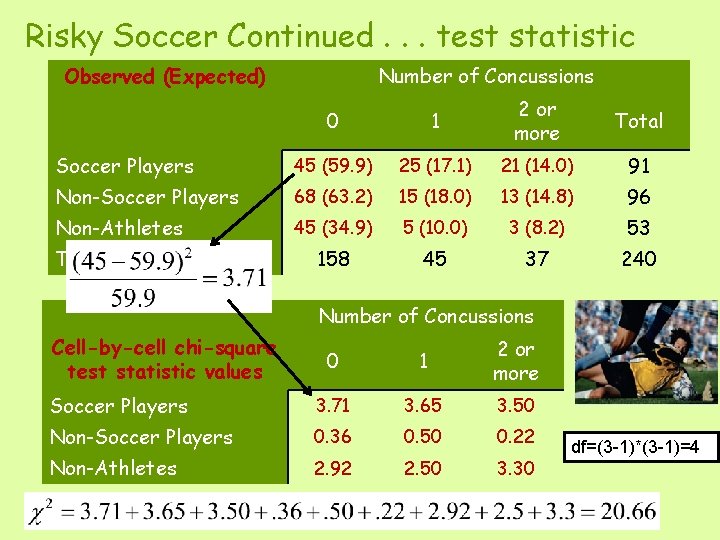
Risky Soccer Continued. . . test statistic Observed (Expected) Number of Concussions 0 1 2 or more Total Soccer Players 45 (59. 9) 25 (17. 1) 21 (14. 0) 91 Non-Soccer Players 68 (63. 2) 15 (18. 0) 13 (14. 8) 96 Non-Athletes 45 (34. 9) 5 (10. 0) 3 (8. 2) 53 158 45 37 240 Total Number of Concussions Cell-by-cell chi-square test statistic values 0 1 2 or more Soccer Players 3. 71 3. 65 3. 50 Non-Soccer Players 0. 36 0. 50 0. 22 Non-Athletes 2. 92 2. 50 3. 30 df=(3 -1)*(3 -1)=4
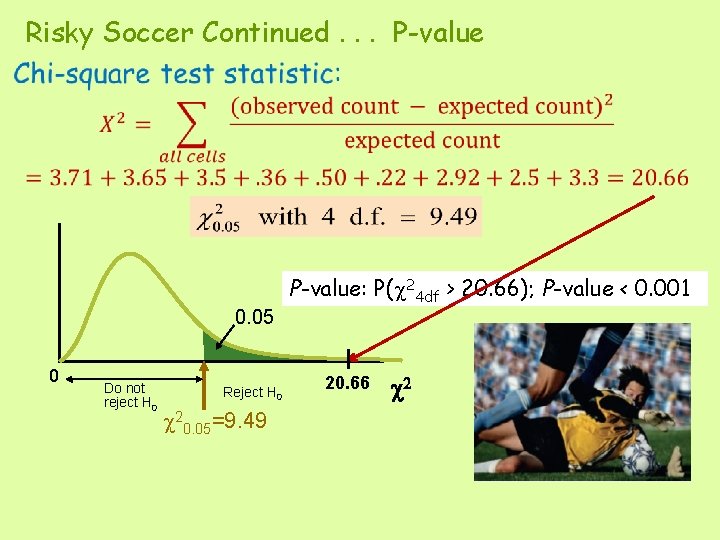
Risky Soccer Continued. . . P-value: P( 24 df > 20. 66); P-value < 0. 001 0. 05 0 Do not reject H 0 Reject H 0 20. 05=9. 49 20. 66 2
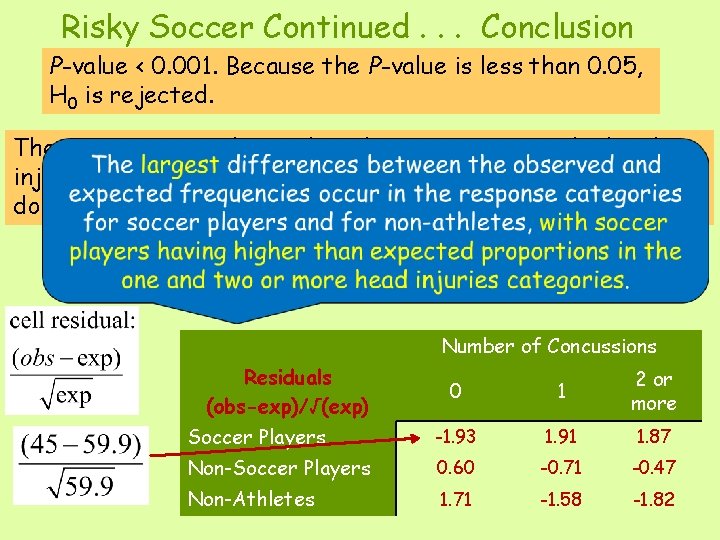
Risky Soccer Continued. . . Conclusion P-value < 0. 001. Because the P-value is less than 0. 05, H 0 is rejected. There is strong evidence that the proportions in the head injury categories are not the same for the three groups. How do they differ? Check cell residuals. Number of Concussions Residuals (obs-exp)/√(exp) 0 1 2 or more Soccer Players -1. 93 1. 91 1. 87 Non-Soccer Players 0. 60 -0. 71 -0. 47 Non-Athletes 1. 71 -1. 58 -1. 82
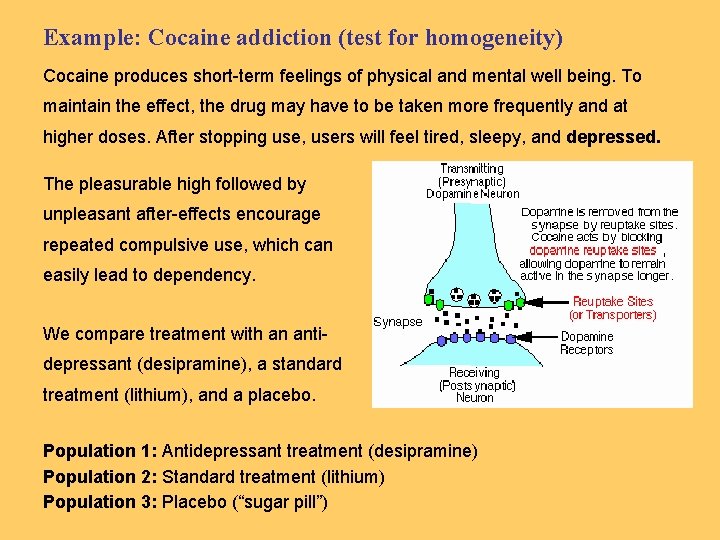
Example: Cocaine addiction (test for homogeneity) Cocaine produces short-term feelings of physical and mental well being. To maintain the effect, the drug may have to be taken more frequently and at higher doses. After stopping use, users will feel tired, sleepy, and depressed. The pleasurable high followed by unpleasant after-effects encourage repeated compulsive use, which can easily lead to dependency. We compare treatment with an antidepressant (desipramine), a standard treatment (lithium), and a placebo. Population 1: Antidepressant treatment (desipramine) Population 2: Standard treatment (lithium) Population 3: Placebo (“sugar pill”)
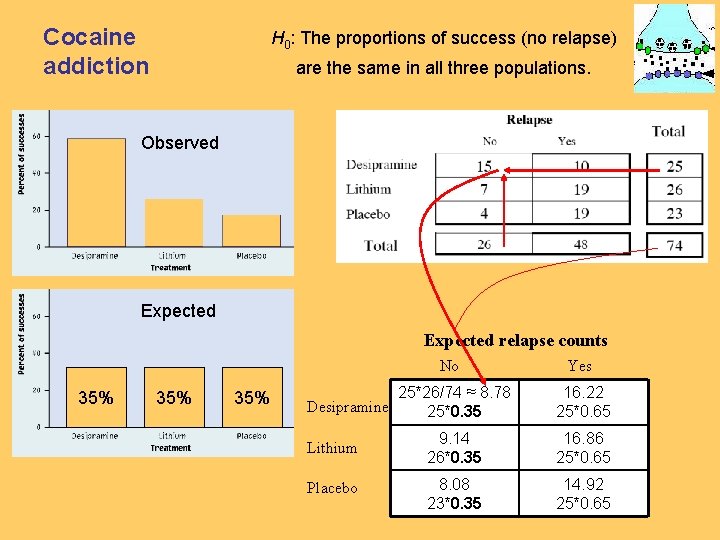
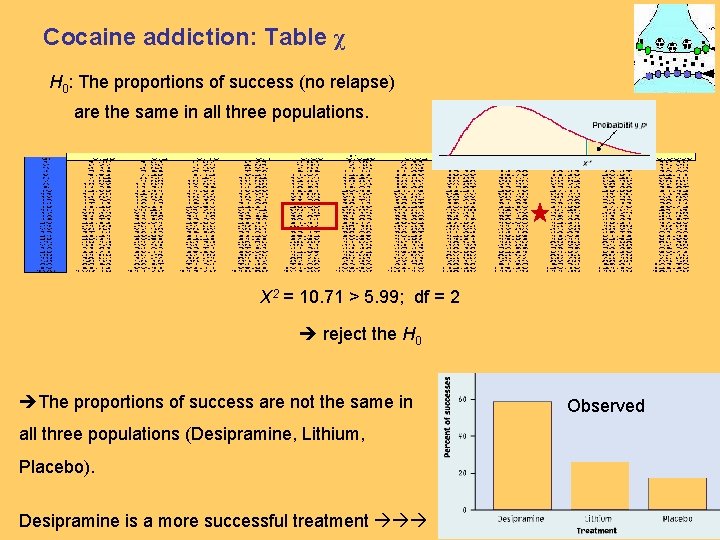
Cocaine addiction H 0: The proportions of success (no relapse) are the same in all three populations. Observed Expected relapse counts No 35% 35% 25*26/74 ≈ 8. 78 Desipramine 25*0. 35 Yes 16. 22 25*0. 65 Lithium 9. 14 26*0. 35 16. 86 25*0. 65 Placebo 8. 08 23*0. 35 14. 92 25*0. 65
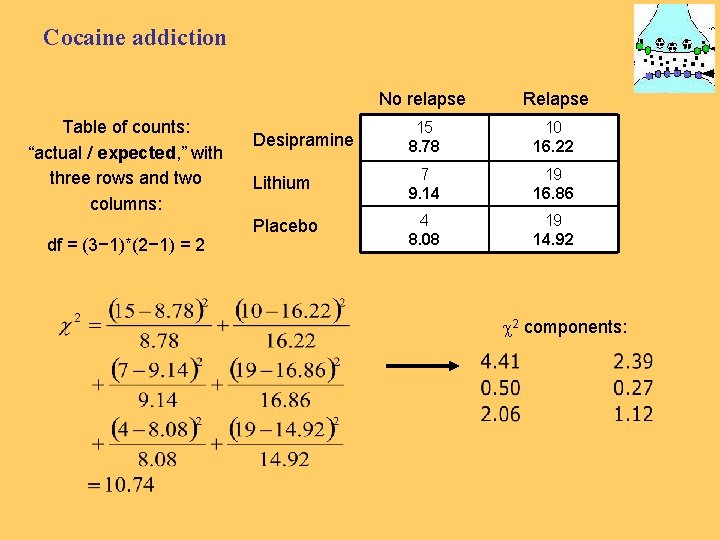
Cocaine addiction Table of counts: “actual / expected, ” with three rows and two columns: df = (3− 1)*(2− 1) = 2 No relapse Relapse Desipramine 15 8. 78 10 16. 22 Lithium 7 9. 14 19 16. 86 Placebo 4 8. 08 19 14. 92 2 components:
Cocaine addiction: Table χ H 0: The proportions of success (no relapse) are the same in all three populations. X 2 = 10. 71 > 5. 99; df = 2 reject the H 0 The proportions of success are not the same in all three populations (Desipramine, Lithium, Placebo). Desipramine is a more successful treatment Observed
Avoid These Common Mistakes
Avoid These Common Mistakes 1. Don’t confuse tests for homogeneity with tests for independence. The hypotheses and conclusions are different for the two types of test. Tests for homogeneity are used when the individuals in each of two or more independent samples are classified according to a single categorical variable. Tests for independence are used when individuals in a single sample are classified according to two categorical variables.
Avoid These Common Mistakes 2. Remember that a hypothesis test can never show strong support for the null hypothesis. For example, if you do not reject the null hypothesis in a chi-square test for independence, you cannot conclude that there is convincing evidence that the variables are independent. You can only say that you were not convinced that there is an association between the variables.
Avoid These Common Mistakes 3. Be sure that the conditions for the chi-square test are met. P-values based on the chi-square distribution are only approximate, and if the large sample condition is not met, the actual P-value may be quite different from the approximate one based on the chi-square distribution. Also, for the chi-square test of homogeneity, the assumption of independent samples is particularly important.
Avoid These Common Mistakes 4. Don’t jump to conclusions about causation. Just as a strong correlation between two numerical variables does not mean that there is a causeand-effect relationship between them, an association between two categorical variables does not imply a causal relationship.