South Carolina House of Representatives Higher Education and













- Slides: 41
South Carolina House of Representatives Higher Education and Technical Colleges Subcommittee Budget Request Fiscal Year 2019 -2020 President David A. De. Cenzo January 15, 2019 1
Agency Attendees David A. De. Cenzo, President J. Ralph Byington, Provost and Executive Vice President David A. Frost, CFO and Vice President for Finance and Administration Michael Q. Ryhal, Legislative Liaison J. David Yancey, Assistant Provost for Special Projects Julianne H. Cooke, Director of Budget and Capital Projects 2
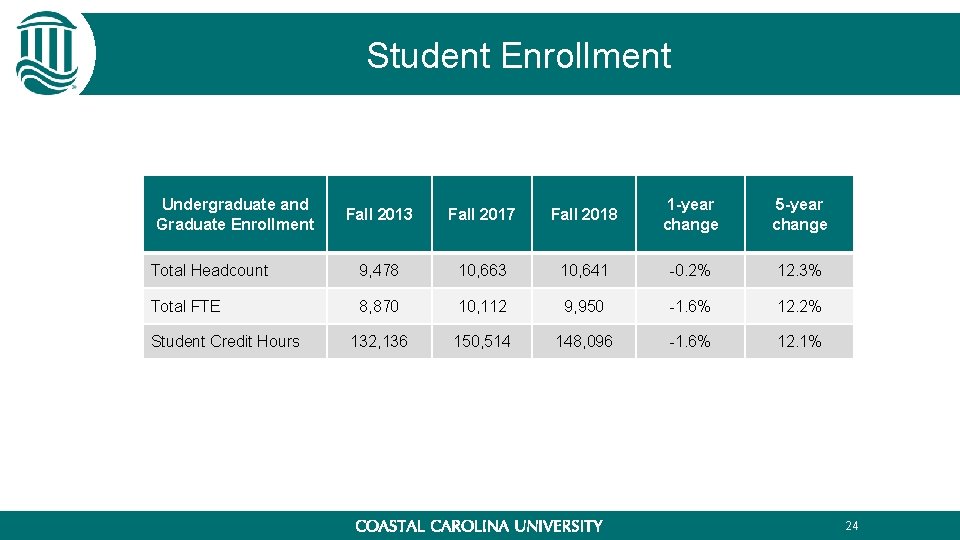
Highlights • Second doctoral program, Ph. D. in Education, was approved by South Carolina Commission on Higher Education and the University is seeking SACSCOC approval • For the eleventh consecutive year, received an unqualified opinion from the external auditors Cline Brandt Kochenower & Co. , P. A. for the fiscal year ending June 30, 2018 financial statements • Designated a Purple Heart University by the Military Order of the Purple Heart • Recognized by the South Carolina Arts Commission for having had faculty receive awards and fellowships more frequently than those at any other institution • Awarded the Certificate of Achievement for Excellence in Financial Reporting, a national award given by the Government Finance Officers Association of the United States and Canada for its 2017 Comprehensive Annual Financial Report • The E. Craig Wall Sr. College of Business Administration maintained its accreditation by the Association to Advance Collegiate Schools of Business International • In Fall 2018, increased General Funds appropriations allowed the University to provide full-time, in-state students a $100 tuition credit per semester totaling $820, 000. In effect, a planned 3% tuition increase decreased to 1. 21% for this population of students. • University housing rates have not increased over the past 5 years; in addition, University housing residents received a $75 rebate per semester beginning in FY 2018 and extending through FY 2022. • Residential Meal Plans only increased an average of 1. 1%, and the Basic 21 Meal Plan did not increase at all. • Over the past 5 years, through Fall 2018, enrollment has increased 12. 3%, from 9, 478 students in Fall 2013 to 10, 641 students in Fall 2018. • Fall 2018 student population consisted of 30% minority enrollment. 3
Highlights Over the past year, Coastal Carolina University received the following distinctions: • U. S. News & World Report: “Top Public Schools, ” “Best Value Schools”, “Best Undergraduate Teaching”, “Most Innovative Schools”, “Best Colleges for Veterans, ” “Best Regional Universities South. ” • Forbes: “America’s Top Colleges” • G. I. Jobs Magazine: “Military Friendly School” for the ninth consecutive year. • SR Education Group: “Most Affordable Military-Friendly Online Colleges” • Online. Colleges. com: “Best Online Colleges in South Carolina” • Institutional Research & Evaluation Inc. : “America’s 100 Best College Buys” for the ninth consecutive year. • Affordable Colleges Online: “Best Online Colleges in South Carolina. ” • Schools. com: “Best Four-Year Colleges in South Carolina” 4
Highlights Accountability Report Highlights • Objective 1. 1. 2 - Develop a more comprehensive process to evaluate timely degree completion and student success. • During 2017 -18 academic year, benchmarks were established identifying targeted six-year graduation rates for students in each college. CCU will track program completion in each degree program with a goal of increasing six-year graduation rates at least 2% per year with a total of 10% at the end of five years. – Activities implemented to help reach goal: Student Achievement Funding Request Initiative, developed new math placement test based on incoming students high school GPA and SAT scores, purchased a student early alert system. • Objective 1. 2. 1 – Assess opportunities to improve the student experience and take action to address them on an annual basis. • During the 2017 -18 academic year, unique student opportunities were offered in the form of undergraduate research, internships, and student engagement. – Undergraduate Research – The CCU Coastal Research Fellows program was expanded to identify 20 new junior or senior level Research Fellows. – Internships – 15% increase in employers offering internships – Student Engagement – Initiated the “Rolling Forward” program to provide bicycles to local homeless shelters – Campus Expansion – Board of Trustees approved a motion to proceed with the planning for a new campus building, the Academic Enrichment Center and Auditorium. Objective 1. 2. 2 – Require all students to participate in one of the specified types of experiential learning, for course credit, by August 2018. • Beginning in Fall 2018, Experiential Learning is now a graduation requirement and has been added to the 2018 -19 Undergraduate Catalog. • 5
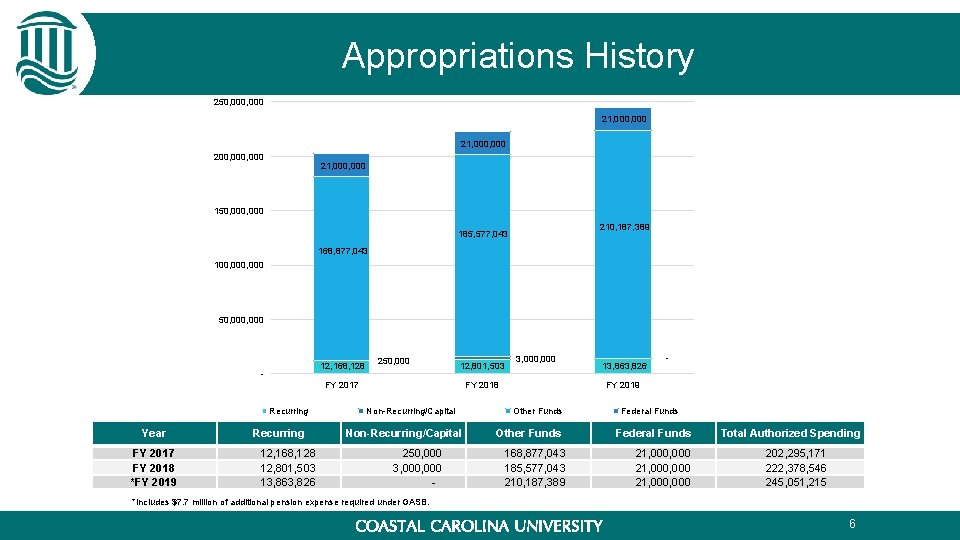
Appropriations History 250, 000 21, 000, 000 200, 000 21, 000 150, 000 210, 187, 389 185, 577, 043 168, 877, 043 100, 000 50, 000 12, 168, 128 - 250, 000 12, 801, 503 FY 2017 Recurring 3, 000 FY 2018 Non-Recurring/Capital 13, 863, 826 - FY 2019 Other Funds Federal Funds Year Recurring Non-Recurring/Capital Other Funds Federal Funds Total Authorized Spending FY 2017 FY 2018 *FY 2019 12, 168, 128 12, 801, 503 13, 863, 826 250, 000 3, 000 - 168, 877, 043 185, 577, 043 210, 187, 389 21, 000, 000 21, 000 202, 295, 171 222, 378, 546 245, 051, 215 *Includes $7. 7 million of additional pension expense required under GASB. 6
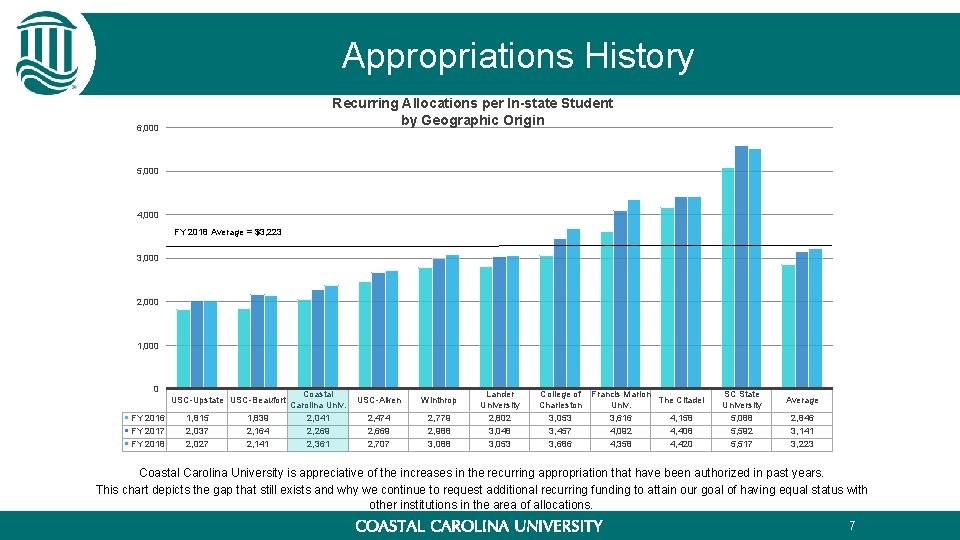
Appropriations History Recurring Allocations per In-state Student by Geographic Origin 6, 000 5, 000 4, 000 FY 2018 Average = $3, 223 3, 000 2, 000 1, 000 0 USC-Upstate USC-Beaufort FY 2016 FY 2017 FY 2018 1, 815 2, 037 2, 027 1, 839 2, 164 2, 141 Coastal Carolina Univ. 2, 041 2, 269 2, 361 USC-Aiken Winthrop 2, 474 2, 669 2, 707 2, 779 2, 988 3, 088 Lander University 2, 802 3, 048 3, 053 College of Francis Marion The Citadel Charleston Univ. 3, 053 3, 616 4, 158 3, 457 4, 092 4, 408 3, 686 4, 358 4, 420 SC State University 5, 088 5, 592 5, 517 Average 2, 846 3, 141 3, 223 Coastal Carolina University is appreciative of the increases in the recurring appropriation that have been authorized in past years. This chart depicts the gap that still exists and why we continue to request additional recurring funding to attain our goal of having equal status with other institutions in the area of allocations. 7
2018 -2019 Projected Revenue Scholarships, Contracts, Grants 20, 998, 936 9% Federal Grants 2, 400, 000 1% Federal Scholarships 18, 600, 000 8% Sales and Services 7, 644, 563 3% Auxiliary 29, 939, 100 13% Tuition and Fees 140, 471, 483 59% Other 3, 472, 552 1% State Funds 13, 863, 826 6% Total: $237, 390, 460 8
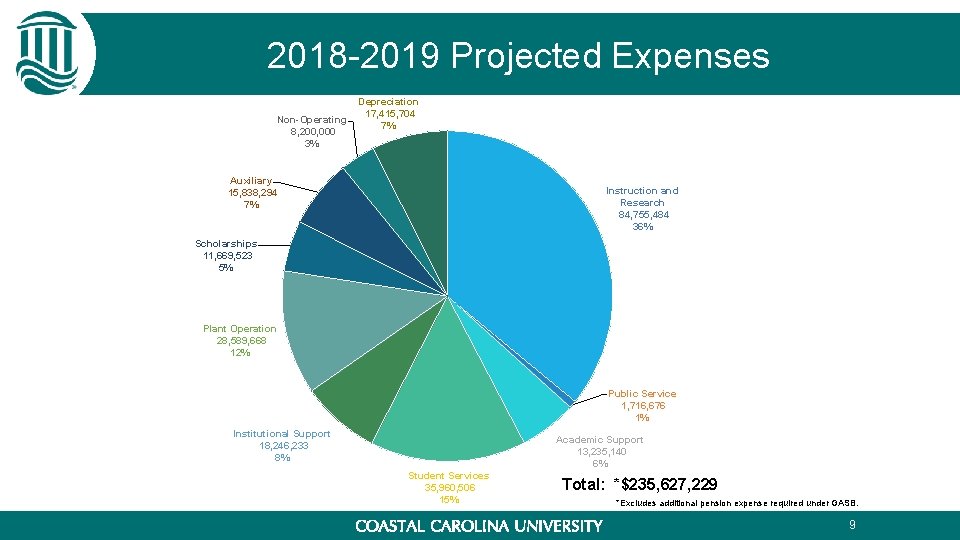
2018 -2019 Projected Expenses Non-Operating 8, 200, 000 3% Depreciation 17, 415, 704 7% Auxiliary 15, 838, 294 7% Instruction and Research 84, 755, 484 36% Scholarships 11, 669, 523 5% Plant Operation 28, 589, 668 12% Public Service 1, 716, 676 1% Institutional Support 18, 246, 233 8% Academic Support 13, 235, 140 6% Student Services 35, 960, 506 15% Total: *$235, 627, 229 *Excludes additional pension expense required under GASB. 9
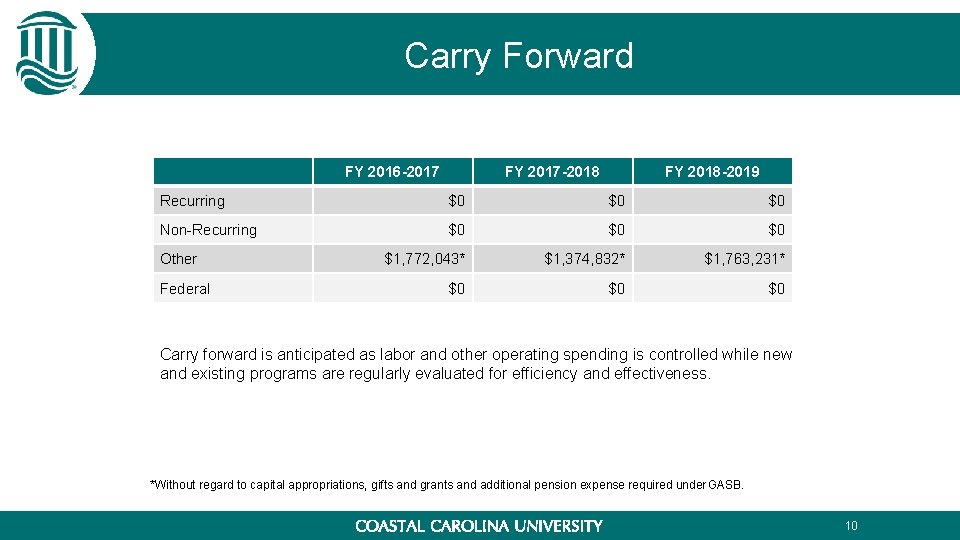
Carry Forward FY 2016 -2017 FY 2017 -2018 FY 2018 -2019 Recurring $0 $0 $0 Non-Recurring $0 $0 $0 $1, 772, 043* $1, 374, 832* $1, 763, 231* $0 $0 $0 Other Federal Carry forward is anticipated as labor and other operating spending is controlled while new and existing programs are regularly evaluated for efficiency and effectiveness. *Without regard to capital appropriations, gifts and grants and additional pension expense required under GASB. 10
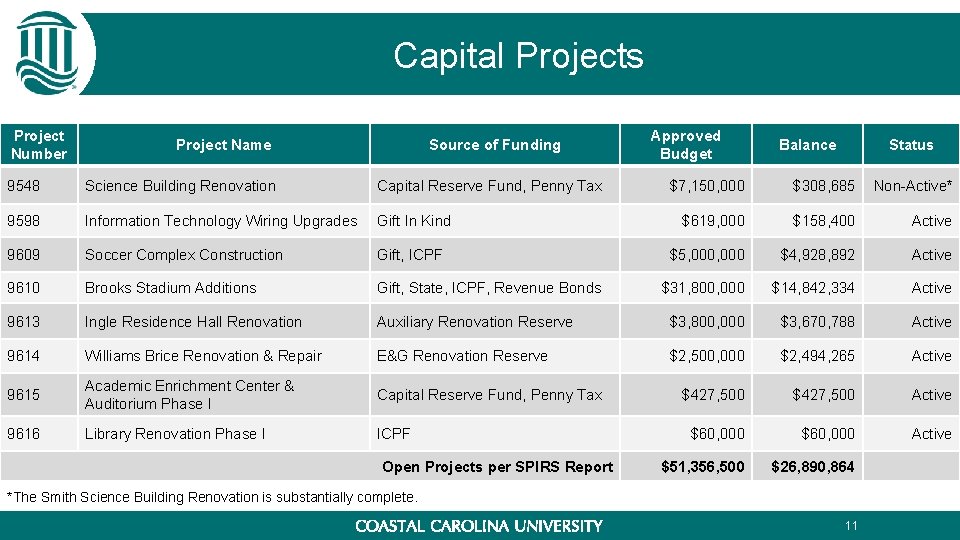
Capital Projects Project Number Project Name Source of Funding 9548 Science Building Renovation Capital Reserve Fund, Penny Tax 9598 Information Technology Wiring Upgrades Gift In Kind 9609 Soccer Complex Construction Gift, ICPF 9610 Brooks Stadium Additions Gift, State, ICPF, Revenue Bonds 9613 Ingle Residence Hall Renovation 9614 Approved Budget Balance Status $7, 150, 000 $308, 685 Non-Active* $619, 000 $158, 400 Active $5, 000 $4, 928, 892 Active $31, 800, 000 $14, 842, 334 Active Auxiliary Renovation Reserve $3, 800, 000 $3, 670, 788 Active Williams Brice Renovation & Repair E&G Renovation Reserve $2, 500, 000 $2, 494, 265 Active 9615 Academic Enrichment Center & Auditorium Phase I Capital Reserve Fund, Penny Tax $427, 500 Active 9616 Library Renovation Phase I ICPF $60, 000 Active $51, 356, 500 $26, 890, 864 Open Projects per SPIRS Report *The Smith Science Building Renovation is substantially complete. 11
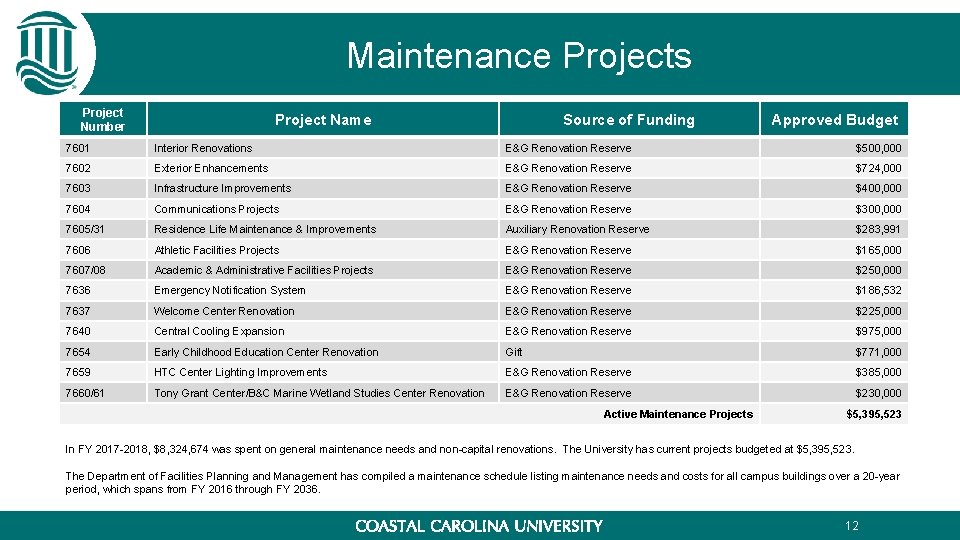
Maintenance Projects Project Number Project Name Source of Funding Approved Budget 7601 Interior Renovations E&G Renovation Reserve $500, 000 7602 Exterior Enhancements E&G Renovation Reserve $724, 000 7603 Infrastructure Improvements E&G Renovation Reserve $400, 000 7604 Communications Projects E&G Renovation Reserve $300, 000 7605/31 Residence Life Maintenance & Improvements Auxiliary Renovation Reserve $283, 991 7606 Athletic Facilities Projects E&G Renovation Reserve $165, 000 7607/08 Academic & Administrative Facilities Projects E&G Renovation Reserve $250, 000 7636 Emergency Notification System E&G Renovation Reserve $186, 532 7637 Welcome Center Renovation E&G Renovation Reserve $225, 000 7640 Central Cooling Expansion E&G Renovation Reserve $975, 000 7654 Early Childhood Education Center Renovation Gift $771, 000 7659 HTC Center Lighting Improvements E&G Renovation Reserve $385, 000 7660/61 Tony Grant Center/B&C Marine Wetland Studies Center Renovation E&G Renovation Reserve $230, 000 Active Maintenance Projects $5, 395, 523 In FY 2017 -2018, $8, 324, 674 was spent on general maintenance needs and non-capital renovations. The University has current projects budgeted at $5, 395, 523. The Department of Facilities Planning and Management has compiled a maintenance schedule listing maintenance needs and costs for all campus buildings over a 20 -year period, which spans from FY 2016 through FY 2036. 12
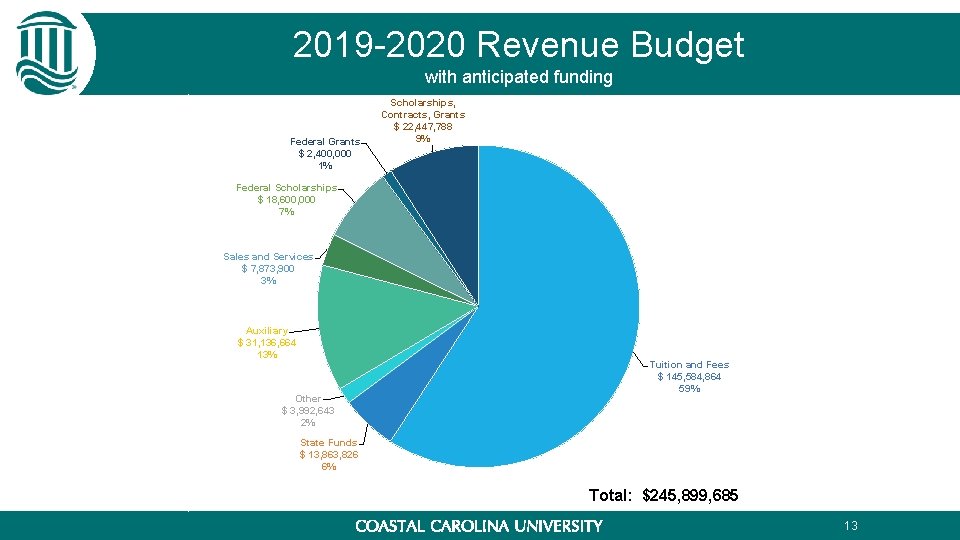
2019 -2020 Revenue Budget with anticipated funding Federal Grants $ 2, 400, 000 1% Scholarships, Contracts, Grants $ 22, 447, 788 9% Federal Scholarships $ 18, 600, 000 7% Sales and Services $ 7, 873, 900 3% Auxiliary $ 31, 136, 664 13% Other $ 3, 992, 643 2% Tuition and Fees $ 145, 584, 864 59% State Funds $ 13, 863, 826 6% Total: $245, 899, 685 13
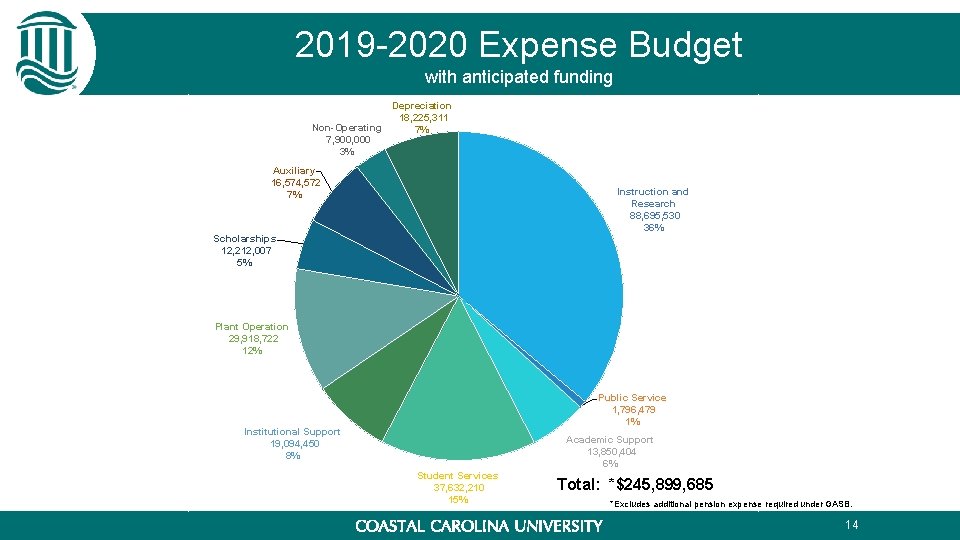
2019 -2020 Expense Budget with anticipated funding Non-Operating 7, 900, 000 3% Depreciation 18, 225, 311 7% Auxiliary 16, 574, 572 7% Instruction and Research 88, 695, 530 36% Scholarships 12, 212, 007 5% Plant Operation 29, 918, 722 12% Public Service 1, 796, 479 1% Institutional Support 19, 094, 450 8% Student Services 37, 632, 210 15% Academic Support 13, 850, 404 6% Total: *$245, 899, 685 *Excludes additional pension expense required under GASB. 14
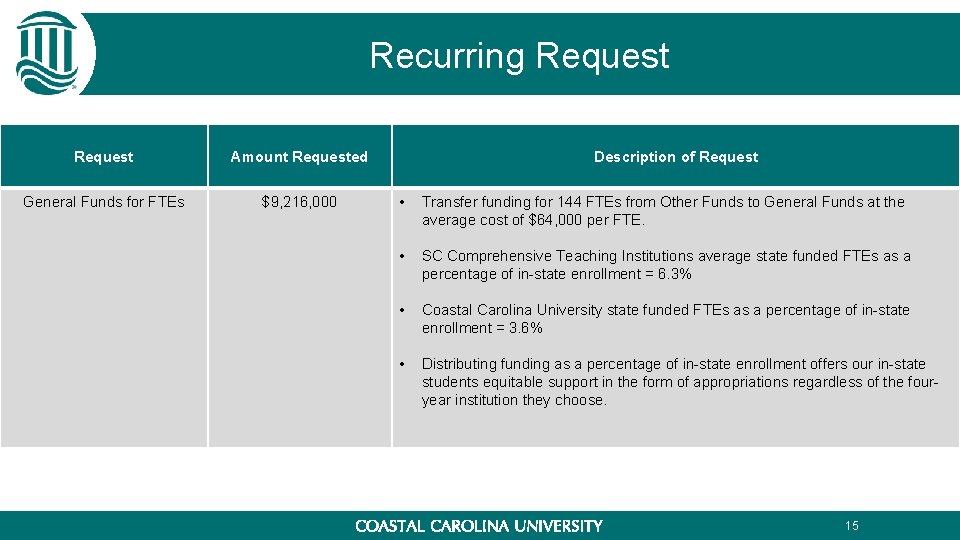
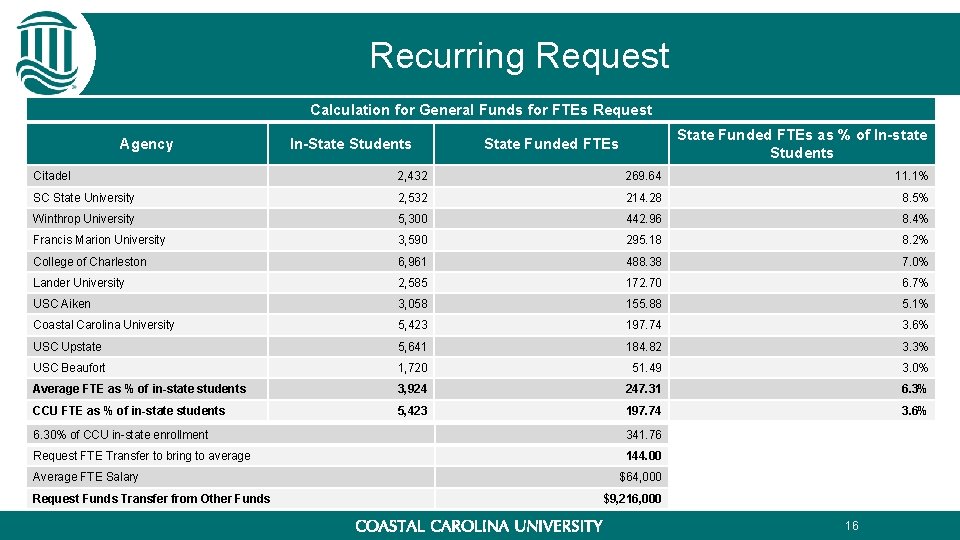
Recurring Request Amount Requested General Funds for FTEs $9, 216, 000 Description of Request • Transfer funding for 144 FTEs from Other Funds to General Funds at the average cost of $64, 000 per FTE. • SC Comprehensive Teaching Institutions average state funded FTEs as a percentage of in-state enrollment = 6. 3% • Coastal Carolina University state funded FTEs as a percentage of in-state enrollment = 3. 6% • Distributing funding as a percentage of in-state enrollment offers our in-state students equitable support in the form of appropriations regardless of the fouryear institution they choose. 15
Recurring Request Calculation for General Funds for FTEs Request Agency In-State Students State Funded FTEs as % of In-state Students State Funded FTEs Citadel 2, 432 269. 64 11. 1% SC State University 2, 532 214. 28 8. 5% Winthrop University 5, 300 442. 96 8. 4% Francis Marion University 3, 590 295. 18 8. 2% College of Charleston 6, 961 488. 38 7. 0% Lander University 2, 585 172. 70 6. 7% USC Aiken 3, 058 155. 88 5. 1% Coastal Carolina University 5, 423 197. 74 3. 6% USC Upstate 5, 641 184. 82 3. 3% USC Beaufort 1, 720 51. 49 3. 0% Average FTE as % of in-state students 3, 924 247. 31 6. 3% CCU FTE as % of in-state students 5, 423 197. 74 3. 6% 6. 30% of CCU in-state enrollment 341. 76 Request FTE Transfer to bring to average 144. 00 Average FTE Salary Request Funds Transfer from Other Funds $64, 000 $9, 216, 000 16
Non-Recurring Request Coastal Carolina University has no requests for non-recurring funding for FY 2019 -2020. 17
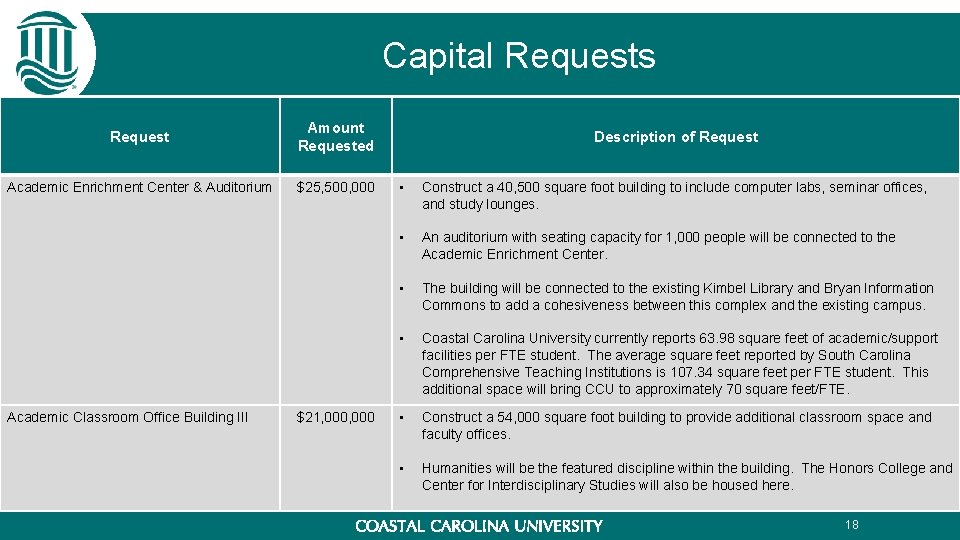
Capital Requests Request Amount Requested Academic Enrichment Center & Auditorium $25, 500, 000 Academic Classroom Office Building III $21, 000 Description of Request • Construct a 40, 500 square foot building to include computer labs, seminar offices, and study lounges. • An auditorium with seating capacity for 1, 000 people will be connected to the Academic Enrichment Center. • The building will be connected to the existing Kimbel Library and Bryan Information Commons to add a cohesiveness between this complex and the existing campus. • Coastal Carolina University currently reports 63. 98 square feet of academic/support facilities per FTE student. The average square feet reported by South Carolina Comprehensive Teaching Institutions is 107. 34 square feet per FTE student. This additional space will bring CCU to approximately 70 square feet/FTE. • Construct a 54, 000 square foot building to provide additional classroom space and faculty offices. • Humanities will be the featured discipline within the building. The Honors College and Center for Interdisciplinary Studies will also be housed here. 18
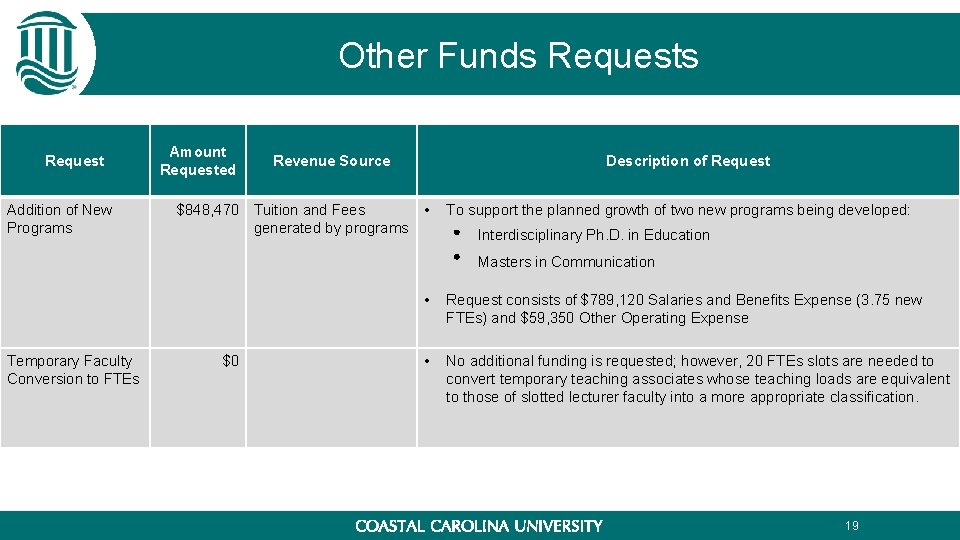
Other Funds Request Addition of New Programs Amount Requested Revenue Source $848, 470 Tuition and Fees generated by programs Description of Request • To support the planned growth of two new programs being developed: Interdisciplinary Ph. D. in Education Masters in Communication Temporary Faculty Conversion to FTEs $0 • Request consists of $789, 120 Salaries and Benefits Expense (3. 75 new FTEs) and $59, 350 Other Operating Expense • No additional funding is requested; however, 20 FTEs slots are needed to convert temporary teaching associates whose teaching loads are equivalent to those of slotted lecturer faculty into a more appropriate classification. 19
Federal Funds Request Coastal Carolina University has no request to increase federal funds authorization for FY 2019 -2020. 20
FTE Request 3. 75 Amount Requested Revenue Source $848, 470 Tuition and Fees generated by programs Purpose Addition of New Programs Description of Request additional 3. 75 FTEs to support the planned growth of two new programs being developed: Interdisciplinary Ph. D. in Education (1. 5 FTEs) Masters in Communication (2. 25 FTEs) 20 $0 Temporary Faculty 20 FTEs slots are requested to convert temporary teaching Conversion to associates whose teaching loads are equivalent to those of slotted FTEs lecturer faculty into a more appropriate classification. No additional funding is requested. Proviso 11. 14. (CHE: Other Funded FTE Revenue) When institutions of higher learning request additional other funded fulltime equivalent positions, the Executive Budget Office shall inform the Commission on Higher Education of its decision regarding the request and whether or not sufficient revenues exist to fund the salary and fringe benefits for the positions. 21
Provisos Coastal Carolina University does not request changes, additions or deletions to these General Provisos 3. 1 (Lottery Expenditure Account: Audit) 117. 34 (GP: Debt Collection Reports) 11. 13 (CHE: Scholarship Awards) 117. 47 (GP: Insurance Claims) 11. 29 (CHE: Abatements) 117. 48 (GP: Organizational Charts) 11. 30 (CHE: Outstanding Institutional Debt) 117. 55 (GP: Employee Bonuses) 117. 8 (GP: State Institutions – Revenues & Income) 117. 58 (GP: Year-End Financial Statements – Penalties) 117. 11 (GP: Fixed Student Fees) 117. 59 (GP: Purchase Card Incentives Rebates) 117. 14 (GP: FTE Management) 117. 64 (GP: Attorney Dues) 117. 16 (GP: Universities & Colleges – Allowance for Presidents) 117. 65 (GP: Employee Recruitment and Retention) 117. 18 (GP: Business Expense Reimbursement) 117. 72 (GP: Printed Report Requirements) 117. 19 (GP: Per Diem) 117. 74 (GP: Fines and Fees Report) 117. 20 (GP: Travel – Subsistence Expenses & Mileage) 117. 75 (GP: Mandatory Furlough) 117. 21 (GP: Organizations Receiving State Appropriations Report) 117. 82 (GP: Commuting Costs) 117. 23 (GP: Carry Forward) 117. 105 (GP: Data Breach Notification) 117. 26 (GP: Travel Report) 117. 112 (GP: Information Technology and Information Security Plans) 117. 28 (GP: State-Operated Day Care Facilities Fees) 117. 119 (GP: Statewide Strategic IT Plan Implementation) 117. 29 (GP: Base Budget Analysis) 117. 122 (GP: State Employee Leave Donation) 117. 30 (GP: Collection on Dishonored Payments) 22
Appendix 23
Student Enrollment Undergraduate and Graduate Enrollment Fall 2013 Fall 2017 Fall 2018 1 -year change 5 -year change Total Headcount 9, 478 10, 663 10, 641 -0. 2% 12. 3% Total FTE 8, 870 10, 112 9, 950 -1. 6% 12. 2% 132, 136 150, 514 148, 096 -1. 6% 12. 1% Student Credit Hours 24
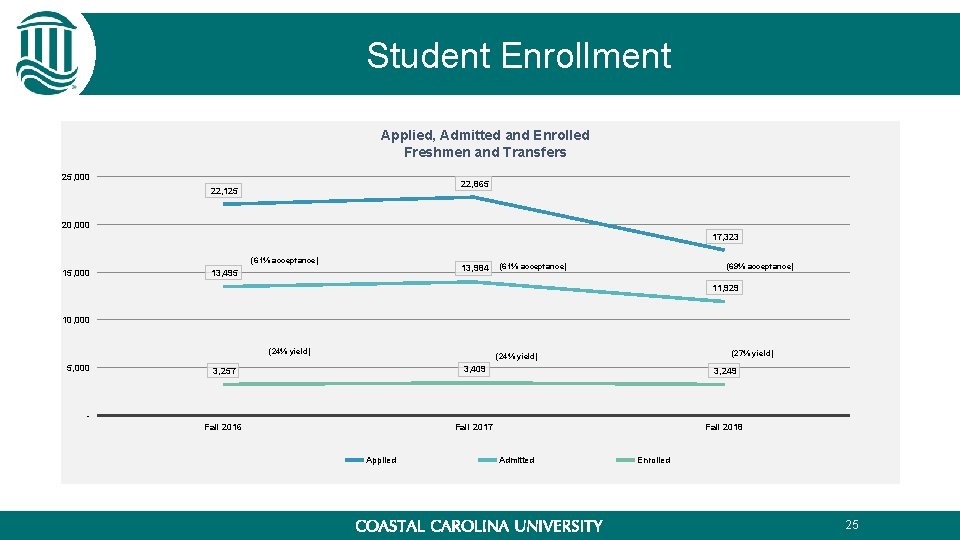
Student Enrollment Applied, Admitted and Enrolled Freshmen and Transfers 25, 000 22, 865 22, 125 20, 000 17, 323 (61% acceptance) 15, 000 13, 984 13, 495 (61% acceptance) (69% acceptance) 11, 929 10, 000 (24% yield) 5, 000 (27% yield) (24% yield) 3, 257 3, 409 3, 249 Fall 2016 Fall 2017 Fall 2018 - Applied Admitted Enrolled 25
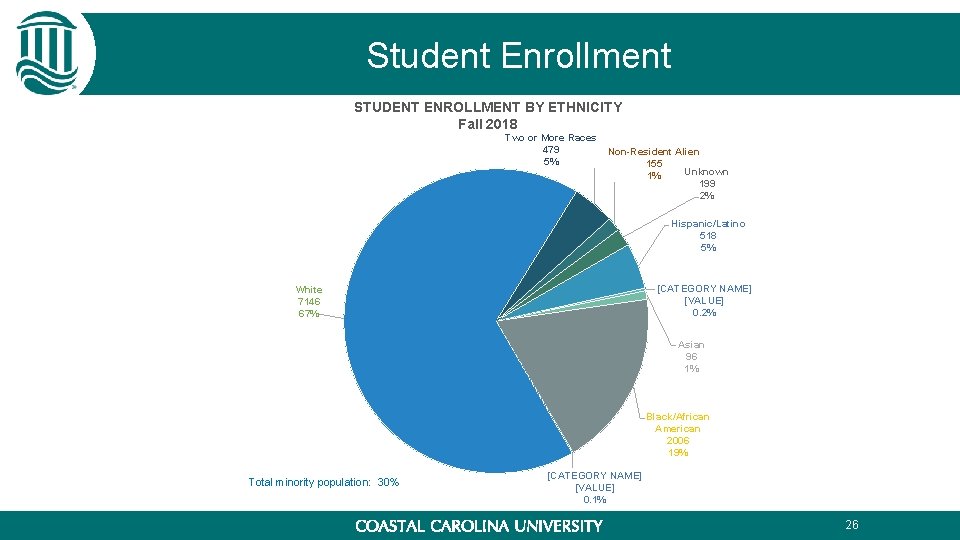
Student Enrollment STUDENT ENROLLMENT BY ETHNICITY Fall 2018 Two or More Races 479 5% Non-Resident Alien 155 Unknown 1% 199 2% Hispanic/Latino 518 5% [CATEGORY NAME] [VALUE] 0. 2% White 7146 67% Asian 96 1% Black/African American 2006 19% Total minority population: 30% [CATEGORY NAME] [VALUE] 0. 1% 26
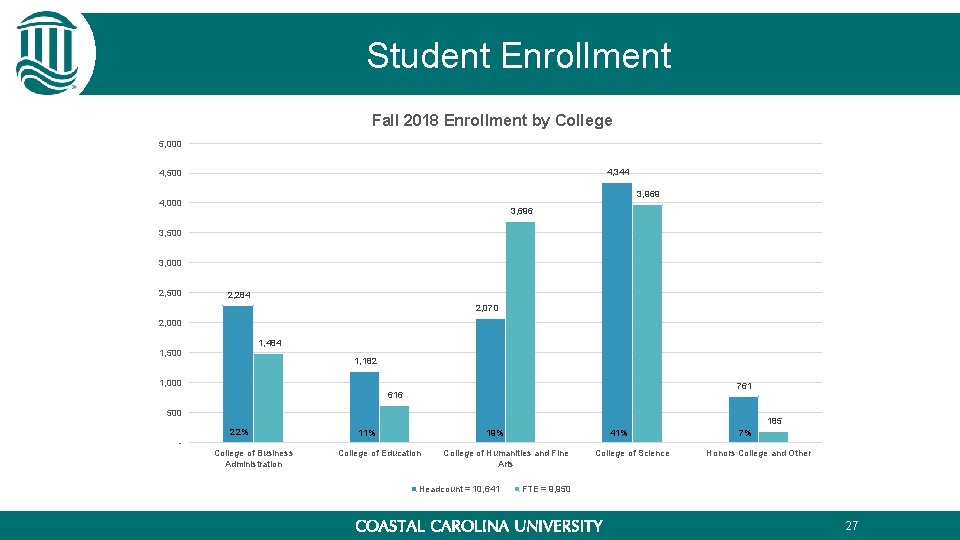
Student Enrollment Fall 2018 Enrollment by College 5, 000 4, 344 4, 500 3, 969 4, 000 3, 696 3, 500 3, 000 2, 500 2, 284 2, 070 2, 000 1, 484 1, 500 1, 182 1, 000 761 616 500 185 22% College of Business Administration 41% 19% 11% College of Education College of Humanities and Fine Arts Headcount = 10, 641 College of Science 7% Honors College and Other FTE = 9, 950 27
Student Enrollment Headcount by Geographic Origin Fall 2018 Out-of-State 5, 247 49% In-State 5, 394 51% FTE by Geographic Origin Fall 2018 Out-of-State 5, 207 52% In-State 4, 743 48% Coastal Carolina University accepts all qualified in-state students who apply. As a means of holding in-state tuition down, out-of-state tuition differential subsidizes costs. 28
Graduation Data First-Time Full-Time Students Starting Fall 2011 Within 6 Years 42% Within 4 Years 26% 0% 10% 22% 10% 20% 30% 2% 9% 22% 40% 50% 25% 23% 60% 70% 19% 80% Graduated from Coastal Carolina University Graduated from Another Institution Enrolled at Coastal Carolina University Enrolled at Another Institution Current Status Unknown 90% 100% Source: http: //www. studentachievementmeasure. org There are 18, 433 alumni living in South Carolina 29
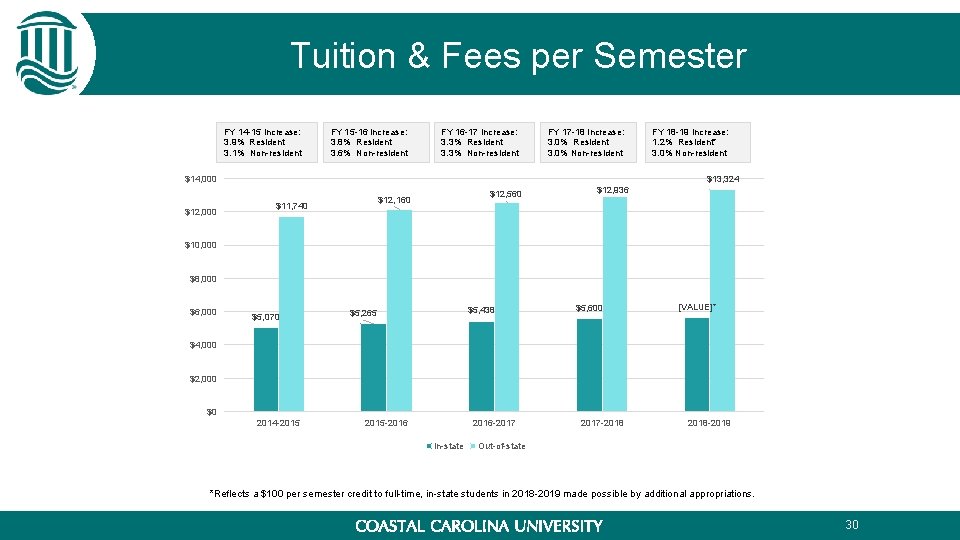
Tuition & Fees per Semester FY 14 -15 Increase: 3. 9% Resident 3. 1% Non-resident FY 15 -16 Increase: 3. 8% Resident 3. 6% Non-resident FY 16 -17 Increase: 3. 3% Resident 3. 3% Non-resident FY 17 -18 Increase: 3. 0% Resident 3. 0% Non-resident $14, 000 $12, 000 FY 18 -19 Increase: 1. 2% Resident* 3. 0% Non-resident $13, 324 $12, 560 $12, 160 $11, 740 $12, 936 $10, 000 $8, 000 $6, 000 $5, 070 $5, 438 $5, 265 $5, 600 [VALUE]* $4, 000 $2, 000 $0 2014 -2015 -2016 -2017 In-state 2017 -2018 -2019 Out-of-state *Reflects a $100 per semester credit to full-time, in-state students in 2018 -2019 made possible by additional appropriations. 30
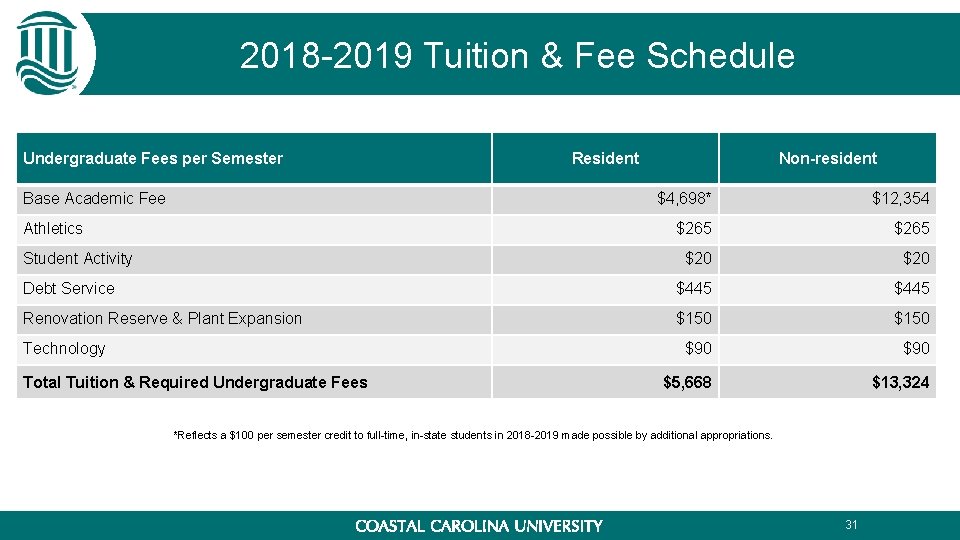
2018 -2019 Tuition & Fee Schedule Undergraduate Fees per Semester Base Academic Fee Resident Non-resident $4, 698* $12, 354 $265 $20 Debt Service $445 Renovation Reserve & Plant Expansion $150 $90 $5, 668 $13, 324 Athletics Student Activity Technology Total Tuition & Required Undergraduate Fees *Reflects a $100 per semester credit to full-time, in-state students in 2018 -2019 made possible by additional appropriations. 31
2018 -2019 Tuition & Fee Schedule 2017 -2018 Full-time Tuition, Room and Board per Semester Tuition Housing (Double Occupancy) Meal Plan (Basic 21) Total Tuition, Room and Board Resident 2018 -2019 Non-resident Resident $ Change % Change Non-resident Resident Non-resident $5, 600 $12, 936 $5, 668* $13, 324 $68* $388 1. 21%* 3. 00% $3, 185** $0 $0 0. 00% $1, 625 $0 $0 0. 00% $10, 410 $17, 746 $10, 478 $18, 134 $68 $388 0. 65% 2. 19% *Reflects a $100 per semester credit to full-time, in-state students in 2018 -2019 made possible by additional appropriations. **Reflects a $75 per semester rebate to students living in University Housing. 32
Scholarships & Grants Source Award Count (Duplicated) Dollars Federal Grants Pell Grant 3497 $ 16, 150, 143 SEOG 463 $ 361, 459 College Work Study 226 $ 123, 434 4, 186 $ 16, 635, 036 SC Need Based Grant 1354 $ 1, 751, 387 LIFE Scholarship 1696 $ 8, 428, 440 HOPE Scholarship 429 $ 1, 081, 290 Palmetto Fellows Scholarship 102 $ 730, 028 SC Air & National Guard Grant 45 $ 175, 500 7 $ 50, 751 3, 633 $12, 217, 396 3132 $ 4, 153, 183 388 $ 5, 267, 196 3, 520 $ 9, 420, 379 822 $ 1, 796, 406 12, 161 $40, 069, 217 Total Federal State Scholarships & Grants CTP for LIFE Total State Institutional Scholarships CCU Academic CCU Athletic Total Institutional External Scholarships TOTALS Duplicated count Unduplicated count 4, 427 33
Outstanding Debt per Proviso 11. 16 Bond Issue/Type/Date Amount of Initial Principal Debt Amount of Remaining Debt as of 11/1/18 Issued Date Final Maturity Purpose of Bond Issue Revenue Bonds Series 2017 - Higher Education Rev Bonds Series 2016 - Higher Education Rev Bonds Series 2015 - Higher Education Rev Bonds Series 2014 - Higher Education Rev Bonds Series 2013 - Higher Education Rev Bonds Series 2012 – Refunding Rev Bonds Total Revenue Bonds $6, 766, 591 $6, 089, 786 5/1/2017 6/1/2026 Refinanced Series 2006 Ref Revenue Bonds - Housing $22, 415, 000 $20, 990, 000 11/23/2016 6/1/2041 Brooks Football Statidum Expansion $87, 020, 000 $81, 565, 000 2/1/2015 6/1/2042 Acquisition of University Place (2, 079 beds) $35, 480, 000 $33, 990, 000 6/1/2014 6/1/2044 Phase II of Student Housing (624 beds) $54, 705, 000 $50, 305, 000 2/1/2013 6/1/2040 Phase I of Student Housing (650 beds) $6, 147, 000 $3, 738, 000 6/1/2012 6/1/2026 Refinanced 1999 Ref Revenue Bonds - Housing $212, 533, 591 $196, 677, 786 General Obligation State Institutional Bonds Series 2016 E – State Institution Bonds $10, 025, 000 $8, 950, 000 10/1/2016 4/1/2027 Refinanced 2002 D and 2006 C Institutional Bonds $54, 000 $36, 645, 000 4/1/2010 4/1/2030 Projects: Kingston Hall Annex, Kimbel Library addition, Smith Science Building Annex, HTC Recreation Complex $64, 025, 000 $45, 595, 000 Series 2010 A – State Institution Bonds Total General Obligation Bonds 34
Employees The University has 3, 191 employees, including students, as of November 2018 with an annual salary expense of $103. 9 million. • • • 516 full-time faculty 205 part-time faculty 972 full-time staff 111 part-time staff 1, 387 undergraduate and graduate student employees FTE State FTEs Authorized Vacant 197. 74 6. 8289 9. 62 0. 9038 Other FTEs 1, 240. 94 115. 0749 Total FTEs 1, 448. 30 122. 8076 Federal FTEs 35
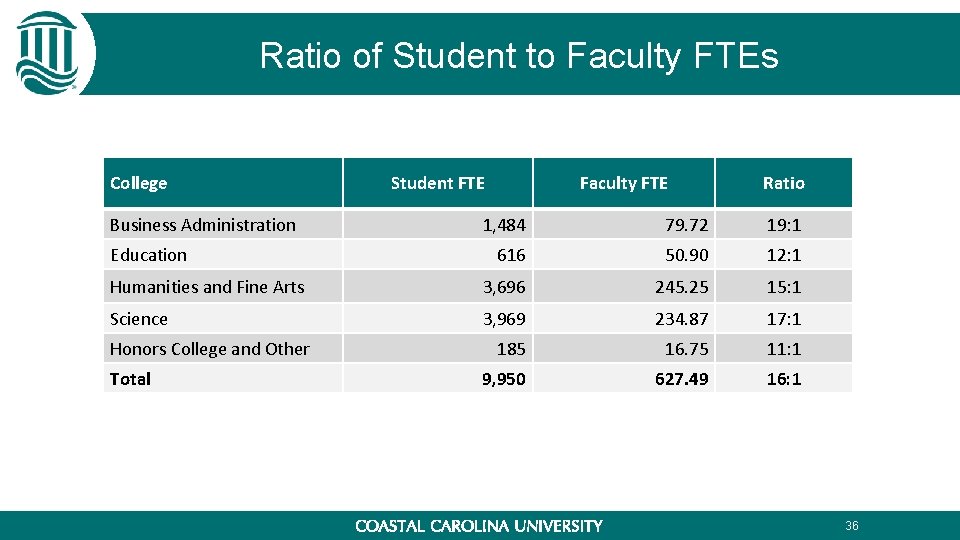
Ratio of Student to Faculty FTEs College Business Administration Student FTE Faculty FTE Ratio 1, 484 79. 72 19: 1 616 50. 90 12: 1 Humanities and Fine Arts 3, 696 245. 25 15: 1 Science 3, 969 234. 87 17: 1 185 16. 75 11: 1 9, 950 627. 49 16: 1 Education Honors College and Other Total 36
Minority Statistics TOTAL EMPLOYEES = 3, 191 TOTAL FACULTY = 721 including students Unknown 49 2% Minority 590 18% TOTAL STAFF = 1, 083 White, non. Hispanic 926 86% Minority 66 9% White, non. Hispanic 643 89% White, non. Hispanic 2, 552 80% Unknown 5 0% Unknown 12 2% Minority 152 14% STUDENT EMPLOYEES = 1, 387 Unknown 32 2% Minority 372 27% White, non. Hispanic 983 71% 37
4% Tuition Waivers & Abatements 2015 -2016 Name of Program 4% Waivers Abatement Full Abatement Partial Level 2016 -2017 -2018 Students Residents Non-Residents Freshmen 522 465 57 510 475 35 504 488 16 Sophomore 406 398 8 423 393 30 410 392 18 Junior 295 276 19 326 304 22 348 338 10 Senior 202 194 8 282 271 11 257 245 12 Other 27 27 0 33 32 1 41 40 1 Total 1, 452 1, 360 92 1, 574 1, 475 99 1, 560 1, 503 57 Freshmen 94 0 94 112 0 112 109 0 109 Sophomore 102 0 102 96 0 96 110 0 110 Junior 112 0 112 109 0 109 107 0 107 Senior 111 0 111 123 0 123 Other 0 0 0 0 0 Total 419 0 419 428 0 428 449 0 449 Freshmen 764 1 763 711 0 711 666 0 666 Sophomore 677 8 669 663 0 663 562 1 561 Junior 425 2 423 443 6 437 476 1 475 Senior 358 2 356 410 0 410 3 407 Other 0 0 0 0 0 Total 2, 224 13 2, 211 2, 227 6 2, 221 2, 114 5 2, 109 Pursuant to Section 59 -101 -620, Coastal Carolina University limits educational fee waivers to no more than four percent of our undergraduate students. The calculation is done using 4% of undergraduate student fee revenue. 38
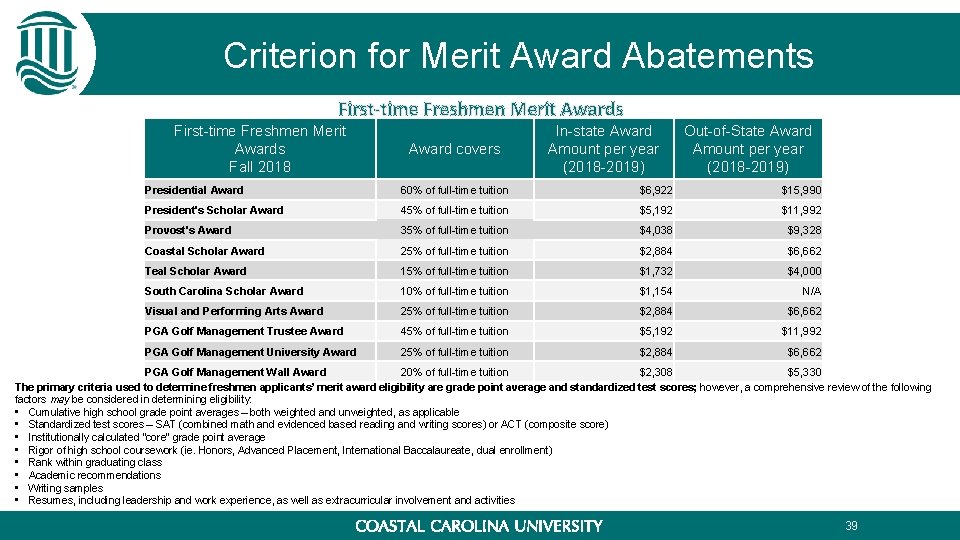
Criterion for Merit Award Abatements First-time Freshmen Merit Awards Fall 2018 Award covers In-state Award Amount per year (2018 -2019) Out-of-State Award Amount per year (2018 -2019) Presidential Award 60% of full-time tuition $6, 922 $15, 990 President's Scholar Award 45% of full-time tuition $5, 192 $11, 992 Provost's Award 35% of full-time tuition $4, 038 $9, 328 Coastal Scholar Award 25% of full-time tuition $2, 884 $6, 662 Teal Scholar Award 15% of full-time tuition $1, 732 $4, 000 South Carolina Scholar Award 10% of full-time tuition $1, 154 N/A Visual and Performing Arts Award 25% of full-time tuition $2, 884 $6, 662 PGA Golf Management Trustee Award 45% of full-time tuition $5, 192 $11, 992 PGA Golf Management University Award 25% of full-time tuition $2, 884 $6, 662 PGA Golf Management Wall Award 20% of full-time tuition $2, 308 $5, 330 The primary criteria used to determine freshmen applicants’ merit award eligibility are grade point average and standardized test scores; however, a comprehensive review of the following factors may be considered in determining eligibility: • Cumulative high school grade point averages – both weighted and unweighted, as applicable • Standardized test scores – SAT (combined math and evidenced based reading and writing scores) or ACT (composite score) • Institutionally calculated “core” grade point average • Rigor of high school coursework (ie. Honors, Advanced Placement, International Baccalaureate, dual enrollment) • Rank within graduating class • Academic recommendations • Writing samples • Resumes, including leadership and work experience, as well as extracurricular involvement and activities 39
Criterion for Merit Award Abatements Transfer Students Merit Awards Award covers In-state Award Amount per year (2018 -2019) Out-of-State Award Amount per year (2018 -2019) Transfer Scholar Level I Award 20% of full-time tuition $2, 308 $5, 330 Transfer Scholar Level II Award 25% of full-time tuition $2, 884 $6, 662 Visual and Performing Arts Award 25% of full-time tuition $2, 884 $6, 662 PGA Golf Management Transfer Award 25% of full-time tuition $2, 884 $6, 662 Transfer Students Merit Awards Fall 2018 The primary criteria to determine transfer applicants’ merit award eligibility is performance at a regionally accredited college or university based on collegiate GPA. Transfer Students Merit Awards Profile of Award Recipients for Fall 2018 Cumulative Collegiate GPA / Credit Hours Transfer Scholar Level I Award 3. 25 to 3. 49 / 30+ transferrable hours Transfer Scholar Level II Award 3. 50 and above / 30+ transferrable hours Visual and Performing Arts Award PGA Golf Management Transfer Award minimum 2. 75 GPA / 30+ transferrable hours In accordance with Section 59 -112 -70 (A), the Board of Trustees of Coastal Carolina University has authorized the abatement of any part or all of the outof-state differential rates for out-of-state students who are recipients of scholarship aid. In Fall 2018, 1, 757 out-of-state students received abatements. 40
Thank you! 41