Alzheimers Disease in New Mexico Michael Landen MD
- Slides: 31
Alzheimer’s Disease in New Mexico Michael Landen, MD, MPH State Epidemiologist New Mexico Department of Health
Objectives • Present existing population based data for Alzheimer’s disease in New Mexico • Discuss possible improvements to population based data for Alzheimer’s disease in New Mexico
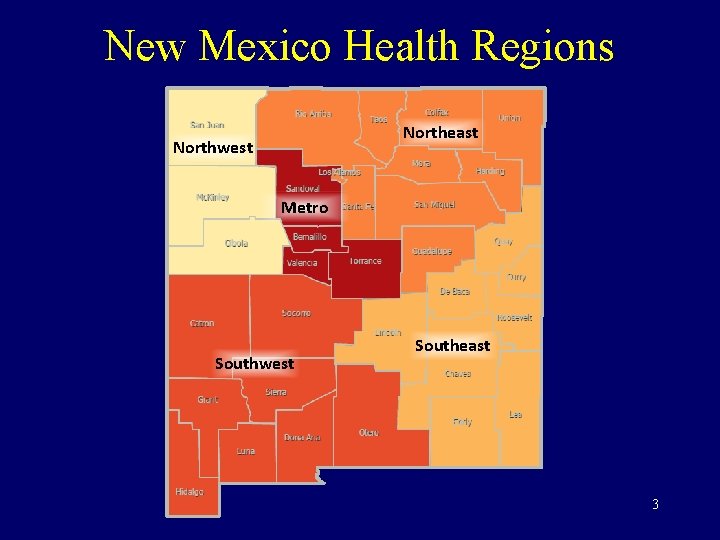
New Mexico Health Regions Northeast Northwest Metro Southwest Southeast 3
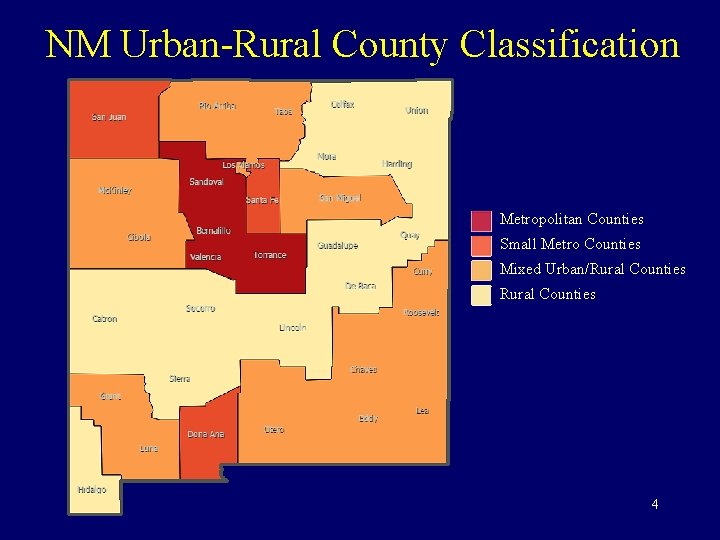
NM Urban-Rural County Classification Metropolitan Counties Small Metro Counties Mixed Urban/Rural Counties 4
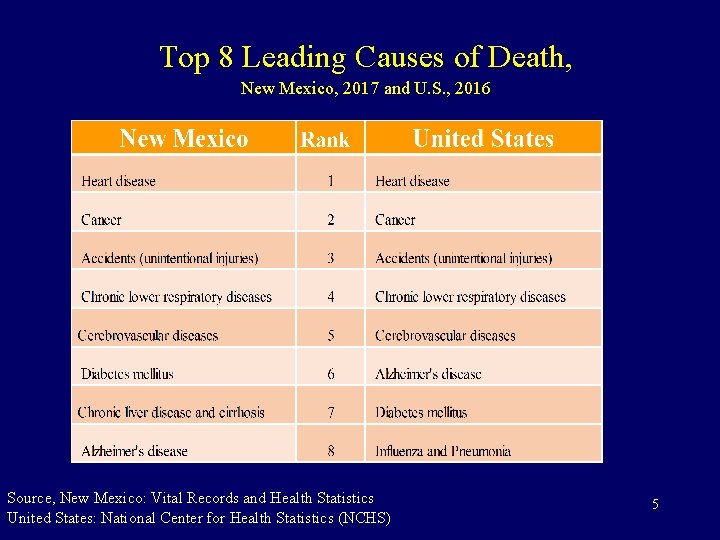
Top 8 Leading Causes of Death, New Mexico, 2017 and U. S. , 2016 Source, New Mexico: Vital Records and Health Statistics United States: National Center for Health Statistics (NCHS) 5
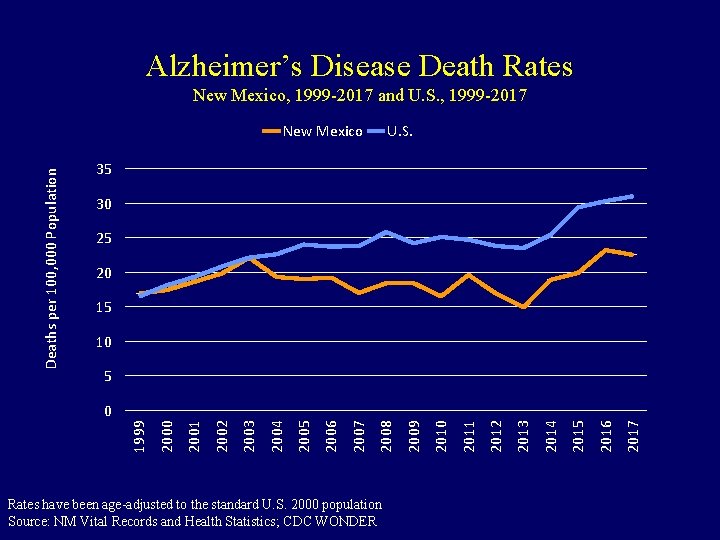
Alzheimer’s Disease Death Rates New Mexico, 1999 -2017 and U. S. , 1999 -2017 Deaths per 100, 000 Population New Mexico U. S. 35 30 25 20 15 10 5 Rates have been age-adjusted to the standard U. S. 2000 population Source: NM Vital Records and Health Statistics; CDC WONDER 2017 2016 2015 2014 2013 2012 2011 2010 2009 2008 2007 2006 2005 2004 2003 2002 2001 2000 1999 0
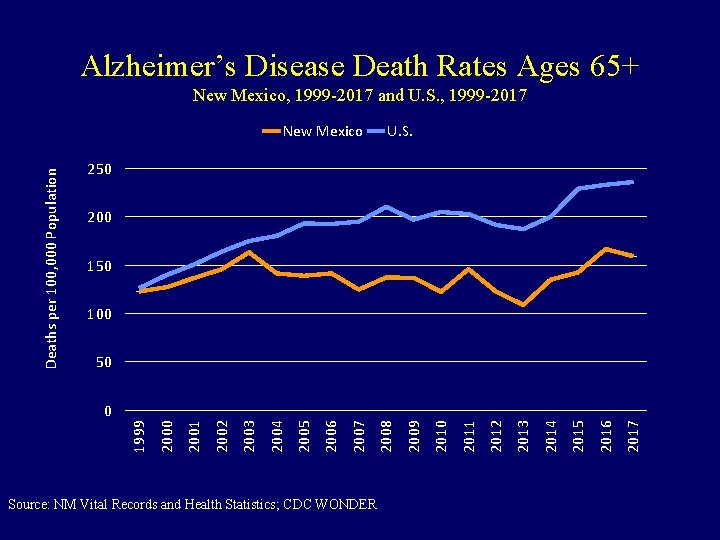
Alzheimer’s Disease Death Rates Ages 65+ New Mexico, 1999 -2017 and U. S. , 1999 -2017 Deaths per 100, 000 Population New Mexico U. S. 250 200 150 100 50 Source: NM Vital Records and Health Statistics; CDC WONDER 2017 2016 2015 2014 2013 2012 2011 2010 2009 2008 2007 2006 2005 2004 2003 2002 2001 2000 1999 0
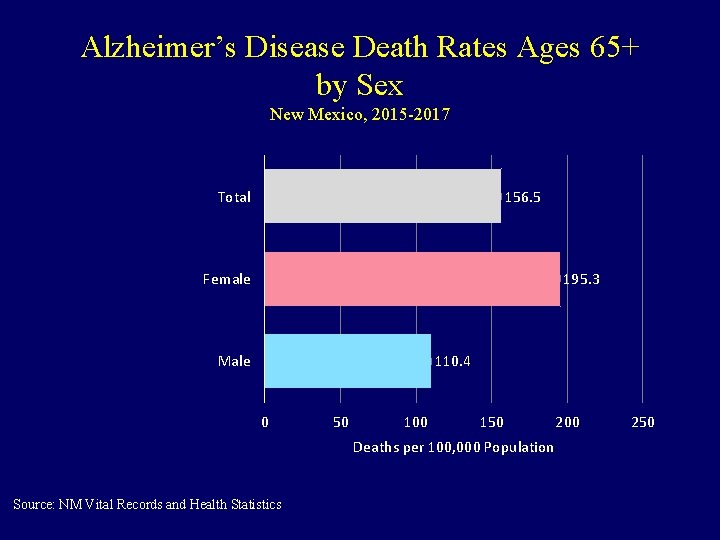
Alzheimer’s Disease Death Rates Ages 65+ by Sex New Mexico, 2015 -2017 Total 156. 5 Female 195. 3 Male 110. 4 0 50 100 150 Deaths per 100, 000 Population Source: NM Vital Records and Health Statistics 200 250
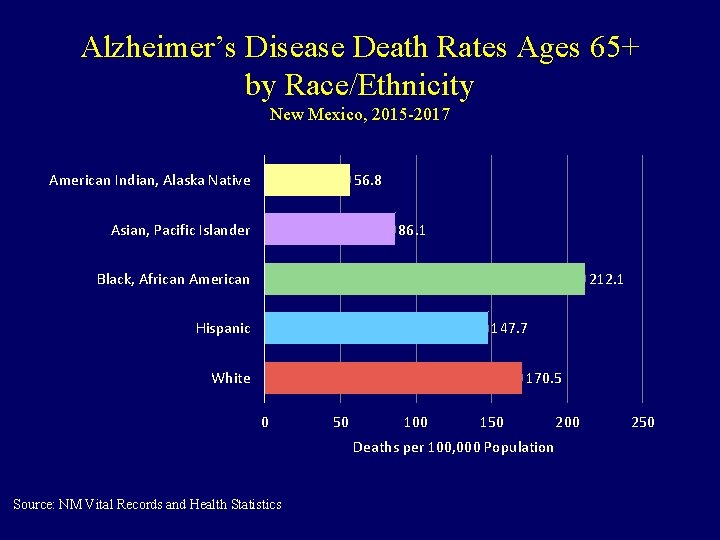
Alzheimer’s Disease Death Rates Ages 65+ by Race/Ethnicity New Mexico, 2015 -2017 American Indian, Alaska Native 56. 8 Asian, Pacific Islander 86. 1 Black, African American 212. 1 Hispanic 147. 7 White 170. 5 0 50 100 150 Deaths per 100, 000 Population Source: NM Vital Records and Health Statistics 200 250
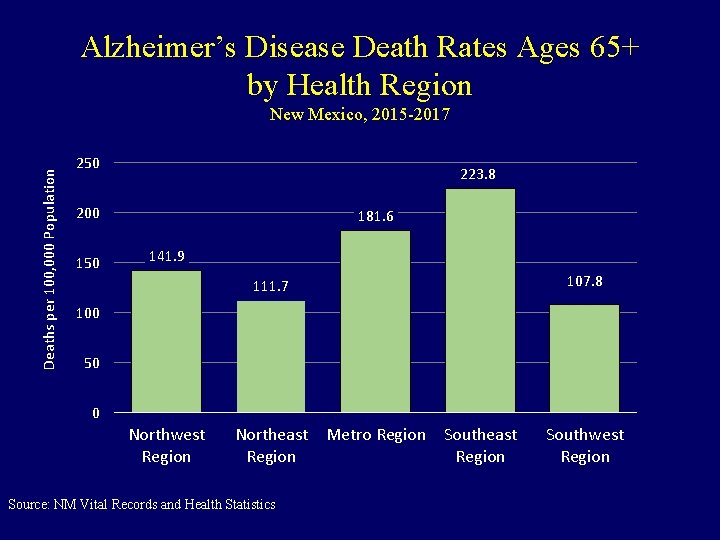
Alzheimer’s Disease Death Rates Ages 65+ by Health Region Deaths per 100, 000 Population New Mexico, 2015 -2017 250 223. 8 200 150 181. 6 141. 9 111. 7 107. 8 100 50 0 Northwest Region Northeast Metro Region Southeast Region Source: NM Vital Records and Health Statistics Southwest Region
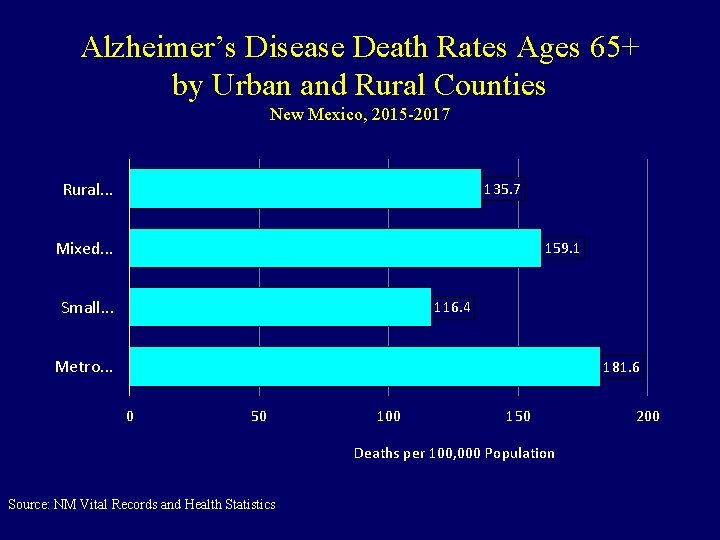
Alzheimer’s Disease Death Rates Ages 65+ by Urban and Rural Counties New Mexico, 2015 -2017 Rural. . . 135. 7 Mixed. . . 159. 1 Small. . . 116. 4 Metro. . . 181. 6 0 50 100 150 Deaths per 100, 000 Population Source: NM Vital Records and Health Statistics 200
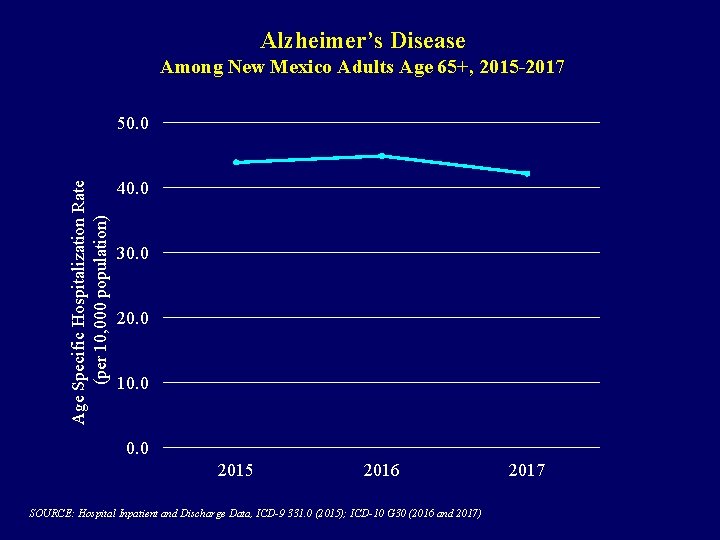
Alzheimer’s Disease Among New Mexico Adults Age 65+, 2015 -2017 Age Specific Hospitalization Rate (per 10, 000 population) 50. 0 40. 0 30. 0 20. 0 10. 0 2015 2016 SOURCE: Hospital Inpatient and Discharge Data, ICD-9 331. 0 (2015); ICD-10 G 30 (2016 and 2017) 2017
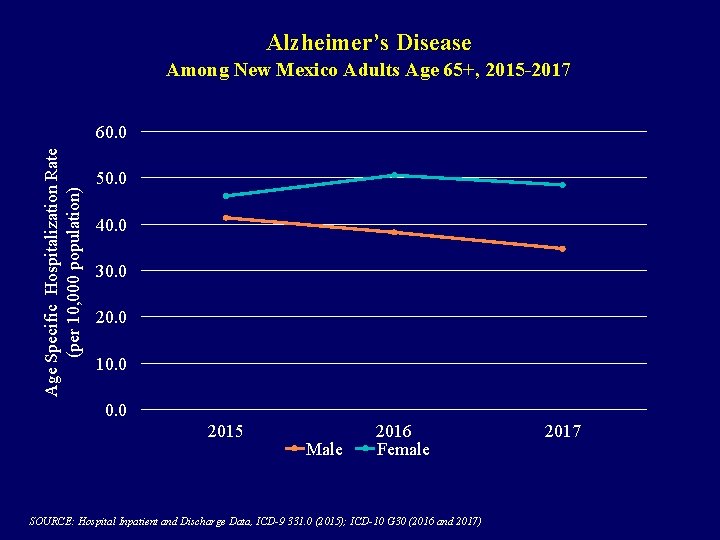
Alzheimer’s Disease Among New Mexico Adults Age 65+, 2015 -2017 Age Specific Hospitalization Rate (per 10, 000 population) 60. 0 50. 0 40. 0 30. 0 20. 0 10. 0 2015 Male 2016 Female SOURCE: Hospital Inpatient and Discharge Data, ICD-9 331. 0 (2015); ICD-10 G 30 (2016 and 2017) 2017
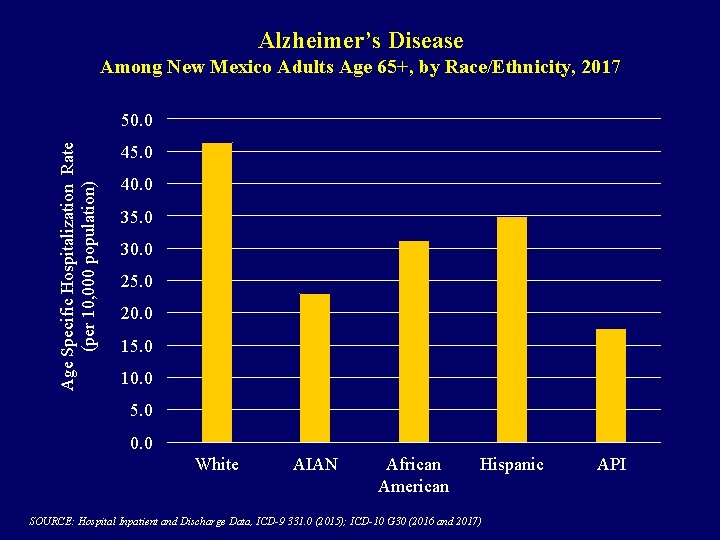
Alzheimer’s Disease Among New Mexico Adults Age 65+, by Race/Ethnicity, 2017 Age Specific Hospitalization Rate (per 10, 000 population) 50. 0 45. 0 40. 0 35. 0 30. 0 25. 0 20. 0 15. 0 10. 0 5. 0 0. 0 White AIAN African American Hispanic SOURCE: Hospital Inpatient and Discharge Data, ICD-9 331. 0 (2015); ICD-10 G 30 (2016 and 2017) API
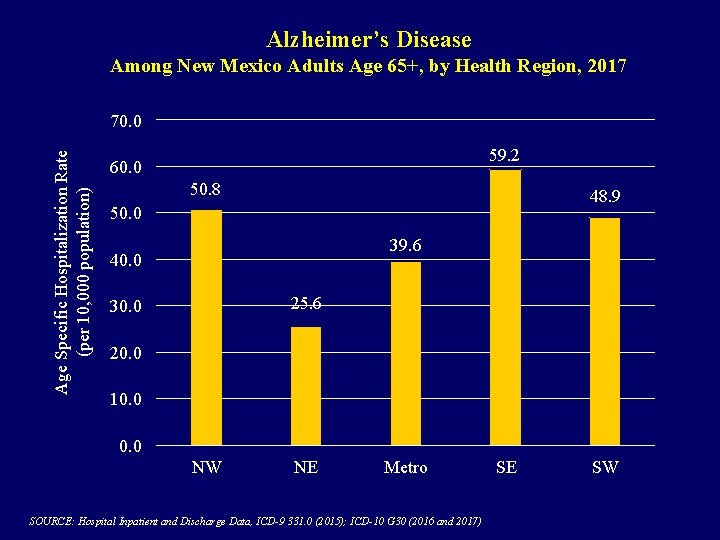
Alzheimer’s Disease Among New Mexico Adults Age 65+, by Health Region, 2017 Age Specific Hospitalization Rate (per 10, 000 population) 70. 0 59. 2 60. 0 50. 8 48. 9 50. 0 39. 6 40. 0 25. 6 30. 0 20. 0 10. 0 NW NE Metro SOURCE: Hospital Inpatient and Discharge Data, ICD-9 331. 0 (2015); ICD-10 G 30 (2016 and 2017) SE SW
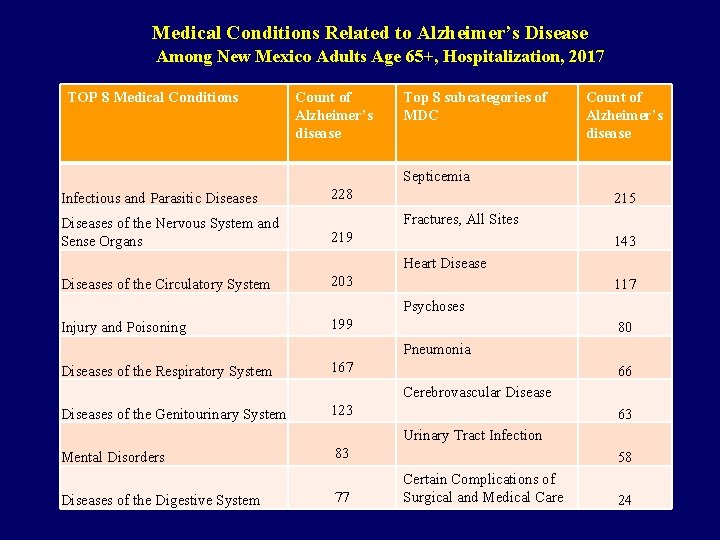
Medical Conditions Related to Alzheimer’s Disease Among New Mexico Adults Age 65+, Hospitalization, 2017 TOP 8 Medical Conditions Count of Alzheimer’s disease Top 8 subcategories of MDC Count of Alzheimer’s disease Septicemia Infectious and Parasitic Diseases of the Nervous System and Sense Organs 228 215 Fractures, All Sites 219 143 Heart Diseases of the Circulatory System 203 117 Psychoses Injury and Poisoning 199 80 Pneumonia Diseases of the Respiratory System 167 66 Cerebrovascular Diseases of the Genitourinary System 123 63 Urinary Tract Infection Mental Disorders Diseases of the Digestive System 83 77 58 Certain Complications of Surgical and Medical Care 24
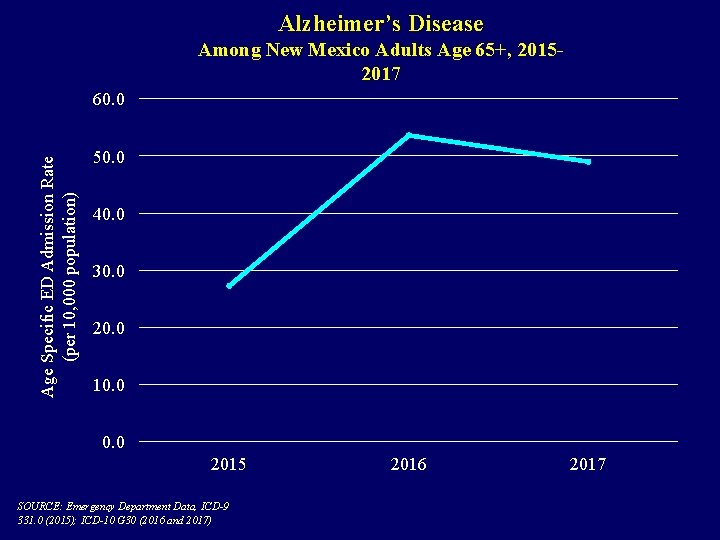
Alzheimer’s Disease Among New Mexico Adults Age 65+, 20152017 Age Specific ED Admission Rate (per 10, 000 population) 60. 0 50. 0 40. 0 30. 0 20. 0 10. 0 2015 SOURCE: Emergency Department Data, ICD-9 331. 0 (2015); ICD-10 G 30 (2016 and 2017) 2016 2017
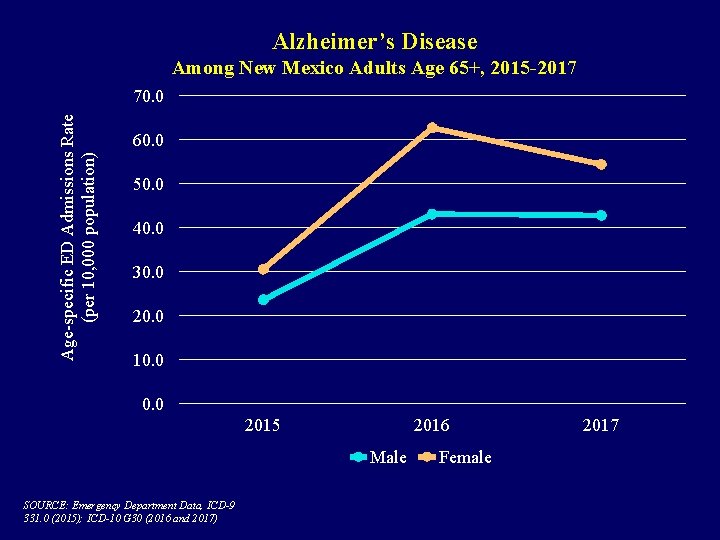
Alzheimer’s Disease Among New Mexico Adults Age 65+, 2015 -2017 Age-specific ED Admissions Rate (per 10, 000 population) 70. 0 60. 0 50. 0 40. 0 30. 0 20. 0 10. 0 2015 2016 Male SOURCE: Emergency Department Data, ICD-9 331. 0 (2015); ICD-10 G 30 (2016 and 2017) Female 2017
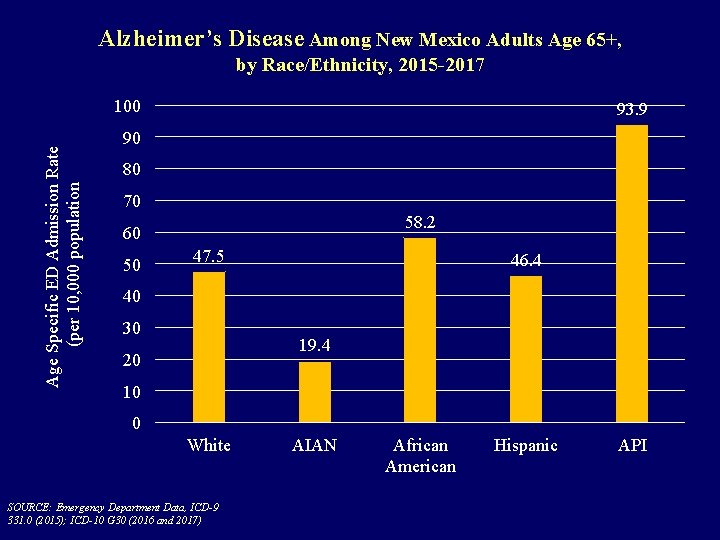
Alzheimer’s Disease Among New Mexico Adults Age 65+, by Race/Ethnicity, 2015 -2017 Age Specific ED Admission Rate (per 10, 000 population 100 93. 9 90 80 70 58. 2 60 50 47. 5 46. 4 40 30 19. 4 20 10 0 White SOURCE: Emergency Department Data, ICD-9 331. 0 (2015); ICD-10 G 30 (2016 and 2017) AIAN African American Hispanic API
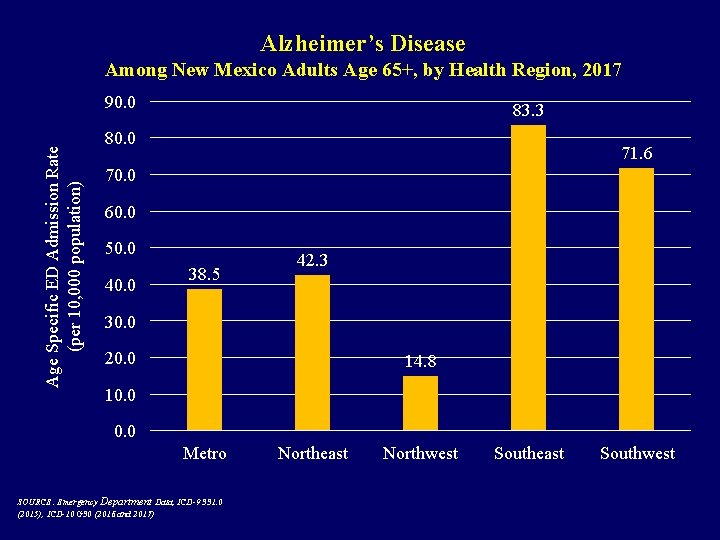
Alzheimer’s Disease Among New Mexico Adults Age 65+, by Health Region, 2017 Age Specific ED Admission Rate (per 10, 000 population) 90. 0 83. 3 80. 0 71. 6 70. 0 60. 0 50. 0 40. 0 38. 5 42. 3 30. 0 20. 0 14. 8 10. 0 Metro SOURCE: Emergency Department Data, ICD-9 331. 0 (2015); ICD-10 G 30 (2016 and 2017) Northeast Northwest Southeast Southwest
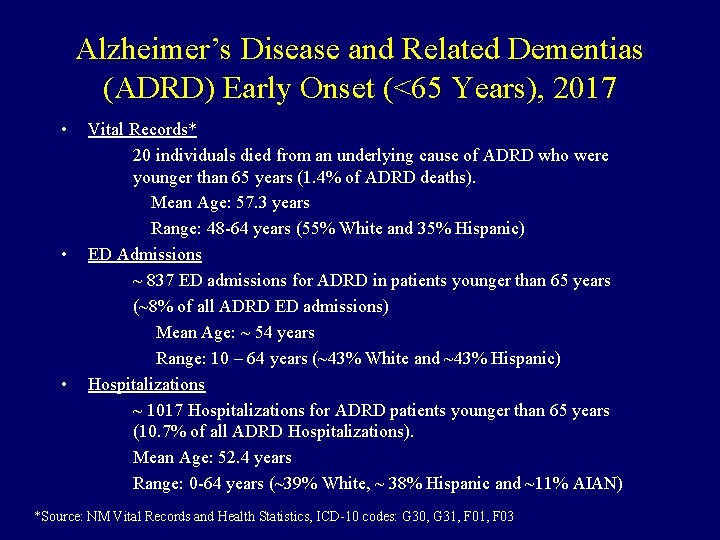
Alzheimer’s Disease and Related Dementias (ADRD) Early Onset (<65 Years), 2017 • • • Vital Records* 20 individuals died from an underlying cause of ADRD who were younger than 65 years (1. 4% of ADRD deaths). Mean Age: 57. 3 years Range: 48 -64 years (55% White and 35% Hispanic) ED Admissions ~ 837 ED admissions for ADRD in patients younger than 65 years (~8% of all ADRD ED admissions) Mean Age: ~ 54 years Range: 10 – 64 years (~43% White and ~43% Hispanic) Hospitalizations ~ 1017 Hospitalizations for ADRD patients younger than 65 years (10. 7% of all ADRD Hospitalizations). Mean Age: 52. 4 years Range: 0 -64 years (~39% White, ~ 38% Hispanic and ~11% AIAN) *Source: NM Vital Records and Health Statistics, ICD-10 codes: G 30, G 31, F 03
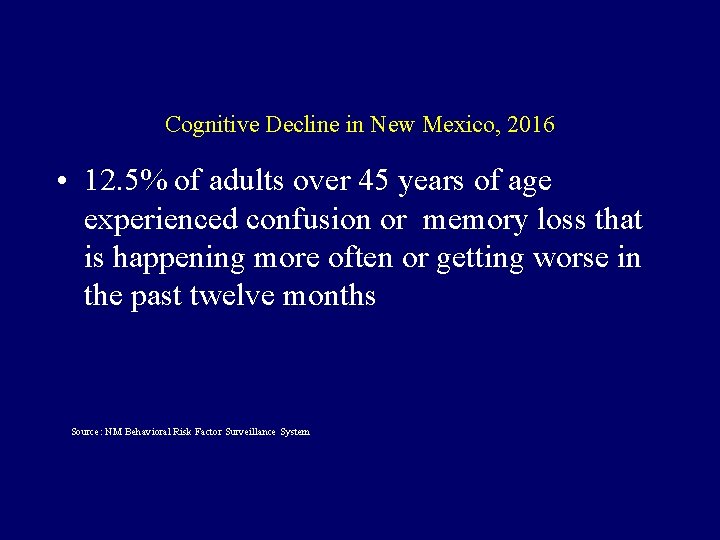
Cognitive Decline in New Mexico, 2016 • 12. 5% of adults over 45 years of age experienced confusion or memory loss that is happening more often or getting worse in the past twelve months Source: NM Behavioral Risk Factor Surveillance System
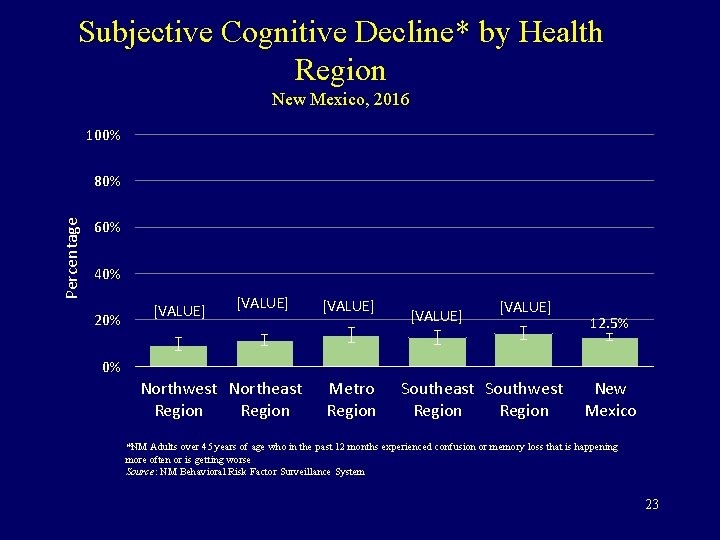
Subjective Cognitive Decline* by Health Region New Mexico, 2016 100% Percentage 80% 60% 40% 20% [VALUE] [VALUE] 12. 5% 0% Northwest Northeast Region Metro Region Southeast Southwest Region New Mexico *NM Adults over 45 years of age who in the past 12 months experienced confusion or memory loss that is happening more often or is getting worse Source: NM Behavioral Risk Factor Surveillance System 23
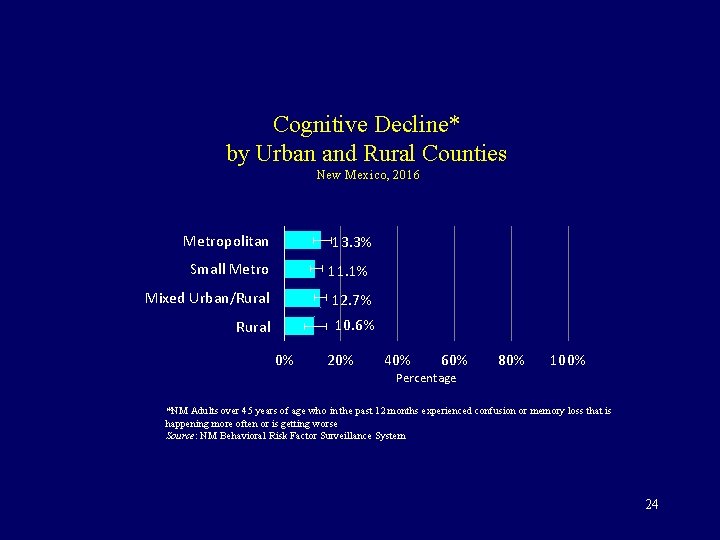
Cognitive Decline* by Urban and Rural Counties New Mexico, 2016 Metropolitan 13. 3% Small Metro 11. 1% Mixed Urban/Rural 12. 7% Rural 10. 6% 0% 20% 40% 60% Percentage 80% 100% *NM Adults over 45 years of age who in the past 12 months experienced confusion or memory loss that is happening more often or is getting worse Source: NM Behavioral Risk Factor Surveillance System 24
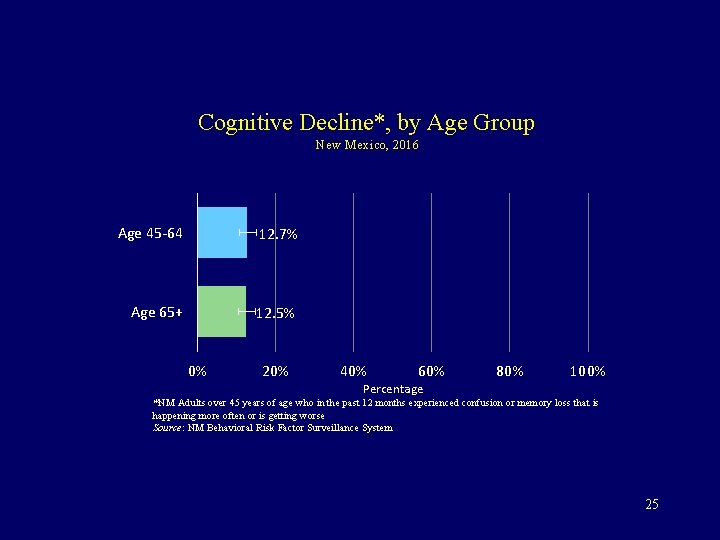
Cognitive Decline*, by Age Group New Mexico, 2016 Age 45 -64 12. 7% Age 65+ 12. 5% 0% 20% 40% 60% Percentage 80% 100% *NM Adults over 45 years of age who in the past 12 months experienced confusion or memory loss that is happening more often or is getting worse Source: NM Behavioral Risk Factor Surveillance System 25
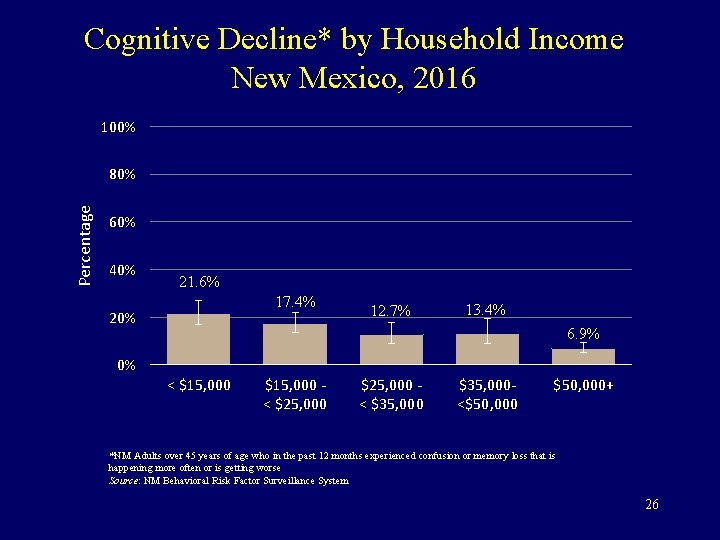
Cognitive Decline* by Household Income New Mexico, 2016 100% Percentage 80% 60% 40% 21. 6% 17. 4% 20% 12. 7% 13. 4% 6. 9% 0% < $15, 000 < $25, 000 < $35, 000<$50, 000+ *NM Adults over 45 years of age who in the past 12 months experienced confusion or memory loss that is happening more often or is getting worse Source: NM Behavioral Risk Factor Surveillance System 26
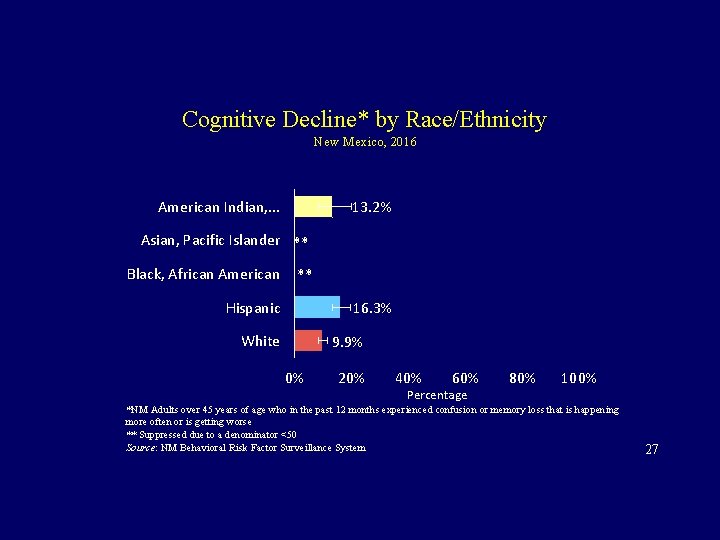
Cognitive Decline* by Race/Ethnicity New Mexico, 2016 American Indian, . . . 13. 2% Asian, Pacific Islander ** Black, African American ** Hispanic 16. 3% White 9. 9% 0% 20% 40% 60% Percentage 80% 100% *NM Adults over 45 years of age who in the past 12 months experienced confusion or memory loss that is happening more often or is getting worse ** Suppressed due to a denominator <50 Source: NM Behavioral Risk Factor Surveillance System 27
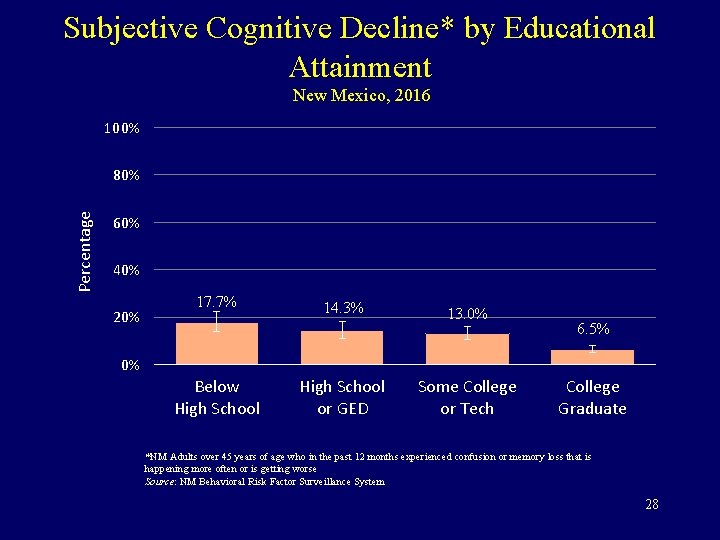
Subjective Cognitive Decline* by Educational Attainment New Mexico, 2016 100% Percentage 80% 60% 40% 20% 17. 7% 14. 3% 13. 0% 6. 5% 0% Below High School or GED Some College or Tech College Graduate *NM Adults over 45 years of age who in the past 12 months experienced confusion or memory loss that is happening more often or is getting worse Source: NM Behavioral Risk Factor Surveillance System 28
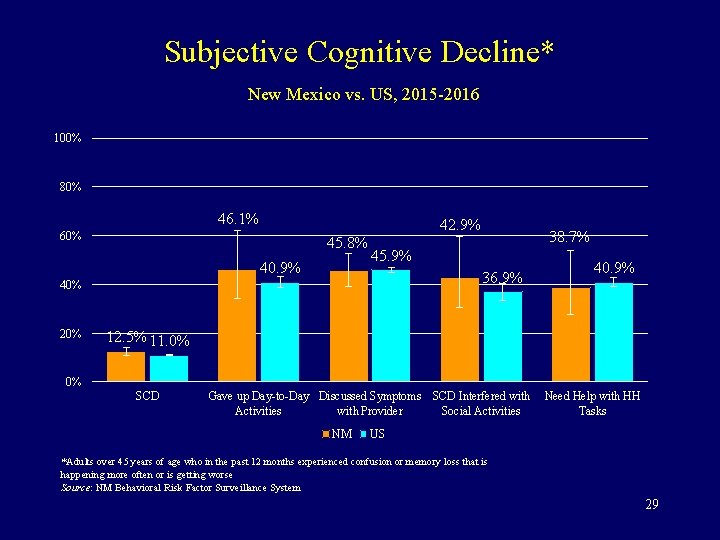
Subjective Cognitive Decline* New Mexico vs. US, 2015 -2016 100% 80% 46. 1% 42. 9% 60% 45. 8% 40. 9% 45. 9% 36. 9% 40% 20% 38. 7% 40. 9% 12. 5% 11. 0% 0% SCD Gave up Day-to-Day Discussed Symptoms SCD Interfered with Activities with Provider Social Activities NM Need Help with HH Tasks US *Adults over 45 years of age who in the past 12 months experienced confusion or memory loss that is happening more often or is getting worse Source: NM Behavioral Risk Factor Surveillance System 29
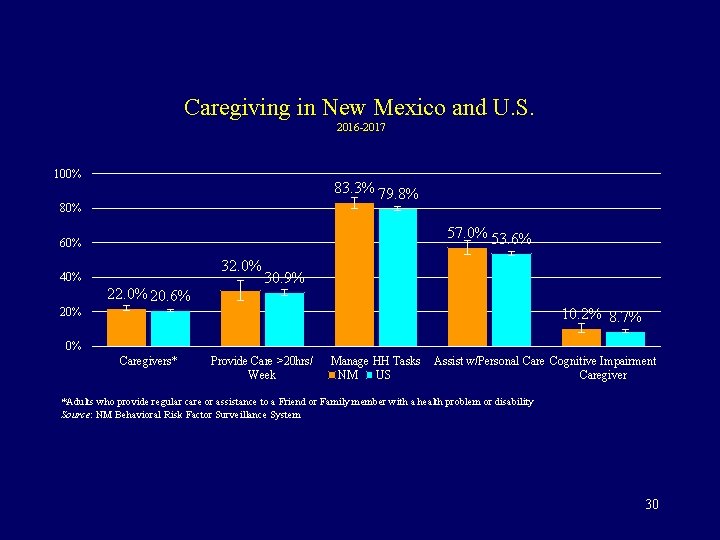
Caregiving in New Mexico and U. S. 2016 -2017 100% 83. 3% 79. 8% 80% 57. 0% 53. 6% 60% 32. 0% 40% 22. 0% 20. 6% 30. 9% 10. 2% 8. 7% 20% 0% Caregivers* Provide Care >20 hrs/ Week Manage HH Tasks NM US Assist w/Personal Care Cognitive Impairment Caregiver *Adults who provide regular care or assistance to a Friend or Family member with a health problem or disability Source: NM Behavioral Risk Factor Surveillance System 30
Discussion • What additional analyses of existing population based data are needed for NM? • What additional population based data is needed on Alzheimer’s disease for NM?