Alternative Child Support Models Washington Child Support Group


 Percentage of Obligor Income (13 States)")


 Income (HH Filer) $57, 022 $36, 788 Payroll Tax 4,")
 Combined Net Income (3, 663+2,")

- Slides: 24
Alternative Child Support Models Washington Child Support Group December 2007 Session II
Topics • Economics of Divorce • Alternative Child Support Models • Differences in positions on Child Support
Economics of Divorce • Due to a loss of economies of scale in consumption (due to shared consumption goods), without an adequate increase in the total resources to the two newly formed households, at least one of the households will be worse off compared to the martial state. • What should be done? – Award custody to parent with higher income? – Award custody on other criteria or adopt a shared parenting arrangement and structure a payment from one parent to the other to • • • Equalize the economic burden of divorce across the two household? Continue the level of spending on the children that occurred in the martial state Share in the current costs of the children Share the loss in proportion to the parents income -- higher income parent would still be worse off compared to the marital state but better off than the lower income parent Child Support Models differ based upon how they answer the question of what should be done? These are normative choices or judgments.
Criteria • Normative Judgments of how the burden should be shared between the parties • Procedural Fairness • Simplicity • Should the size of the award (order) be affected by the likelihood that the obligor will pay?
Alternative Child Support Models • Income Shares -- Robert Williams • Percentage of Income -- Irv Garfinkel • Melson -- Judge Melson (Delaware) • Hybrid Approaches -- Massachusetts and DC • Cost Shares -- Donald Bieniewicz and Mark Rogers • American Legal Institute (ALI) -- Ira Ellman and Grace Blumberg
Alternative Models in Use Income Shares (33 States) Percentage of Obligor Income (13 States) Other [3 States (HI, DE, MT) are based on Melson Formula; 2 states (DC, MA) use a hybrid approach]
Key Points of Melson • Delaware, Hawaii and Montana use the Melson model • Divides the calculation of support into two parts: ‘basic needs’ and ‘standard of living’ payments • Incorporates directly into the calculation of child support, the needs of the parents to live (the self support reserve is not computed after support has been calculated)
Melson Calculation CP Net Income $1, 000 $2, 000 $3, 000 Self Support Allowance 750 Net Income Available for Primary Support 250 Share of Available Income for Primary Support 1, 250 (16. 7%) (83. 3%) Primary Support (Basic Needs) 1 child = $312, 2 children = $577, 3 children = $815 Primary Support Obligation $96 $577 $481 Income available for SOLA (net income available - support obligation) $154 SOLA (1 child =. 16, 2 children =. 26, 3 children =. 33) Total Obligation (13. 6%) $136 (34. 1%) $681 (27. 2%) $817 Washington State $313 $627 $940 $769 $40 $200
Questions about Melson • Where should we set the self support reserve for adults? • How are basic needs (primary support) to children to be defined? • Use poverty thresholds? If we index these amounts each year should we also consider indexing the awards or the primary support level each year? • Where do the Standard of Living Adjustment (SOLA) come from? How can we verify if they are reasonable?
Comparing Delaware Melson with Washington State • The previous calculations reflect the Melson formula as applied in Delaware (Adult needs $750; primary support for 2 children $577; SOLA 26%) • Computed obligations under the current Washington State guidelines but assumed an adult self support reserve of $750 same as Delaware).
Impact of Self Support Reserve Shown for Washington State
Impact of Self Support Reserve Shown for Washington State
Impact of Self Support Reserve Shown for Washington State
Hybrid Models • Massachusetts and District of Columbia • Up to a threshold level of income, a percentage of income model is used (nonobligor’s income only) then for incomes that are in excess of the threshold, an income shares model is employed.
Massachusetts • Basic Obligation for 2 children -- POI based upon weekly gross income If gross weekly income of Obligor (GINCP) is: Less than $101 discretion of court (min $20) $101 to $280 BO =. 24 x GINCP $281 to $750 BO = $67 +. 28 x (GINCP - 280) Over $750 BO = $199 +. 30 x (GINCP - 750) • NCP’s Obligation = BO if CP’s income is less $385 • If CP’s gross weekly income (GICP) > $385 then
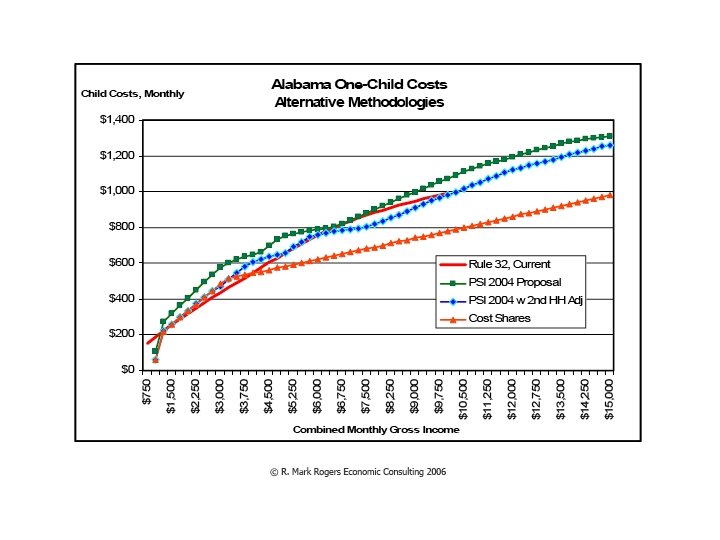
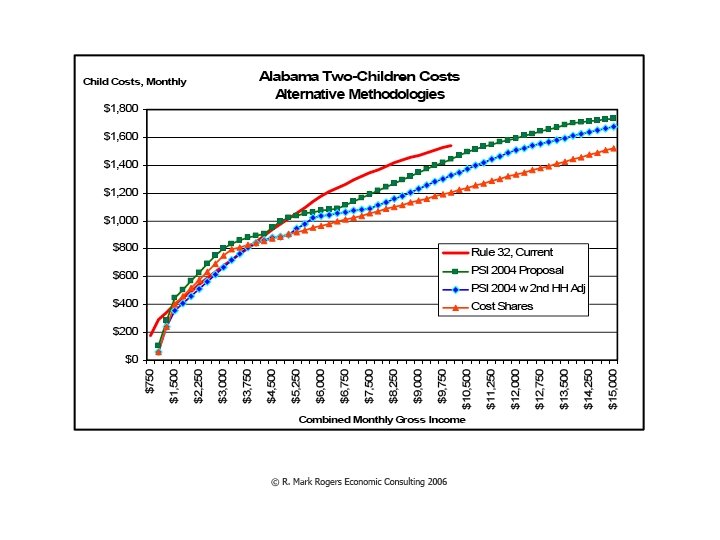
Key Points of Alternative Models ALI • Critical of Income Shares model because it doesn’t equalize incomes • When CP Income < NCP Income, Income Shares is too low • When CP Income > NCP Income, Income Shares is too high Cost Shares • Costs more to raise children in two households than it does in one household (intact) • Should use single parent families to estimate child-rearing costs and modified USDA approach • Child-related Tax Benefits should directly offset child-rearing costs
Similarities and Differences • Both focus upon the current divorced status of the parents not the martial state as Income Shares and POI do • Consequently, spending patterns among single parent families and childless single individuals become the focus of their spending estimates • ALI is quite willing to rely upon equivalence scales to determine child spending patterns while Cost Shares advocates suggest that a modified USDA approach (one that does not use per capita allocations for categories and has different allocation for transportation) is preferable
How Much is Spent on Children after Divorce? • Clearly spending on a child in single parent family depends upon the resources of custodial parent -- the wealthier the parent is the more they will spend on the children • Assume if there is no child support payment, the custodial parent will determine spending on the child given their resources • If support is paid on this amount of spending then when the support is received the custodial parent is wealthier and may spend more on the child • Cost Shares in computing the amount of spending in the single parent family assumes that both parents have equal incomes
Difficulties of Comparison • Neither model has been adopted and consequently implemented versions of these models are hard to locate • ALI is more of a ‘concept’ than an implemented model -Although Ellman is currently trying to get Arizona to do the research to implement his vision • The only version of the Cost Shares I have been able to secure is based upon a report by Mark Rogers to the State of Alabama submitted in March 2006 although there wasn’t a worksheet included
Taxes Jeff Rachel (Single) Income (HH Filer) $57, 022 $36, 788 Payroll Tax 4, 362 2, 814 Federal Income Tax Gross Liability 8, 701 Child Tax Credit 0 Net Liability 8, 701 3, 879 0 3, 879 2, 361 2, 000 361 After Tax Income Monthly $3, 663 $43, 959 $30, 095 $33, 613 $2, 508 $2, 801
Child Support Jeff Rachel Current Method (ignore tax benefits) Combined Net Income (3, 663+2, 508=6, 171) BCSO = 743 441 302 Alternative Method 1 Combined Net Income (3, 663+2, 801=6, 464) BCSO=774 439 335 Alternative Method 2 Combined Net Income (3, 663+2, 508=6, 171) BCSO = 743 Subtract Tax Benefits from BCSO (2, 801 -2, 501=293) 267 183
Discussion and Questions