2018 State Wage Case The Western Australian Economy






- Slides: 39
2018 State Wage Case The Western Australian Economy David Christmas Director Economic and Revenue Forecasting Department of Treasury
Global and National Context Department of Treasury
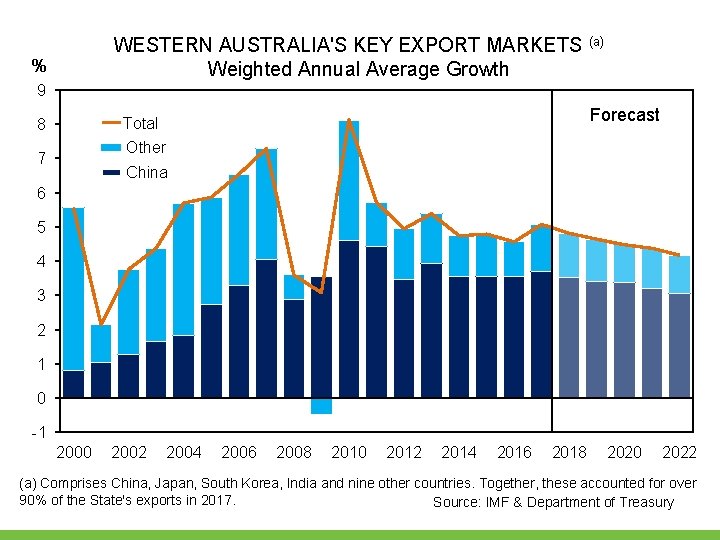
WESTERN AUSTRALIA'S KEY EXPORT MARKETS (a) Weighted Annual Average Growth % 9 Forecast Total 8 Other 7 China 6 5 4 3 2 1 0 -1 2000 2002 2004 2006 2008 2010 2012 2014 2016 2018 2020 2022 (a) Comprises China, Japan, South Korea, India and nine other countries. Together, these accounted for over 90% of the State's exports in 2017. Source: IMF & Department of Treasury
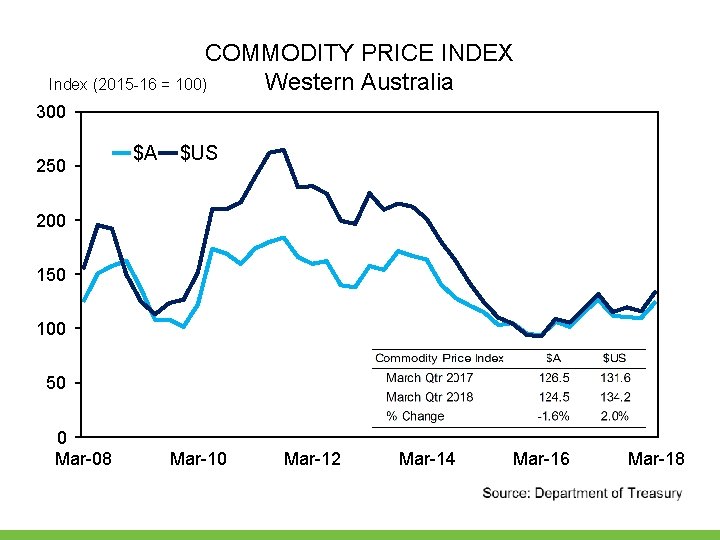
COMMODITY PRICE INDEX Western Australia Index (2015 -16 = 100) 300 250 $A $US 200 150 100 50 0 Mar-08 Mar-10 Mar-12 Mar-14 Mar-16 Mar-18 Department of Treasury
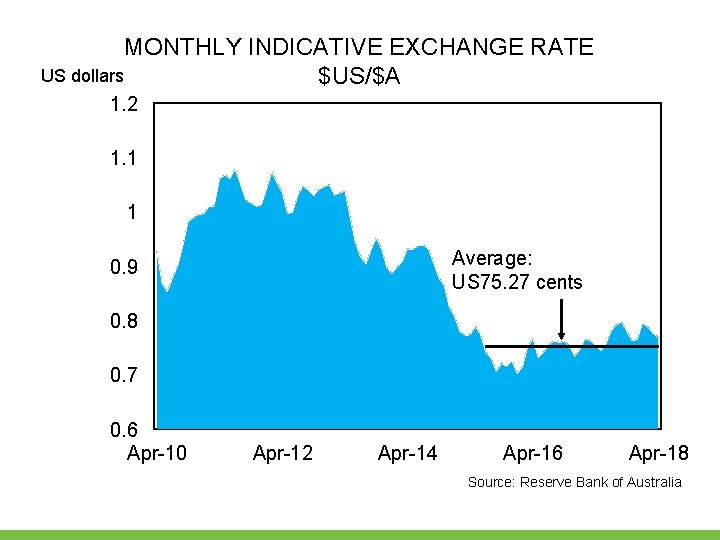
MONTHLY INDICATIVE EXCHANGE RATE US dollars $US/$A 1. 2 1. 1 1 Average: US 75. 27 cents 0. 9 0. 8 0. 7 0. 6 Apr-10 Apr-12 Apr-14 Apr-16 Apr-18 Source: Reserve Bank of Australia Department of Treasury
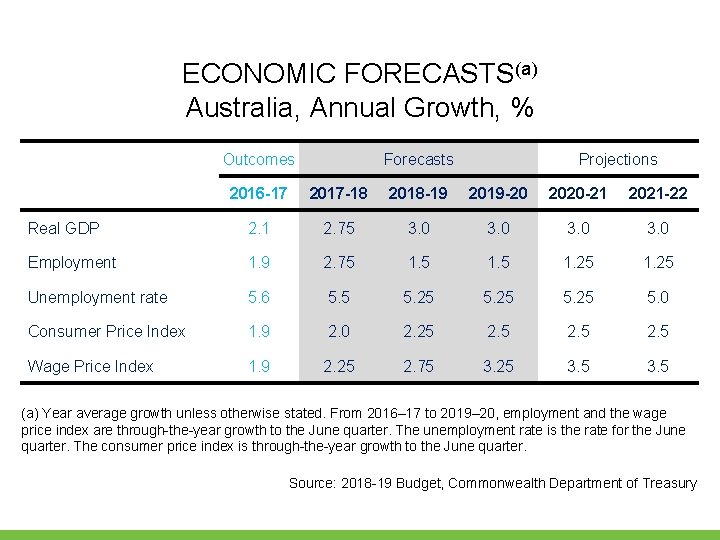
ECONOMIC FORECASTS(a) Australia, Annual Growth, % Outcomes Forecasts Projections 2016 -17 2017 -18 2018 -19 2019 -20 2020 -21 2021 -22 Real GDP 2. 1 2. 75 3. 0 Employment 1. 9 2. 75 1. 25 Unemployment rate 5. 6 5. 5 5. 25 5. 0 Consumer Price Index 1. 9 2. 0 2. 25 2. 5 Wage Price Index 1. 9 2. 25 2. 75 3. 25 3. 5 (a) Year average growth unless otherwise stated. From 2016– 17 to 2019– 20, employment and the wage price index are through-the-year growth to the June quarter. The unemployment rate is the rate for the June quarter. The consumer price index is through-the-year growth to the June quarter. Source: 2018 -19 Budget, Commonwealth Department of Treasury
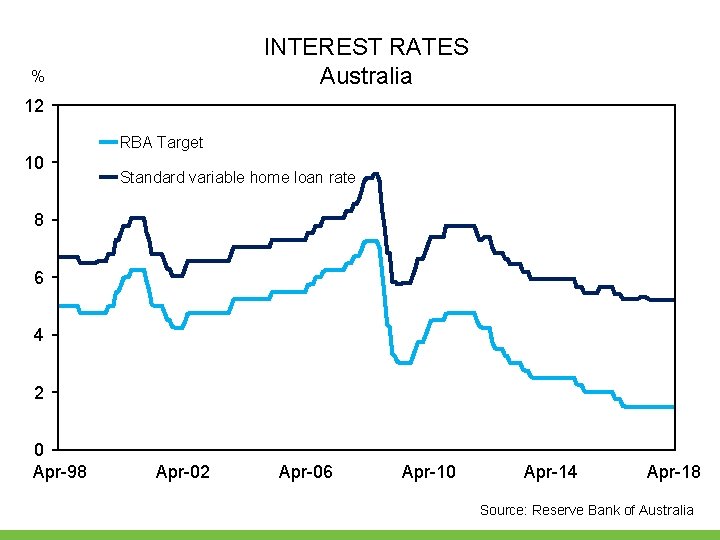
INTEREST RATES Australia % 12 RBA Target 10 Standard variable home loan rate 8 6 4 2 0 Apr-98 Apr-02 Apr-06 Apr-10 Apr-14 Apr-18 Source: Reserve Bank of Australia Department of Treasury
The Western Australian Economy Department of Treasury
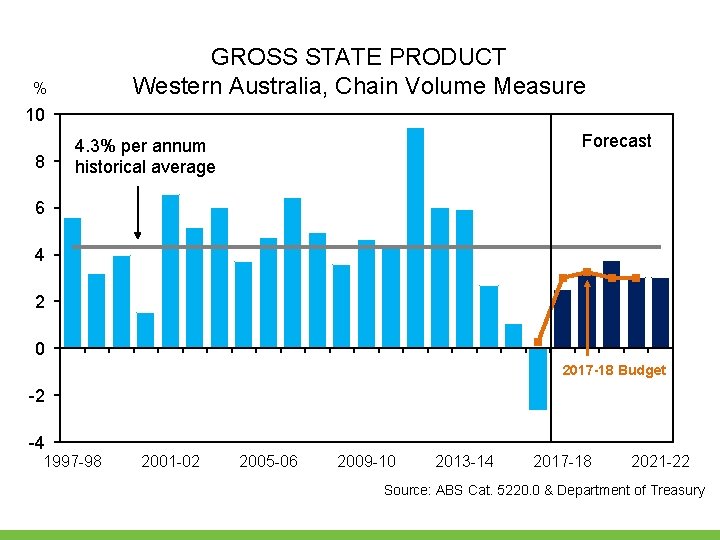
GROSS STATE PRODUCT Western Australia, Chain Volume Measure % 10 8 Forecast 4. 3% per annum historical average 6 4 2 0 2017 -18 Budget -2 -4 1997 -98 2001 -02 2005 -06 2009 -10 2013 -14 2017 -18 2021 -22 Source: ABS Cat. 5220. 0 & Department of Treasury
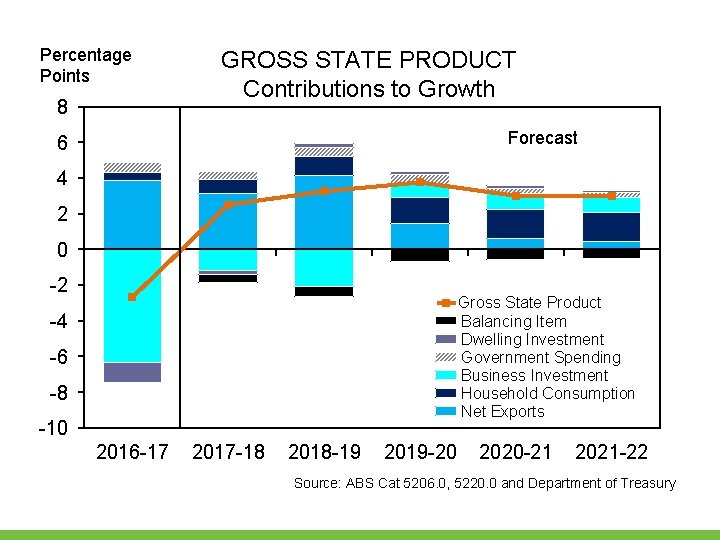
Percentage Points 8 GROSS STATE PRODUCT Contributions to Growth Forecast 6 4 2 0 -2 Gross State Product Balancing Item Dwelling Investment Government Spending Business Investment Household Consumption Net Exports -4 -6 -8 -10 2016 -17 2017 -18 2018 -19 2019 -20 2020 -21 2021 -22 Source: ABS Cat 5206. 0, 5220. 0 and Department of Treasury
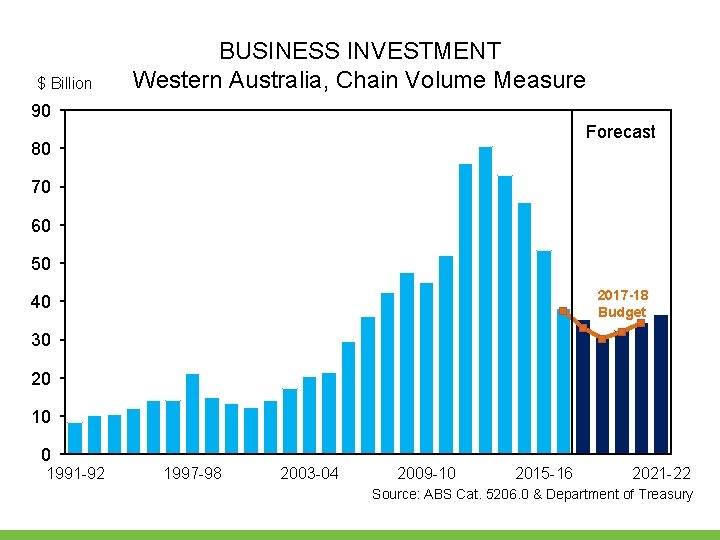
$ Billion BUSINESS INVESTMENT Western Australia, Chain Volume Measure 90 Forecast 80 70 60 50 2017 -18 Budget 40 30 20 10 0 1991 -92 1997 -98 2003 -04 2009 -10 2015 -16 2021 -22 Source: ABS Cat. 5206. 0 & Department of Treasury
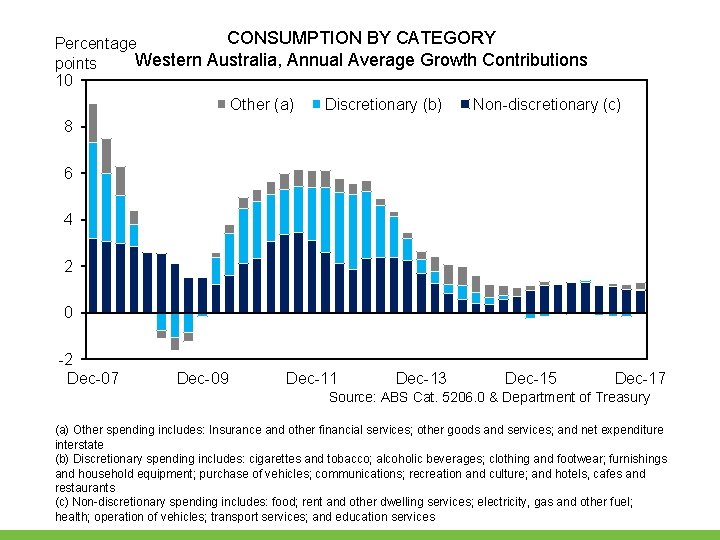
CONSUMPTION BY CATEGORY Percentage Western Australia, Annual Average Growth Contributions points 10 Other (a) Discretionary (b) Non-discretionary (c) 8 6 4 2 0 -2 Dec-07 Dec-09 Dec-11 Dec-13 Dec-15 Dec-17 Source: ABS Cat. 5206. 0 & Department of Treasury (a) Other spending includes: Insurance and other financial services; other goods and services; and net expenditure interstate (b) Discretionary spending includes: cigarettes and tobacco; alcoholic beverages; clothing and footwear; furnishings and household equipment; purchase of vehicles; communications; recreation and culture; and hotels, cafes and restaurants (c) Non-discretionary spending includes: food; rent and other dwelling services; electricity, gas and other fuel; health; operation of vehicles; transport services; and education services Department of Treasury
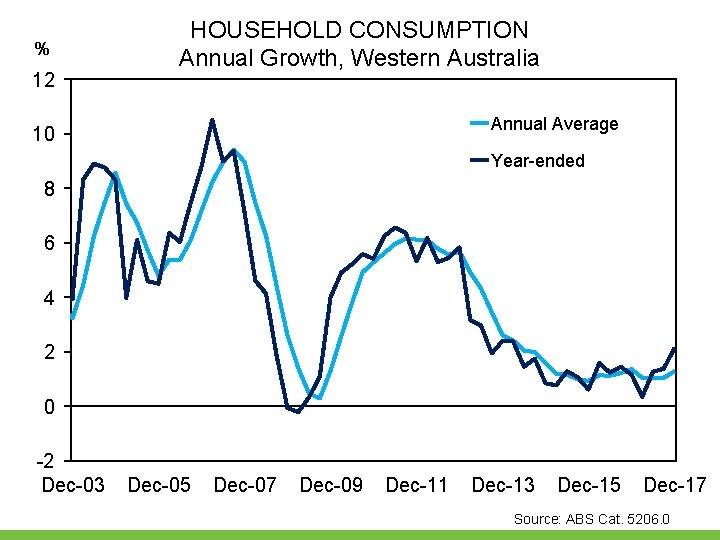
% 12 HOUSEHOLD CONSUMPTION Annual Growth, Western Australia Annual Average 10 Year-ended 8 6 4 2 0 -2 Dec-03 Dec-05 Dec-07 Dec-09 Dec-11 Dec-13 Dec-15 Dec-17 Source: ABS Cat. 5206. 0 Department of Treasury
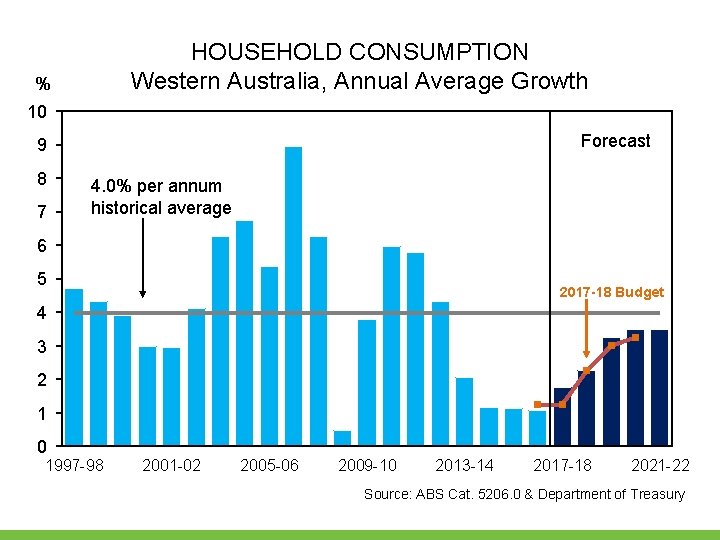
HOUSEHOLD CONSUMPTION Western Australia, Annual Average Growth % 10 Forecast 9 8 7 4. 0% per annum historical average 6 5 2017 -18 Budget 4 3 2 1 0 1997 -98 2001 -02 2005 -06 2009 -10 2013 -14 2017 -18 2021 -22 Source: ABS Cat. 5206. 0 & Department of Treasury
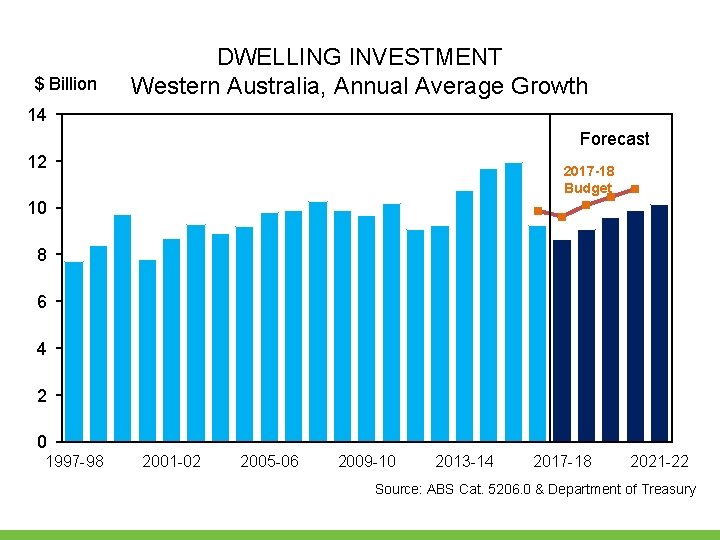
$ Billion DWELLING INVESTMENT Western Australia, Annual Average Growth 14 Forecast 12 2017 -18 Budget 10 8 6 4 2 0 1997 -98 2001 -02 2005 -06 2009 -10 2013 -14 2017 -18 2021 -22 Source: ABS Cat. 5206. 0 & Department of Treasury
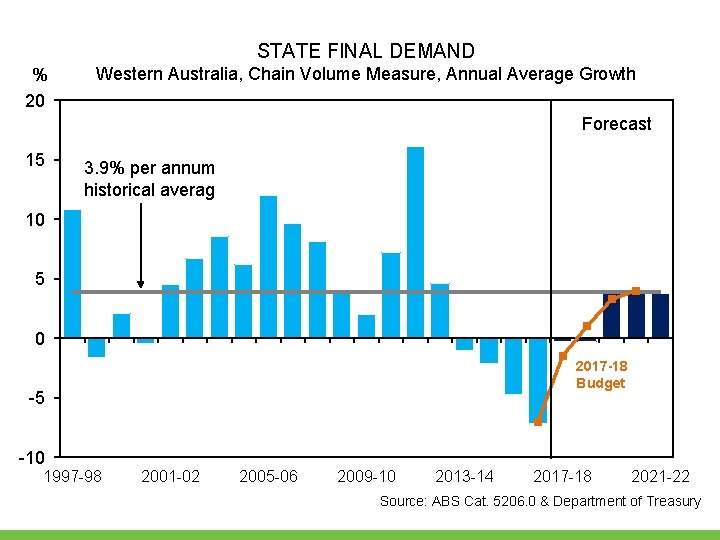
STATE FINAL DEMAND % 20 Western Australia, Chain Volume Measure, Annual Average Growth Forecast 15 3. 9% per annum historical average 10 5 0 2017 -18 Budget -5 -10 1997 -98 2001 -02 2005 -06 2009 -10 2013 -14 2017 -18 2021 -22 Source: ABS Cat. 5206. 0 & Department of Treasury
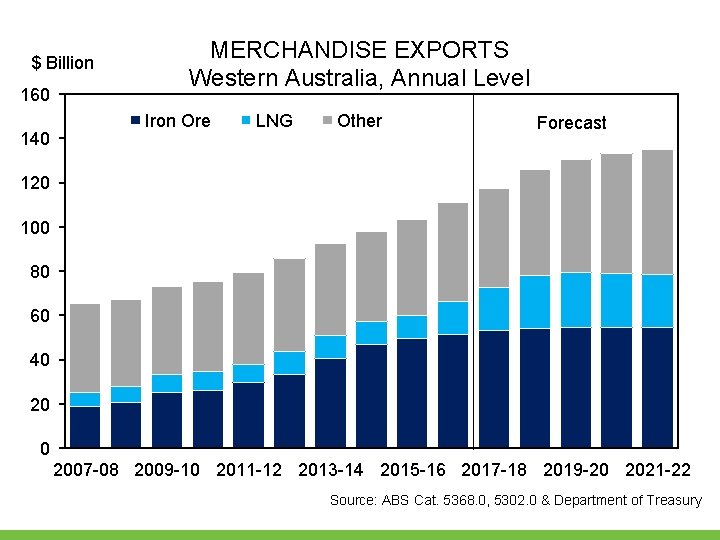
$ Billion 160 140 MERCHANDISE EXPORTS Western Australia, Annual Level Iron Ore LNG Other Forecast 120 100 80 60 40 2007 -08 2009 -10 2011 -12 2013 -14 2015 -16 2017 -18 2019 -20 2021 -22 Source: ABS Cat. 5368. 0, 5302. 0 & Department of Treasury
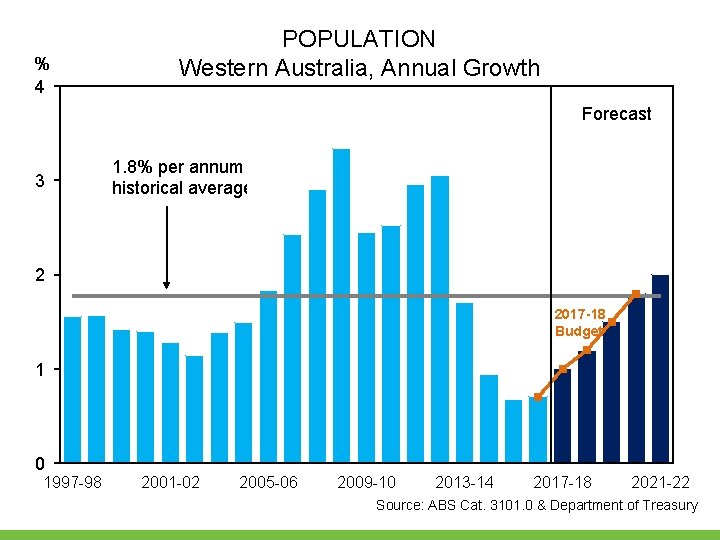
% 4 POPULATION Western Australia, Annual Growth Forecast 3 1. 8% per annum historical average 2 2017 -18 Budget 1 0 1997 -98 2001 -02 2005 -06 2009 -10 2013 -14 2017 -18 2021 -22 Source: ABS Cat. 3101. 0 & Department of Treasury
The Labour Market Department of Treasury
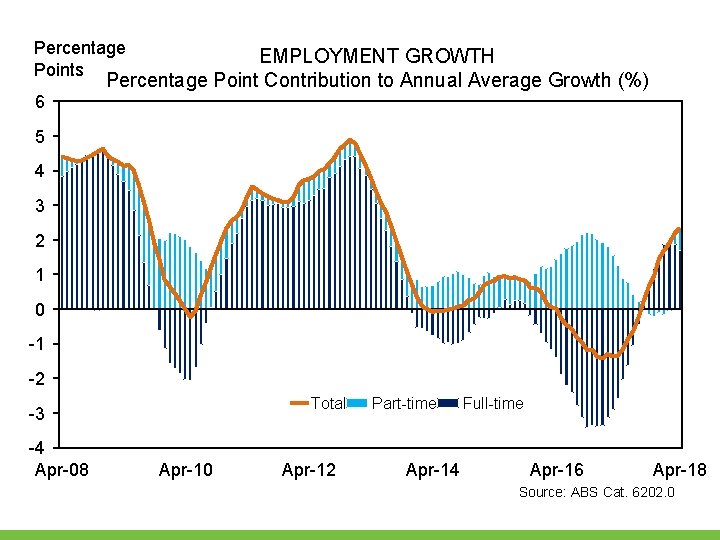
Percentage Points EMPLOYMENT GROWTH Percentage Point Contribution to Annual Average Growth (%) 6 5 4 3 2 1 0 -1 -2 Total -3 -4 Apr-08 Apr-10 Apr-12 Part-time Apr-14 Full-time Apr-16 Apr-18 Source: ABS Cat. 6202. 0 Department of Treasury
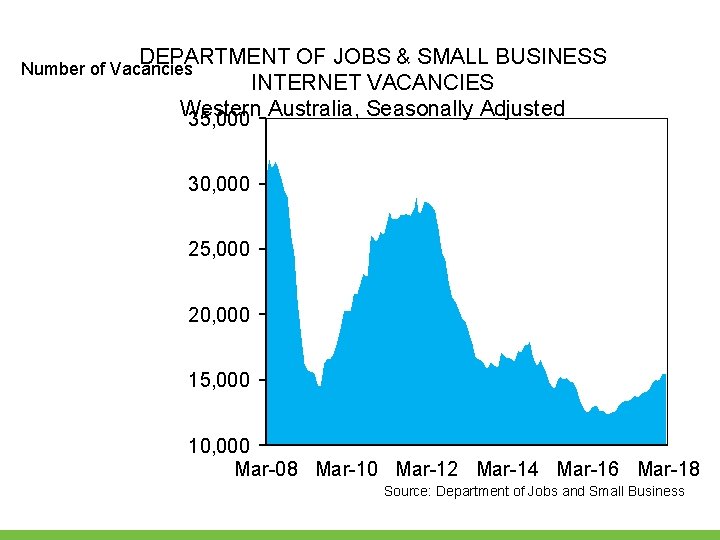
DEPARTMENT OF JOBS & SMALL BUSINESS INTERNET VACANCIES Western Australia, Seasonally Adjusted 35, 000 Number of Vacancies 30, 000 25, 000 20, 000 15, 000 10, 000 Mar-08 Mar-10 Mar-12 Mar-14 Mar-16 Mar-18 Source: Department of Jobs and Small Business Department of Treasury
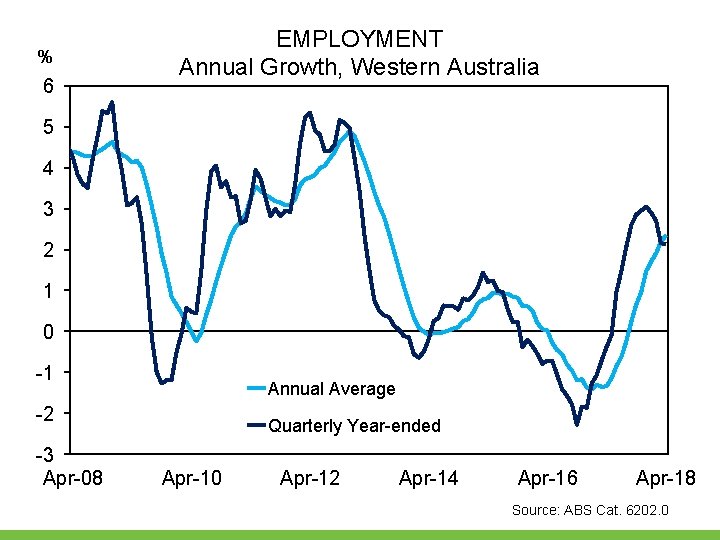
% 6 EMPLOYMENT Annual Growth, Western Australia 5 4 3 2 1 0 -1 Annual Average -2 -3 Apr-08 Quarterly Year-ended Apr-10 Apr-12 Apr-14 Apr-16 Apr-18 Source: ABS Cat. 6202. 0 Department of Treasury
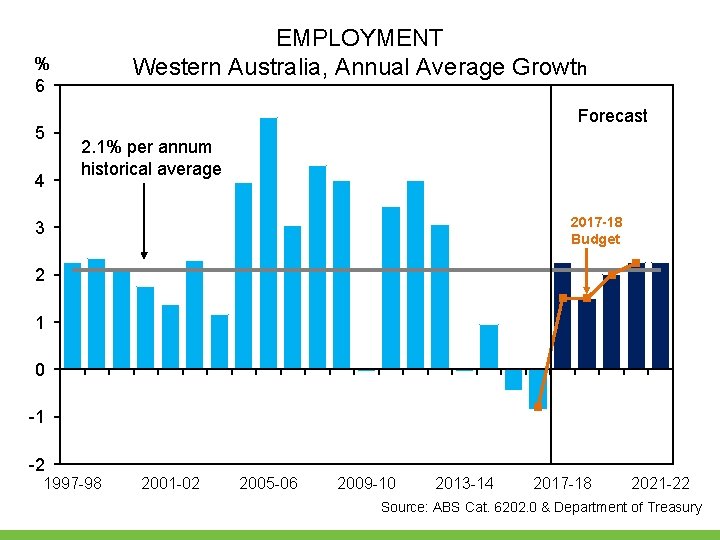
EMPLOYMENT Western Australia, Annual Average Growth % 6 5 4 Forecast 2. 1% per annum historical average 2017 -18 Budget 3 2 1 0 -1 -2 1997 -98 2001 -02 2005 -06 2009 -10 2013 -14 2017 -18 2021 -22 Source: ABS Cat. 6202. 0 & Department of Treasury
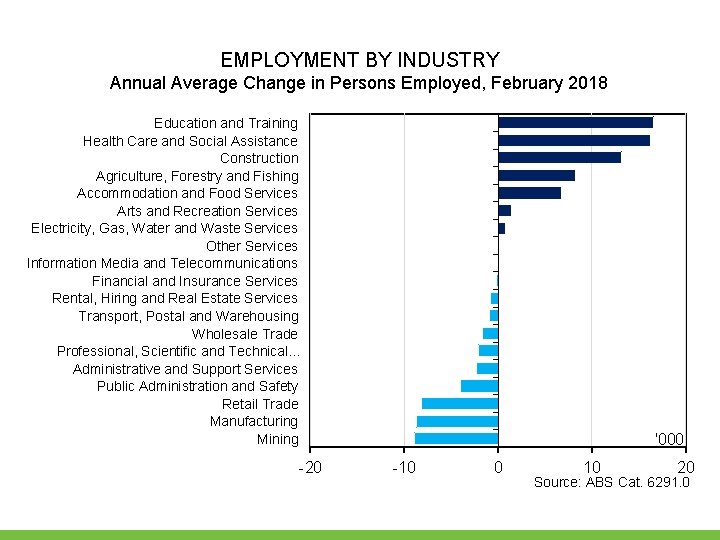
EMPLOYMENT BY INDUSTRY Annual Average Change in Persons Employed, February 2018 Education and Training Health Care and Social Assistance Construction Agriculture, Forestry and Fishing Accommodation and Food Services Arts and Recreation Services Electricity, Gas, Water and Waste Services Other Services Information Media and Telecommunications Financial and Insurance Services Rental, Hiring and Real Estate Services Transport, Postal and Warehousing Wholesale Trade Professional, Scientific and Technical. . . Administrative and Support Services Public Administration and Safety Retail Trade Manufacturing Mining -20 '000 -10 0 10 20 Source: ABS Cat. 6291. 0 Department of Treasury
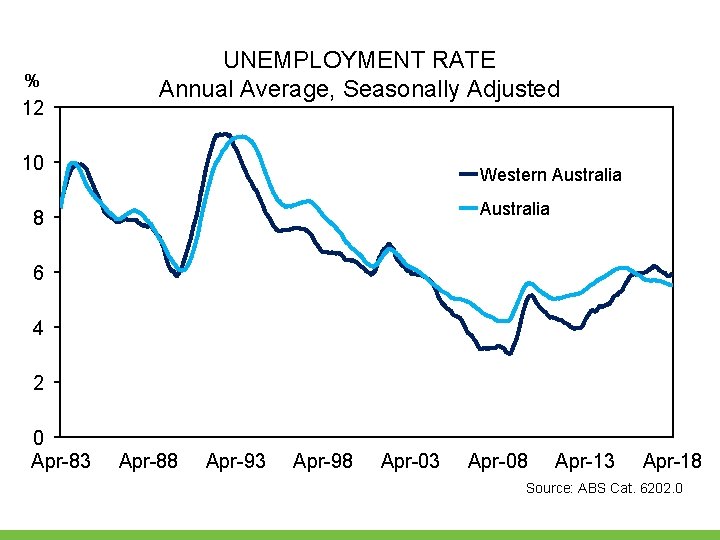
% 12 UNEMPLOYMENT RATE Annual Average, Seasonally Adjusted 10 Western Australia 8 6 4 2 0 Apr-83 Apr-88 Apr-93 Apr-98 Apr-03 Apr-08 Apr-13 Apr-18 Source: ABS Cat. 6202. 0 Department of Treasury
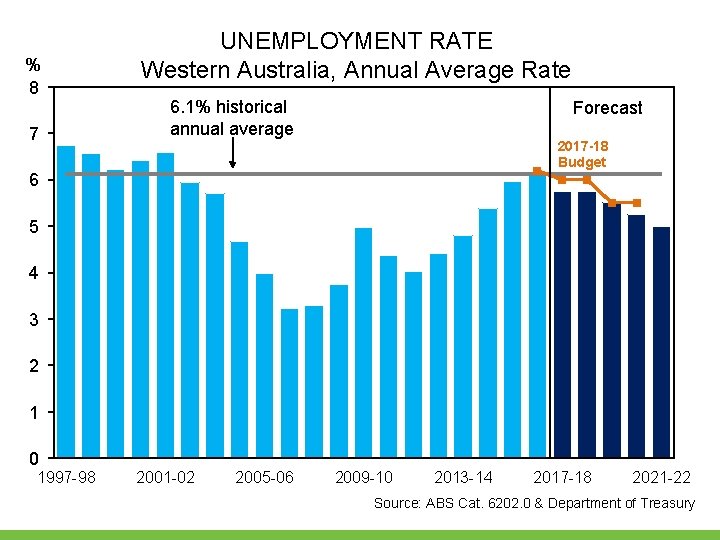
% 8 7 UNEMPLOYMENT RATE Western Australia, Annual Average Rate 6. 1% historical annual average Forecast 2017 -18 Budget 6 5 4 3 2 1 0 1997 -98 2001 -02 2005 -06 2009 -10 2013 -14 2017 -18 2021 -22 Source: ABS Cat. 6202. 0 & Department of Treasury
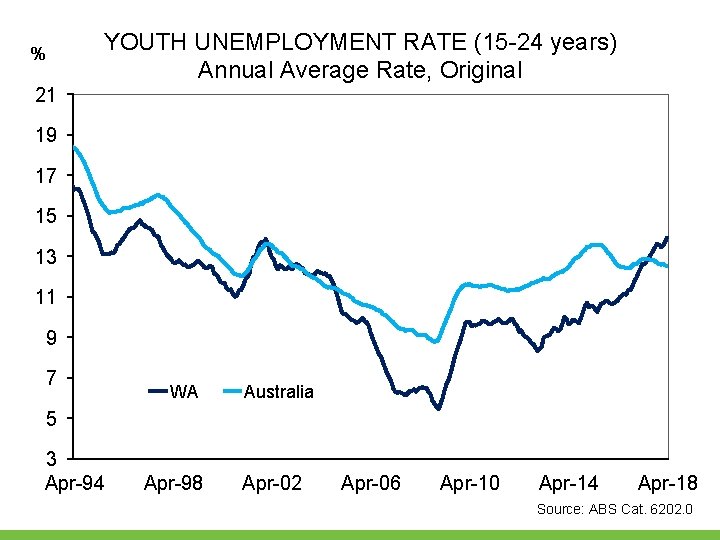
YOUTH UNEMPLOYMENT RATE (15 -24 years) Annual Average Rate, Original % 21 19 17 15 13 11 9 7 WA Australia 5 3 Apr-94 Apr-98 Apr-02 Apr-06 Apr-10 Apr-14 Apr-18 Source: ABS Cat. 6202. 0 Department of Treasury
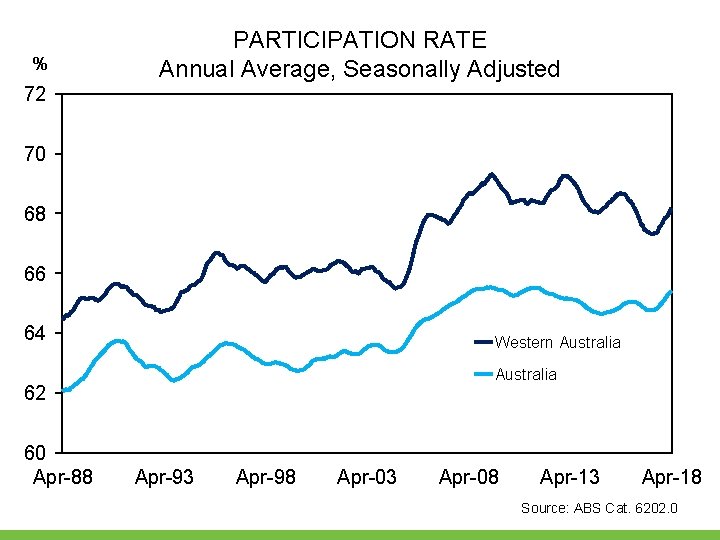
% PARTICIPATION RATE Annual Average, Seasonally Adjusted 72 70 68 66 64 Western Australia 62 60 Apr-88 Apr-93 Apr-98 Apr-03 Apr-08 Apr-13 Apr-18 Source: ABS Cat. 6202. 0 Department of Treasury
Wages Department of Treasury
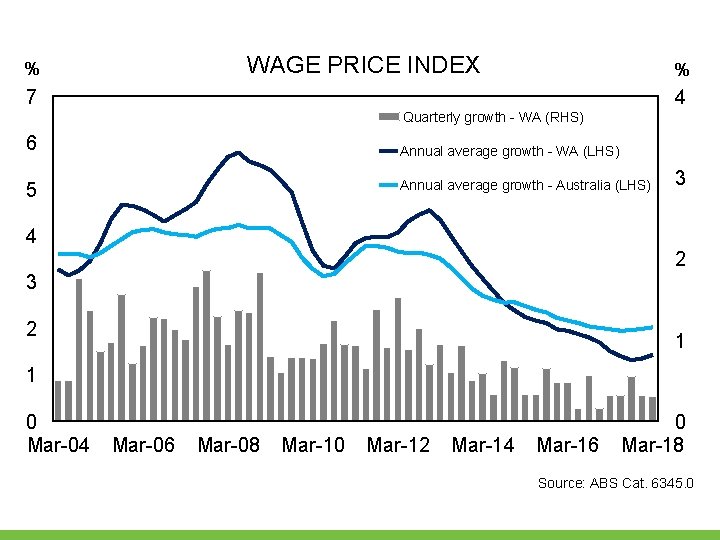
WAGE PRICE INDEX % % 7 4 Quarterly growth - WA (RHS) 6 Annual average growth - WA (LHS) Annual average growth - Australia (LHS) 5 3 4 2 3 2 1 1 0 Mar-04 Mar-06 Mar-08 Mar-10 Mar-12 Mar-14 Mar-16 0 Mar-18 Source: ABS Cat. 6345. 0 Department of Treasury
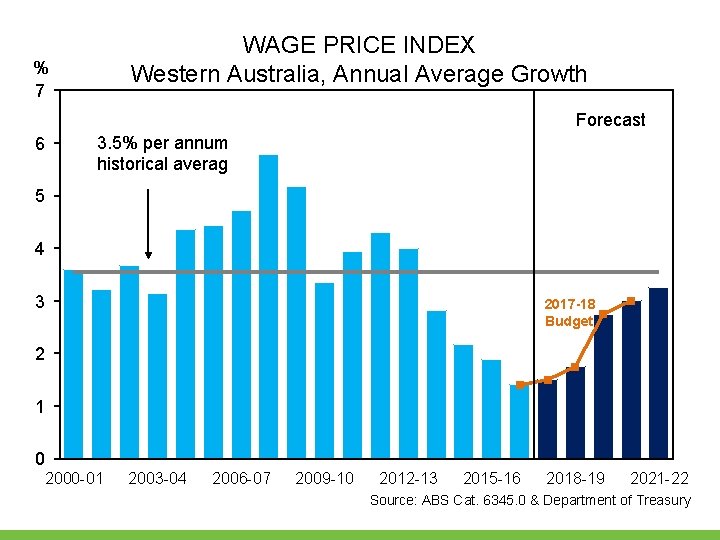
WAGE PRICE INDEX Western Australia, Annual Average Growth % 7 Forecast 6 3. 5% per annum historical average 5 4 3 2017 -18 Budget 2 1 0 2000 -01 2003 -04 2006 -07 2009 -10 2012 -13 2015 -16 2018 -19 2021 -22 Source: ABS Cat. 6345. 0 & Department of Treasury
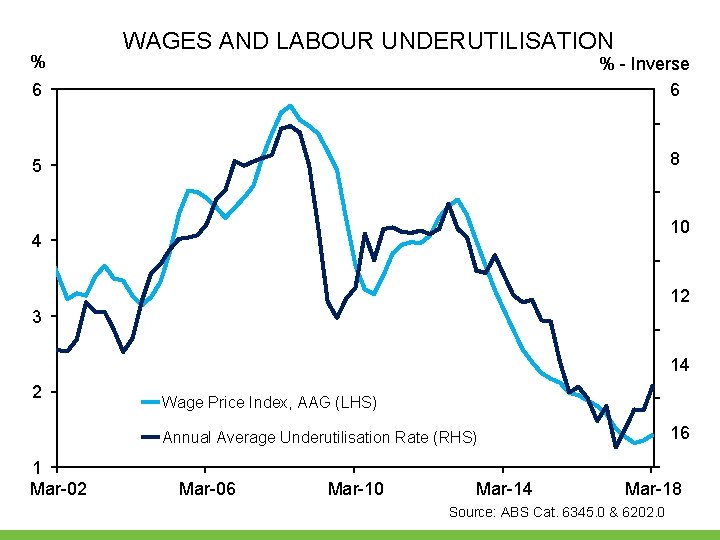
% WAGES AND LABOUR UNDERUTILISATION % - Inverse 6 6 8 5 10 4 12 3 14 2 Wage Price Index, AAG (LHS) 16 Annual Average Underutilisation Rate (RHS) 1 Mar-02 Mar-06 Mar-10 Mar-14 Mar-18 Source: ABS Cat. 6345. 0 & 6202. 0 Department of Treasury
Inflation Department of Treasury
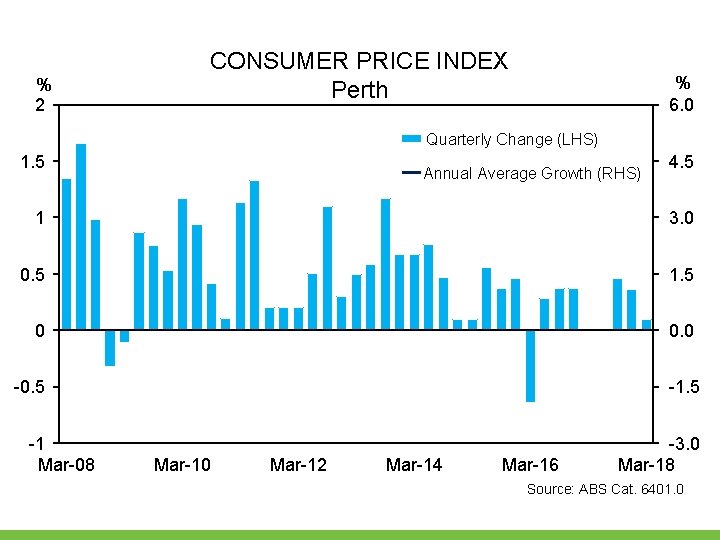
% 2 CONSUMER PRICE INDEX Perth % 6. 0 Quarterly Change (LHS) 1. 5 Annual Average Growth (RHS) 4. 5 1 3. 0 0. 5 1. 5 0 0. 0 -0. 5 -1 Mar-08 -1. 5 Mar-10 Mar-12 Mar-14 Mar-16 -3. 0 Mar-18 Source: ABS Cat. 6401. 0 Department of Treasury
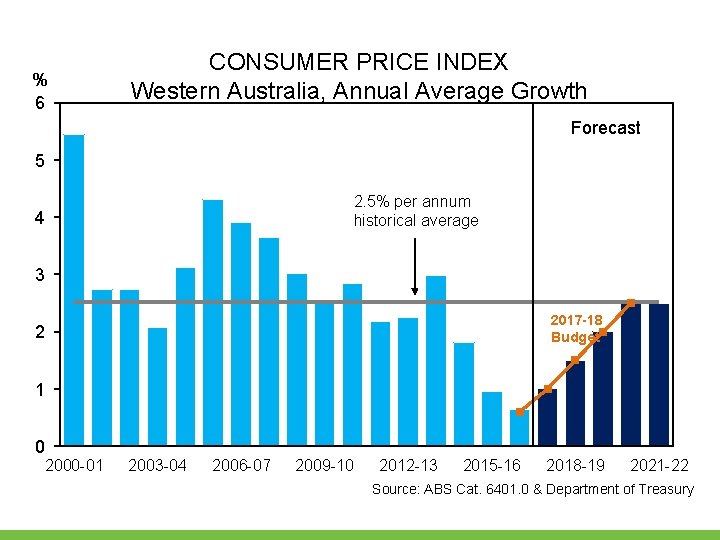
% 6 CONSUMER PRICE INDEX Western Australia, Annual Average Growth Forecast 5 2. 5% per annum historical average 4 3 2017 -18 Budget 2 1 0 2000 -01 2003 -04 2006 -07 2009 -10 2012 -13 2015 -16 2018 -19 2021 -22 Source: ABS Cat. 6401. 0 & Department of Treasury
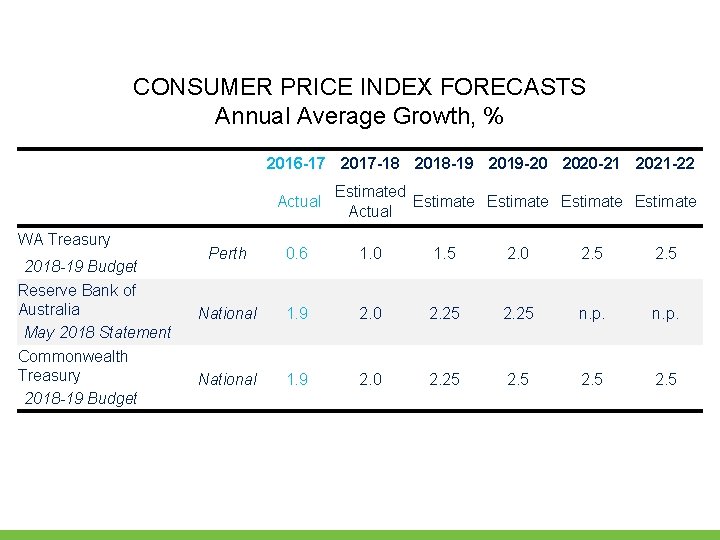
CONSUMER PRICE INDEX FORECASTS Annual Average Growth, % WA Treasury 2018 -19 Budget Reserve Bank of Australia May 2018 Statement Commonwealth Treasury 2018 -19 Budget 2016 -17 2017 -18 2018 -19 2019 -20 2020 -21 2021 -22 Estimated Estimate Actual Perth 0. 6 1. 0 1. 5 2. 0 2. 5 National 1. 9 2. 0 2. 25 n. p. National 1. 9 2. 0 2. 25 2. 5 Department of Treasury
Risks to the Outlook Department of Treasury
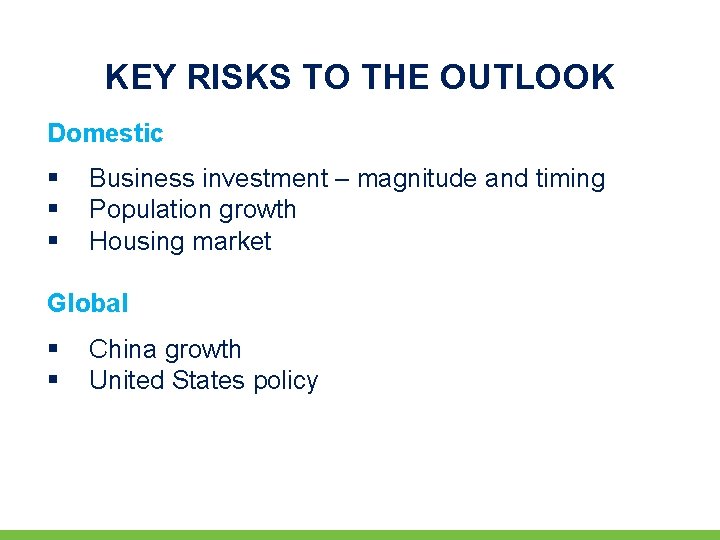
KEY RISKS TO THE OUTLOOK Domestic § § § Business investment – magnitude and timing Population growth Housing market Global § § China growth United States policy Department of Treasury
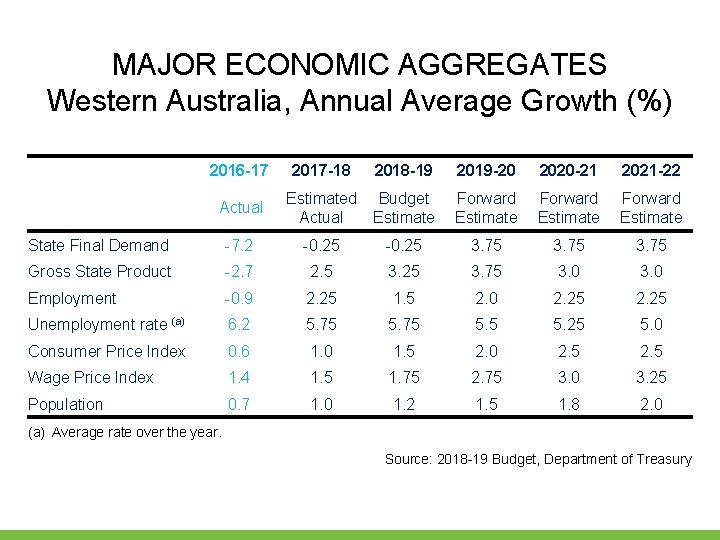
MAJOR ECONOMIC AGGREGATES Western Australia, Annual Average Growth (%) 2016 -17 Actual 2017 -18 2018 -19 2019 -20 2020 -21 2021 -22 Estimated Budget Actual Estimate Forward Estimate State Final Demand -7. 2 -0. 25 3. 75 Gross State Product -2. 7 2. 5 3. 25 3. 75 3. 0 Employment -0. 9 2. 25 1. 5 2. 0 2. 25 Unemployment rate (a) 6. 2 5. 75 5. 25 5. 0 Consumer Price Index 0. 6 1. 0 1. 5 2. 0 2. 5 Wage Price Index 1. 4 1. 5 1. 75 2. 75 3. 0 3. 25 Population 0. 7 1. 0 1. 2 1. 5 1. 8 2. 0 (a) Average rate over the year. Source: 2018 -19 Budget, Department of Treasury