2010 NATURAL CATASTROPHE YEAR IN REVIEW January 10









- Slides: 70
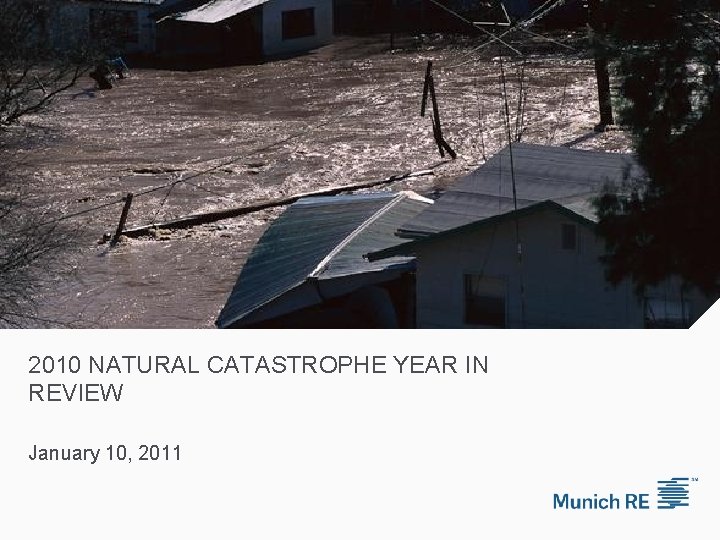
2010 NATURAL CATASTROPHE YEAR IN REVIEW January 10, 2011
Agenda Welcome/Introduction Terese Rosenthal U. S. Natural Catastrophe Update Carl Hedde Global Natural Catastrophe Update Ernst Rauch Economic Implications of Natural Catastrophe Losses Dr. Robert Hartwig Questions and Answers 2
Question and Answer Process You will have an opportunity to ask questions at the conclusion of the presentation. To ask a question, please dial 1 4 on your phone. An operator will facilitate your participation. 3
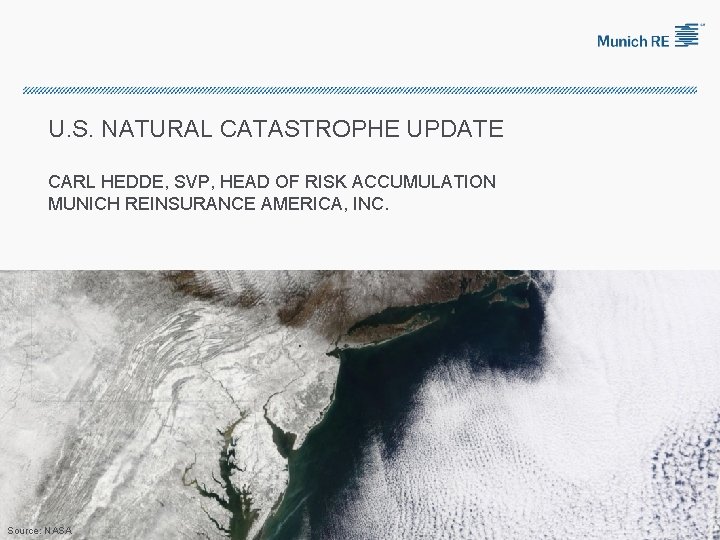
U. S. NATURAL CATASTROPHE UPDATE CARL HEDDE, SVP, HEAD OF RISK ACCUMULATION MUNICH REINSURANCE AMERICA, INC. Source: NASA
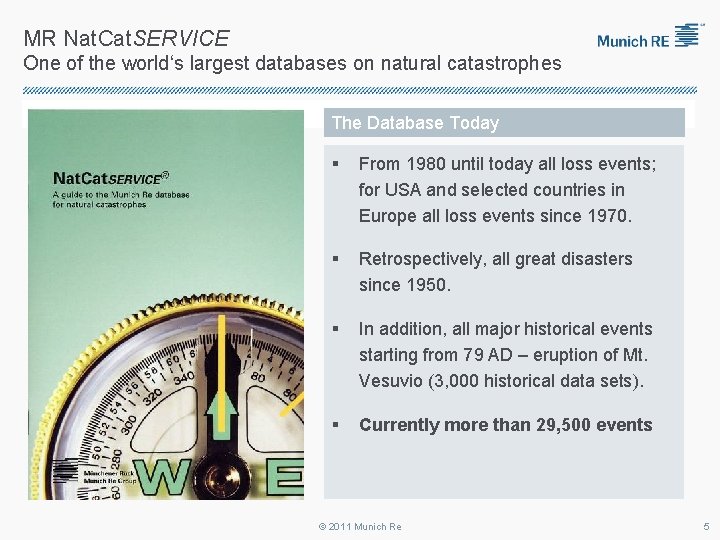
MR Nat. Cat. SERVICE One of the world‘s largest databases on natural catastrophes The Database Today § From 1980 until today all loss events; for USA and selected countries in Europe all loss events since 1970. § Retrospectively, all great disasters since 1950. § In addition, all major historical events starting from 79 AD – eruption of Mt. Vesuvio (3, 000 historical data sets). § Currently more than 29, 500 events © 2011 Munich Re 5
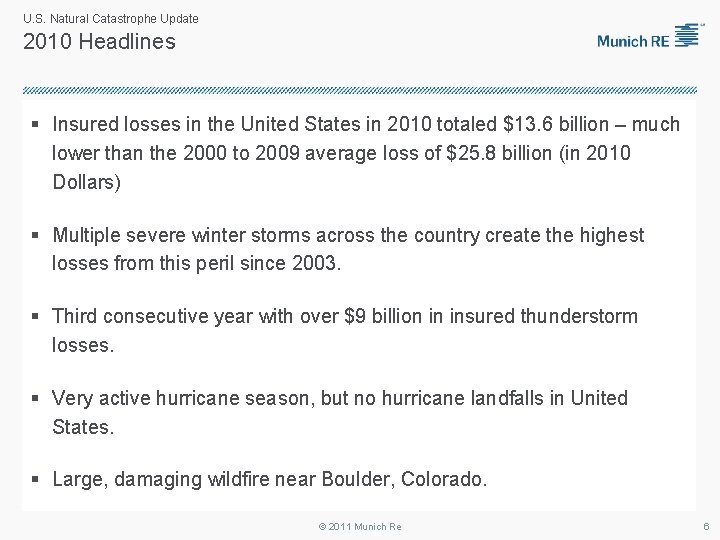
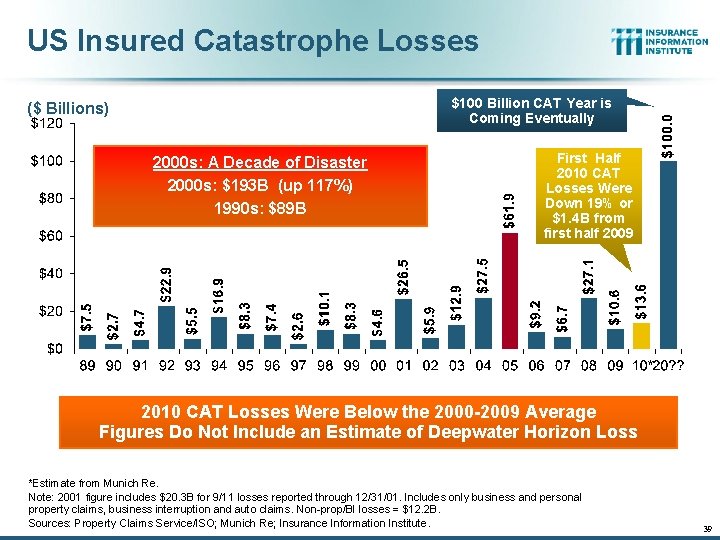
U. S. Natural Catastrophe Update 2010 Headlines § Insured losses in the United States in 2010 totaled $13. 6 billion – much lower than the 2000 to 2009 average loss of $25. 8 billion (in 2010 Dollars) § Multiple severe winter storms across the country create the highest losses from this peril since 2003. § Third consecutive year with over $9 billion in insured thunderstorm losses. § Very active hurricane season, but no hurricane landfalls in United States. § Large, damaging wildfire near Boulder, Colorado. © 2011 Munich Re 6
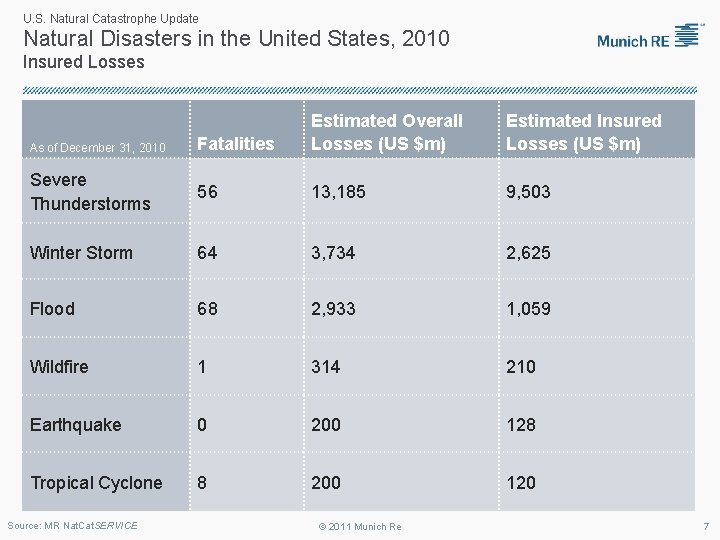
U. S. Natural Catastrophe Update Natural Disasters in the United States, 2010 Insured Losses As of December 31, 2010 Fatalities Estimated Overall Losses (US $m) Severe Thunderstorms 56 13, 185 9, 503 Winter Storm 64 3, 734 2, 625 Flood 68 2, 933 1, 059 Wildfire 1 314 210 Earthquake 0 200 128 Tropical Cyclone 8 200 120 Source: MR Nat. Cat. SERVICE © 2011 Munich Re Estimated Insured Losses (US $m) 7
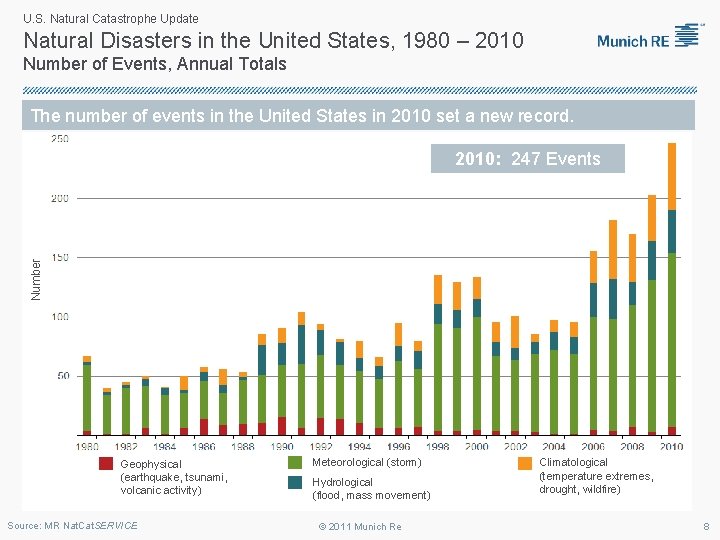
U. S. Natural Catastrophe Update Natural Disasters in the United States, 1980 – 2010 Number of Events, Annual Totals The number of events in the United States in 2010 set a new record. Number 2010: 247 Events Geophysical (earthquake, tsunami, volcanic activity) Source: MR Nat. Cat. SERVICE Meteorological (storm) Hydrological (flood, mass movement) © 2011 Munich Re Climatological (temperature extremes, drought, wildfire) 8
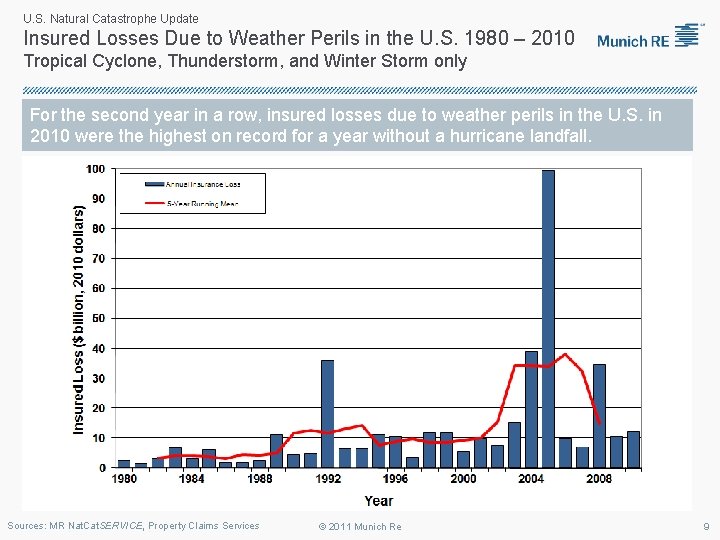
U. S. Natural Catastrophe Update Insured Losses Due to Weather Perils in the U. S. 1980 – 2010 Tropical Cyclone, Thunderstorm, and Winter Storm only For the second year in a row, insured losses due to weather perils in the U. S. in 2010 were the highest on record for a year without a hurricane landfall. Sources: MR Nat. Cat. SERVICE, Property Claims Services © 2011 Munich Re 9
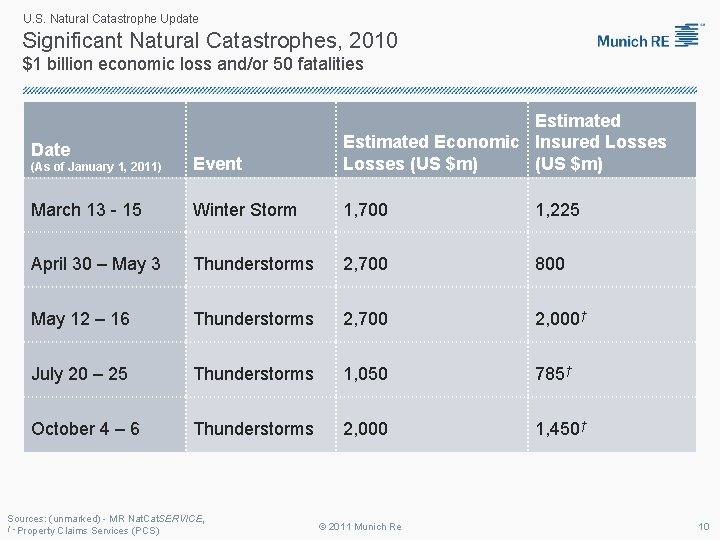
U. S. Natural Catastrophe Update Significant Natural Catastrophes, 2010 $1 billion economic loss and/or 50 fatalities (As of January 1, 2011) Event Estimated Economic Insured Losses (US $m) March 13 - 15 Winter Storm 1, 700 1, 225 April 30 – May 3 Thunderstorms 2, 700 800 May 12 – 16 Thunderstorms 2, 700 2, 000† July 20 – 25 Thunderstorms 1, 050 785† October 4 – 6 Thunderstorms 2, 000 1, 450† Date Sources: (unmarked) - MR Nat. Cat. SERVICE, † - Property Claims Services (PCS) © 2011 Munich Re 10
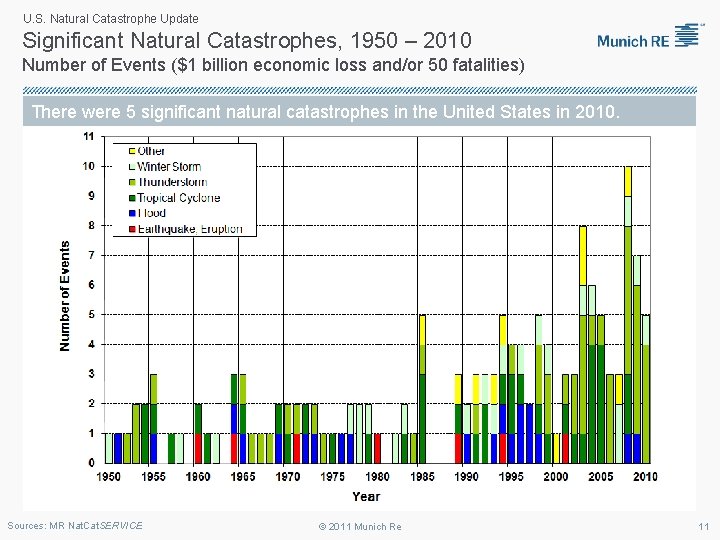
U. S. Natural Catastrophe Update Significant Natural Catastrophes, 1950 – 2010 Number of Events ($1 billion economic loss and/or 50 fatalities) There were 5 significant natural catastrophes in the United States in 2010. Sources: MR Nat. Cat. SERVICE © 2011 Munich Re 11
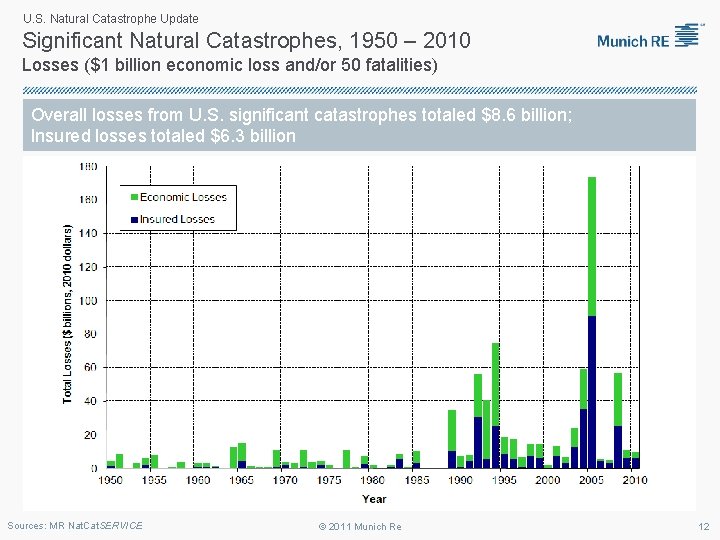
U. S. Natural Catastrophe Update Significant Natural Catastrophes, 1950 – 2010 Losses ($1 billion economic loss and/or 50 fatalities) Overall losses from U. S. significant catastrophes totaled $8. 6 billion; Insured losses totaled $6. 3 billion Sources: MR Nat. Cat. SERVICE © 2011 Munich Re 12
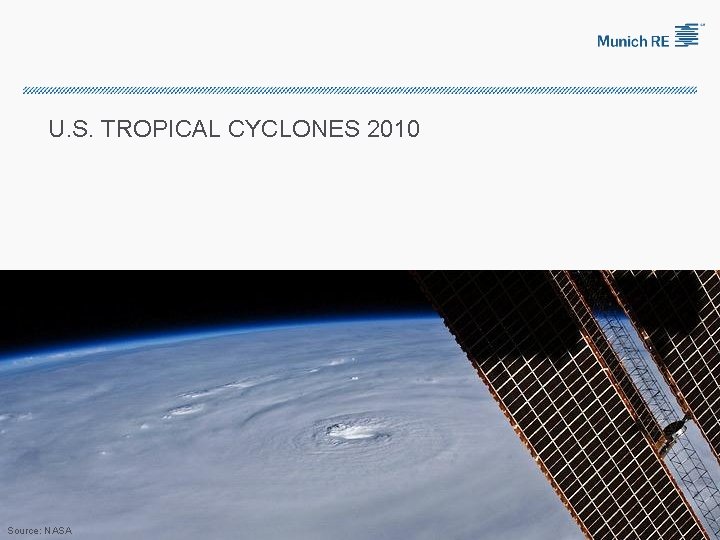
U. S. TROPICAL CYCLONES 2010 Source: NASA
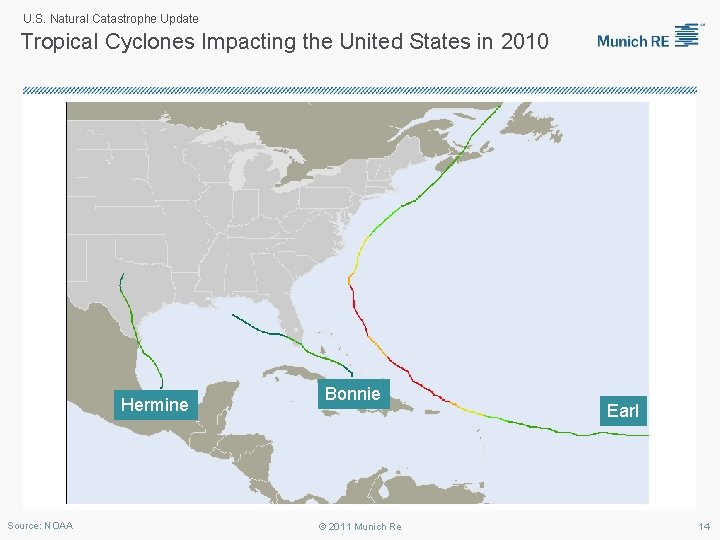
U. S. Natural Catastrophe Update Tropical Cyclones Impacting the United States in 2010 Hermine Source: NOAA Bonnie © 2011 Munich Re Earl 14
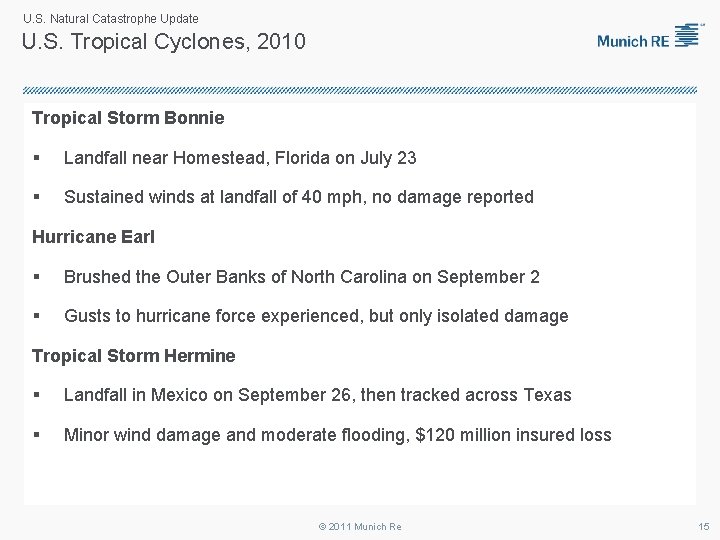
U. S. Natural Catastrophe Update U. S. Tropical Cyclones, 2010 Tropical Storm Bonnie § Landfall near Homestead, Florida on July 23 § Sustained winds at landfall of 40 mph, no damage reported Hurricane Earl § Brushed the Outer Banks of North Carolina on September 2 § Gusts to hurricane force experienced, but only isolated damage Tropical Storm Hermine § Landfall in Mexico on September 26, then tracked across Texas § Minor wind damage and moderate flooding, $120 million insured loss © 2011 Munich Re 15
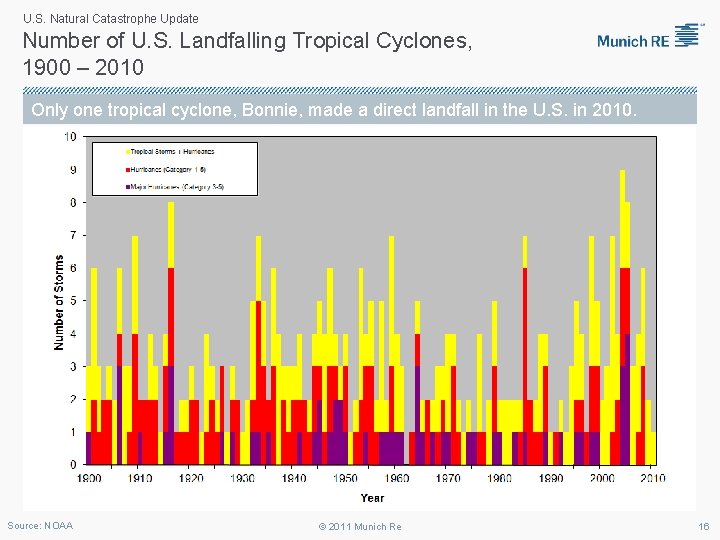
U. S. Natural Catastrophe Update Number of U. S. Landfalling Tropical Cyclones, 1900 – 2010 Only one tropical cyclone, Bonnie, made a direct landfall in the U. S. in 2010. Source: NOAA © 2011 Munich Re 16
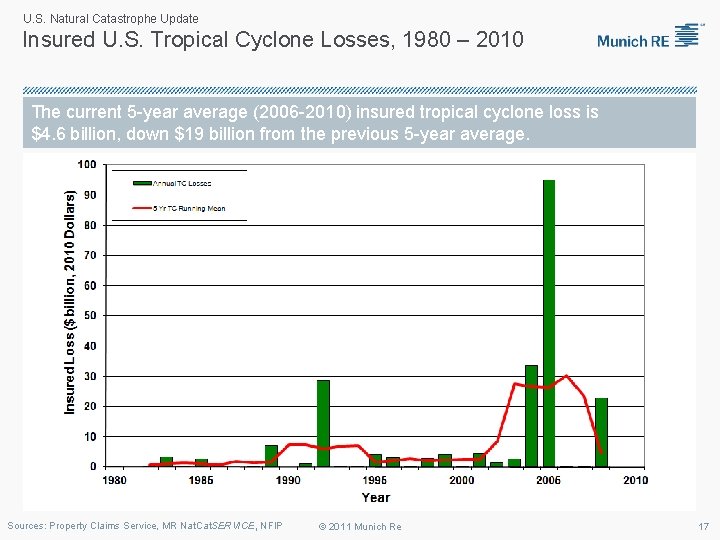
U. S. Natural Catastrophe Update Insured U. S. Tropical Cyclone Losses, 1980 – 2010 The current 5 -year average (2006 -2010) insured tropical cyclone loss is $4. 6 billion, down $19 billion from the previous 5 -year average. Sources: Property Claims Service, MR Nat. Cat. SERVICE, NFIP © 2011 Munich Re 17
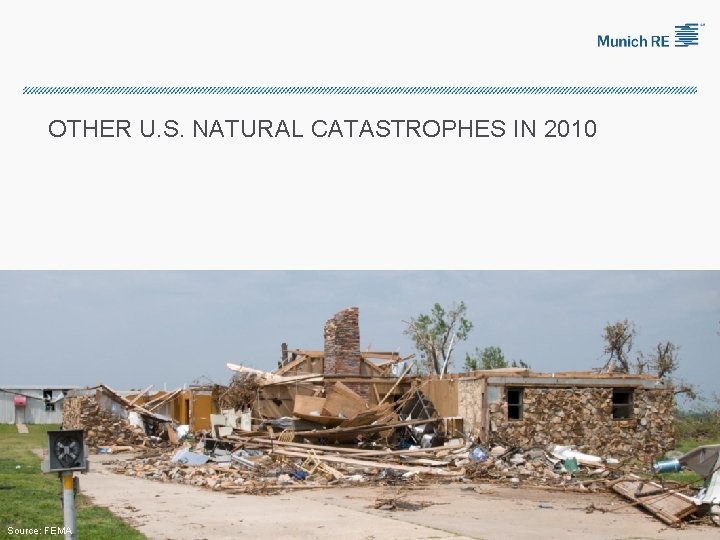
OTHER U. S. NATURAL CATASTROPHES IN 2010 Source: FEMA
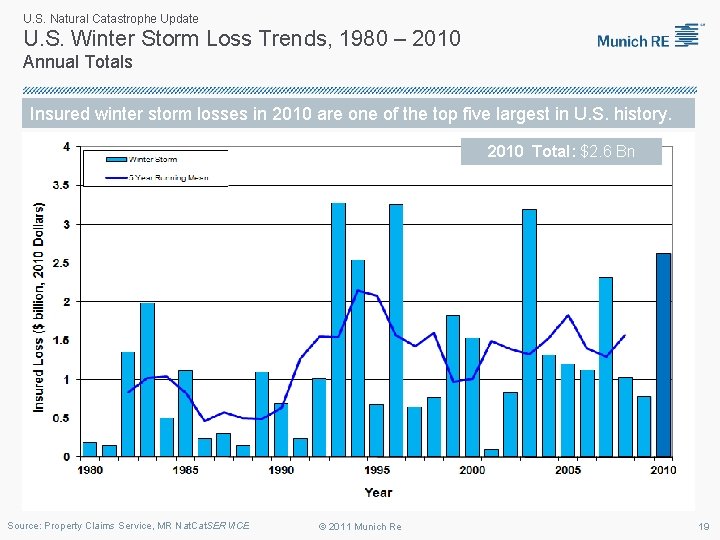
U. S. Natural Catastrophe Update U. S. Winter Storm Loss Trends, 1980 – 2010 Annual Totals Insured winter storm losses in 2010 are one of the top five largest in U. S. history. 2010 Total: $2. 6 Bn Source: Property Claims Service, MR Nat. Cat. SERVICE © 2011 Munich Re 19
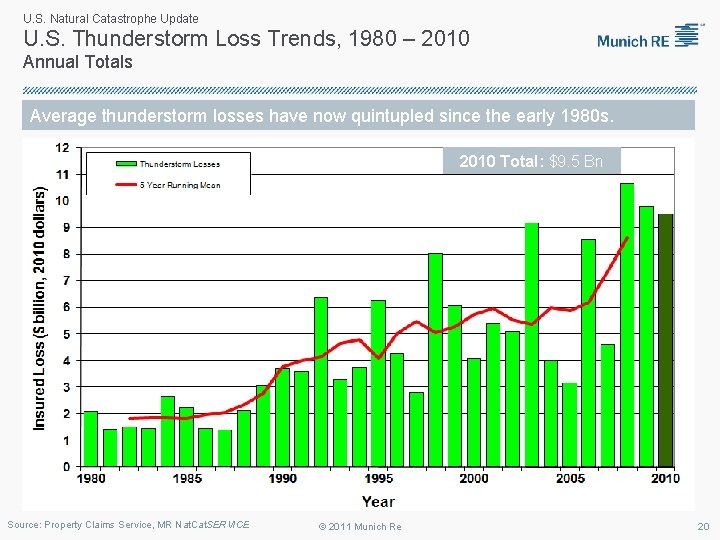
U. S. Natural Catastrophe Update U. S. Thunderstorm Loss Trends, 1980 – 2010 Annual Totals Average thunderstorm losses have now quintupled since the early 1980 s. 2010 Total: $9. 5 Bn Source: Property Claims Service, MR Nat. Cat. SERVICE © 2011 Munich Re 20
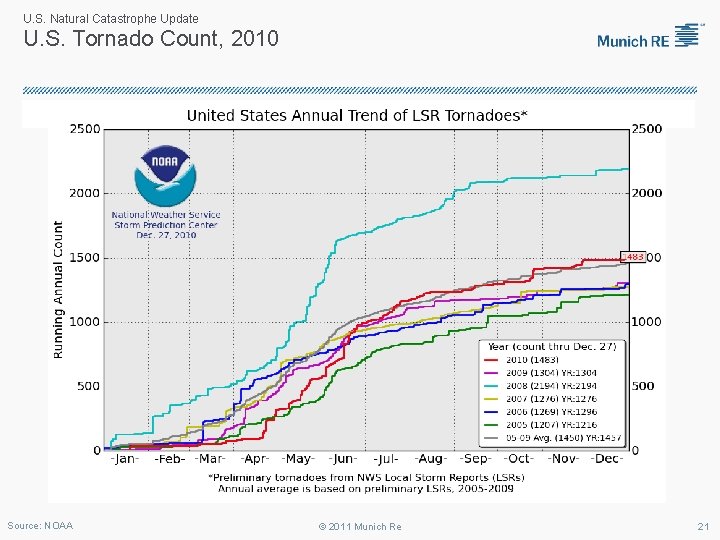
U. S. Natural Catastrophe Update U. S. Tornado Count, 2010 Source: NOAA © 2011 Munich Re 21
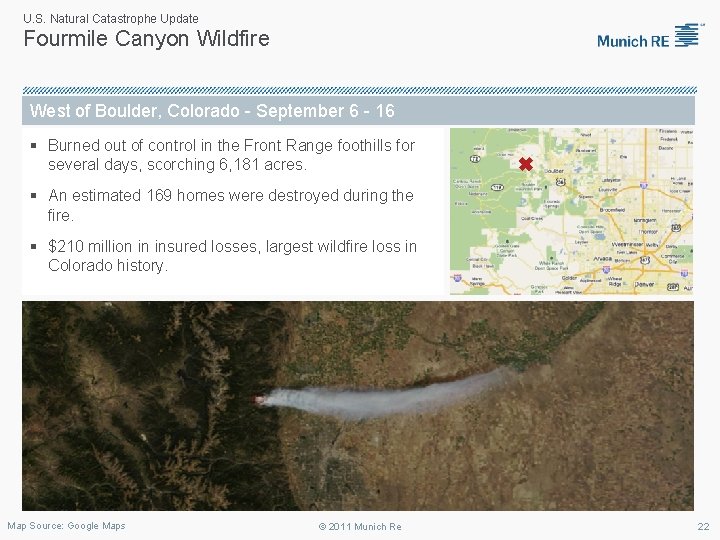
U. S. Natural Catastrophe Update Fourmile Canyon Wildfire West of Boulder, Colorado - September 6 - 16 § Burned out of control in the Front Range foothills for several days, scorching 6, 181 acres. § An estimated 169 homes were destroyed during the fire. § $210 million in insured losses, largest wildfire loss in Colorado history. Map Source: Google Maps © 2011 Munich Re 22
GLOBAL NATURAL CATASTROPHE UPDATE ERNST RAUCH HEAD OF CORPORATE CLIMATE CENTER MUNICH RE
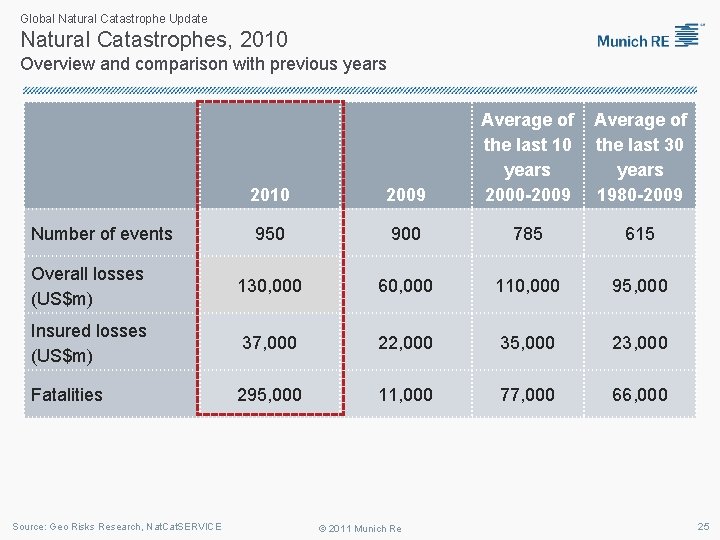
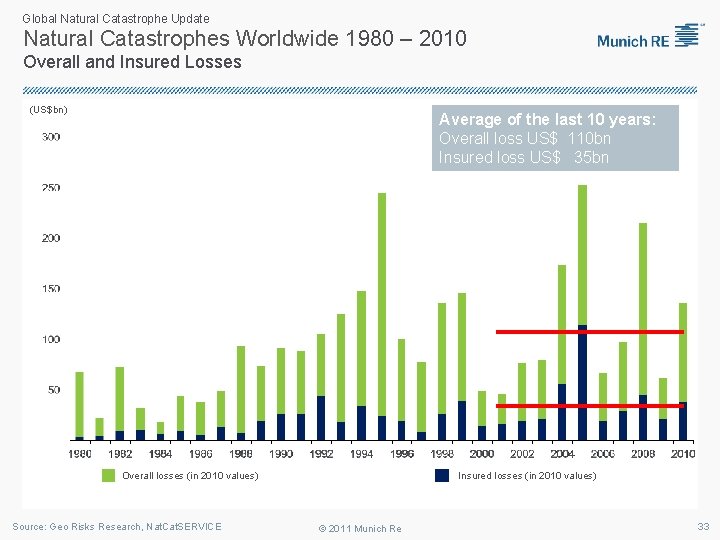
Global Natural Catastrophe Update Natural Catastrophes in the World, 2010 Headlines Year of earthquakes § Haiti: >220, 000 fatalities; deadliest quake since 1976 earthquake in Tangshan, China. § Chile: Costliest disaster in 2010; 2 nd costliest earthquake for the insurance industry since 1950. § New Zealand: Costliest natural disaster in Australia/Oceania ever. Number of events: 950 § Second highest number of events since 1980. (10 -year-average: 785) Fatalities: more than 295, 000 § Since 1980, the second highest death toll. (1983: 300, 000 deaths – drought Ethiopia) Overall direct losses: >US$ 130 bn § 2010 is amongst the five costliest years since 1980. Insured losses: US$ 37 bn § In line with 10 -year-average - although there was no important hurricane loss. Source: Geo Risks Research, Nat. Cat. SERVICE © 2011 Munich Re 24
Global Natural Catastrophe Update Natural Catastrophes, 2010 Overview and comparison with previous years 2010 2009 Average of the last 10 years 2000 -2009 950 900 785 615 Overall losses (US$m) 130, 000 60, 000 110, 000 95, 000 Insured losses (US$m) 37, 000 22, 000 35, 000 23, 000 Fatalities 295, 000 11, 000 77, 000 66, 000 Number of events Source: Geo Risks Research, Nat. Cat. SERVICE © 2011 Munich Re Average of the last 30 years 1980 -2009 25
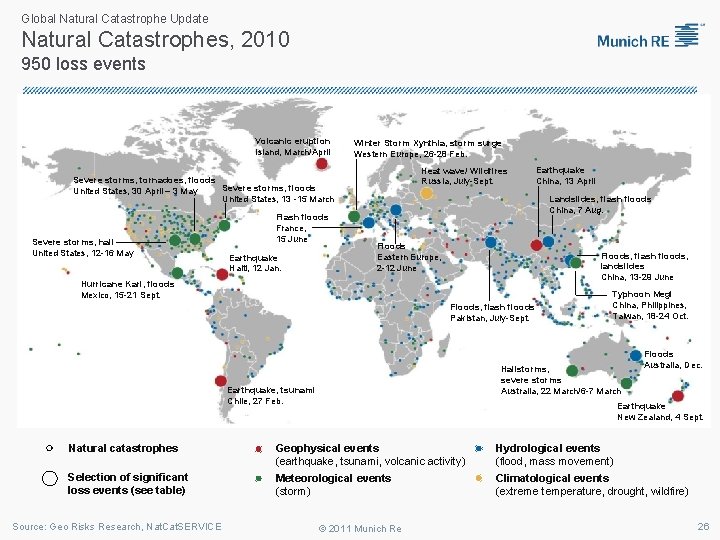
Global Natural Catastrophe Update Natural Catastrophes, 2010 950 loss events Volcanic eruption Island, March/April Winter Storm Xynthia, storm surge Western Europe, 26 -28 Feb. Heat wave/ Wildfires Russia, July-Sept. Severe storms, tornadoes, floods Severe storms, floods United States, 30 April – 3 May United States, 13 -15 March Severe storms, hail United States, 12 -16 May Flash floods France, 15 June Earthquake Haiti, 12 Jan. Landslides, flash floods China, 7 Aug. Floods Eastern Europe, 2 -12 June Floods, flash floods, landslides China, 13 -29 June Hurricane Karl, floods Mexico, 15 -21 Sept. Floods, flash floods Pakistan, July-Sept. Selection of significant loss events (see table) Source: Geo Risks Research, Nat. Cat. SERVICE Typhoon Megi China, Philippines, Taiwan, 18 -24 Oct. Hailstorms, severe storms Australia, 22 March/6 -7 March Earthquake, tsunami Chile, 27 Feb. Natural catastrophes Earthquake China, 13 April Floods Australia, Dec. Earthquake New Zealand, 4 Sept. Geophysical events (earthquake, tsunami, volcanic activity) Meteorological events (storm) © 2011 Munich Re Hydrological events (flood, mass movement) Climatological events (extreme temperature, drought, wildfire) 26
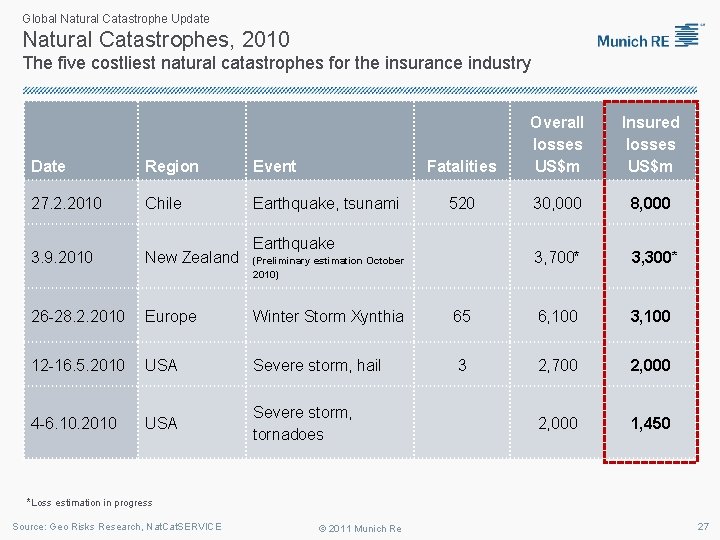
Global Natural Catastrophe Update Natural Catastrophes, 2010 The five costliest natural catastrophes for the insurance industry Fatalities Overall losses US$m Insured losses US$m 520 30, 000 8, 000 3, 700* 3, 300* Date Region Event 27. 2. 2010 Chile Earthquake, tsunami 3. 9. 2010 New Zealand 26 -28. 2. 2010 Europe Winter Storm Xynthia 65 6, 100 3, 100 12 -16. 5. 2010 USA Severe storm, hail 3 2, 700 2, 000 4 -6. 10. 2010 USA Severe storm, tornadoes 2, 000 1, 450 Earthquake (Preliminary estimation October 2010) *Loss estimation in progress Source: Geo Risks Research, Nat. Cat. SERVICE © 2011 Munich Re 27
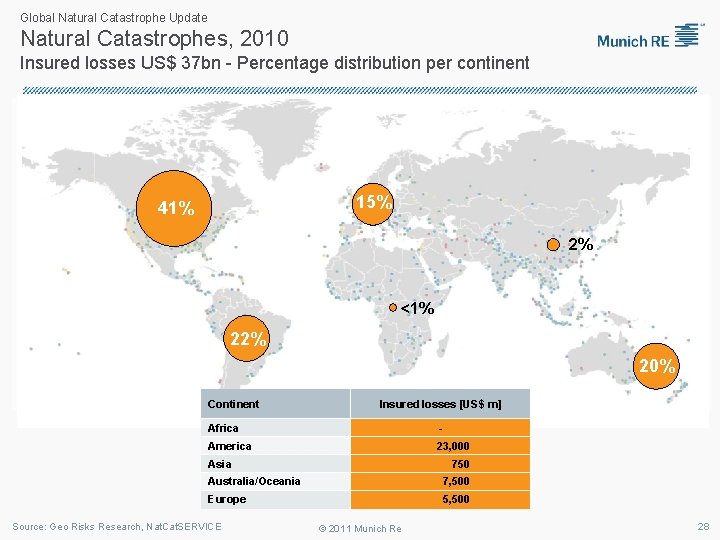
Global Natural Catastrophe Update Natural Catastrophes, 2010 Insured losses US$ 37 bn - Percentage distribution per continent 15% 41% 2% <1% 22% 20% Continent Insured losses [US$ m] Africa - America 23, 000 Asia 750 Australia/Oceania 7, 500 Europe 5, 500 Source: Geo Risks Research, Nat. Cat. SERVICE © 2011 Munich Re 28
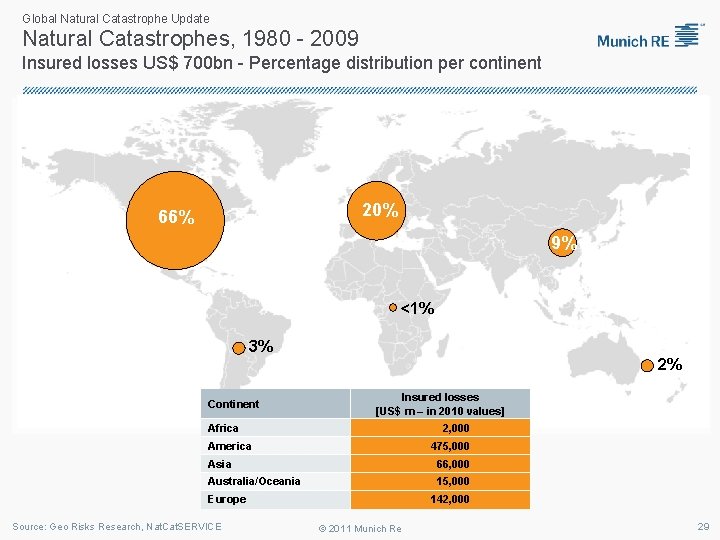
Global Natural Catastrophe Update Natural Catastrophes, 1980 - 2009 Insured losses US$ 700 bn - Percentage distribution per continent 20% 66% 9% <1% 3% 2% Continent Insured losses [US$ m – in 2010 values] Africa 2, 000 America 475, 000 Asia 66, 000 Australia/Oceania 15, 000 Europe Source: Geo Risks Research, Nat. Cat. SERVICE 142, 000 © 2011 Munich Re 29
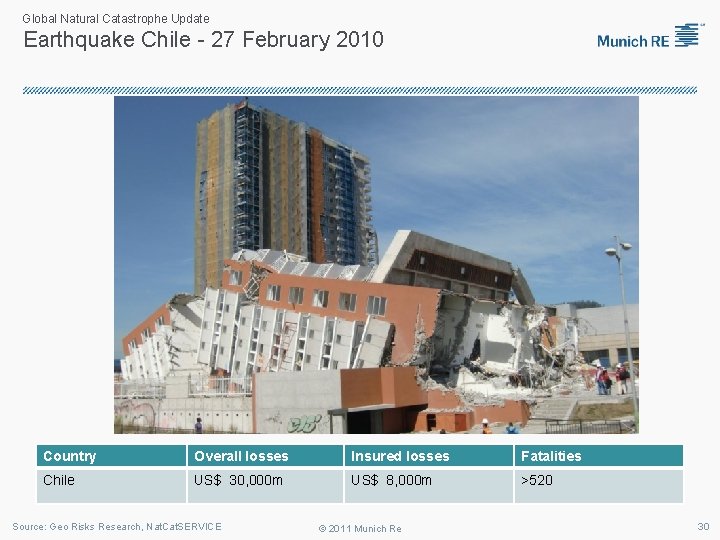
Global Natural Catastrophe Update Earthquake Chile - 27 February 2010 Country Overall losses Insured losses Fatalities Chile US$ 30, 000 m US$ 8, 000 m >520 Source: Geo Risks Research, Nat. Cat. SERVICE © 2011 Munich Re 30
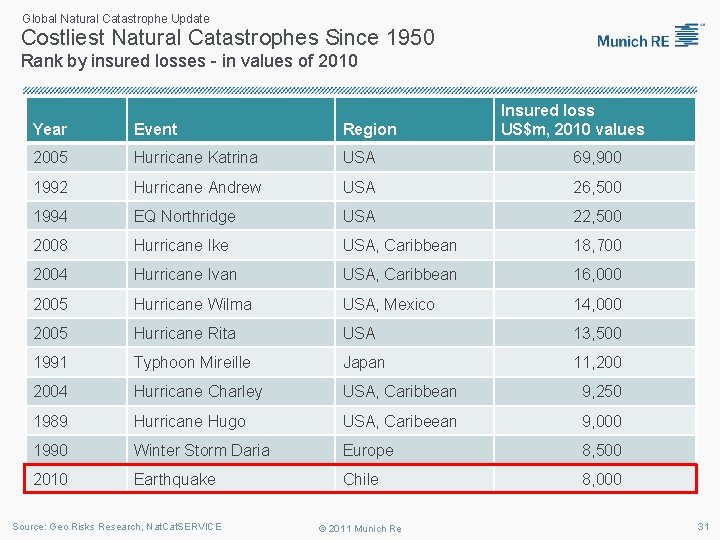
Global Natural Catastrophe Update Costliest Natural Catastrophes Since 1950 Rank by insured losses - in values of 2010 Insured loss US$m, 2010 values Year Event Region 2005 Hurricane Katrina USA 69, 900 1992 Hurricane Andrew USA 26, 500 1994 EQ Northridge USA 22, 500 2008 Hurricane Ike USA, Caribbean 18, 700 2004 Hurricane Ivan USA, Caribbean 16, 000 2005 Hurricane Wilma USA, Mexico 14, 000 2005 Hurricane Rita USA 13, 500 1991 Typhoon Mireille Japan 11, 2004 Hurricane Charley USA, Caribbean 9, 250 1989 Hurricane Hugo USA, Caribeean 9, 000 1990 Winter Storm Daria Europe 8, 500 2010 Earthquake Chile 8, 000 Source: Geo Risks Research, Nat. Cat. SERVICE © 2011 Munich Re 31
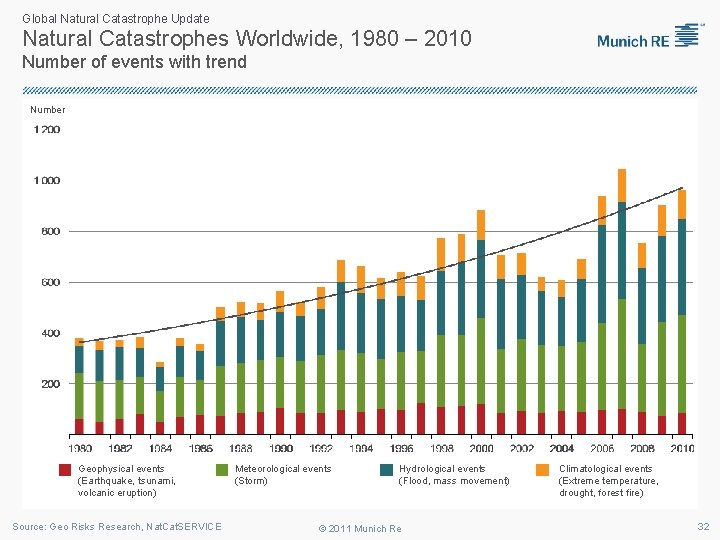
Global Natural Catastrophe Update Natural Catastrophes Worldwide, 1980 – 2010 Number of events with trend Number Geophysical events (Earthquake, tsunami, volcanic eruption) Source: Geo Risks Research, Nat. Cat. SERVICE Meteorological events (Storm) Hydrological events (Flood, mass movement) © 2011 Munich Re Climatological events (Extreme temperature, drought, forest fire) 32
Global Natural Catastrophe Update Natural Catastrophes Worldwide 1980 – 2010 Overall and Insured Losses (US$bn) Average of the last 10 years: Overall loss US$ 110 bn Insured loss US$ 35 bn Insured losses (in 2010 values) Overall losses (in 2010 values) Source: Geo Risks Research, Nat. Cat. SERVICE © 2011 Munich Re 33
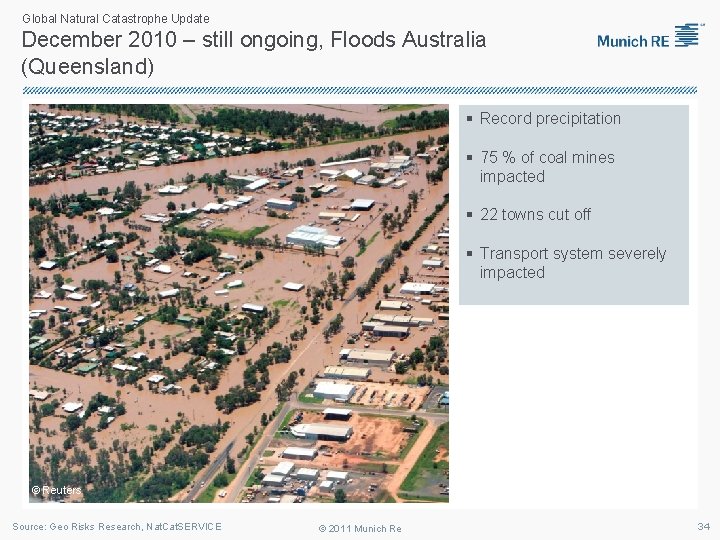
Global Natural Catastrophe Update December 2010 – still ongoing, Floods Australia (Queensland) § Record precipitation § 75 % of coal mines impacted § 22 towns cut off § Transport system severely impacted © Reuters Source: Geo Risks Research, Nat. Cat. SERVICE © 2011 Munich Re 34
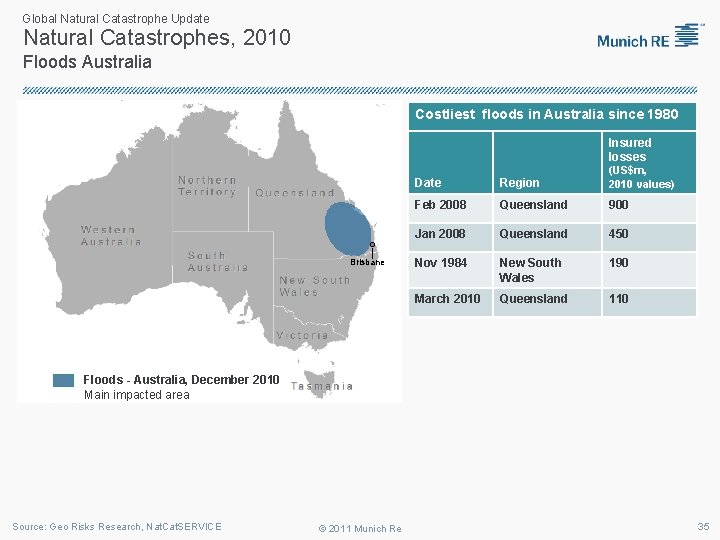
Global Natural Catastrophe Update Natural Catastrophes, 2010 Floods Australia Costliest floods in Australia since 1980 Insured losses Brisbane Date Region (US$m, 2010 values) Feb 2008 Queensland 900 Jan 2008 Queensland 450 Nov 1984 New South Wales 190 March 2010 Queensland 110 Floods - Australia, December 2010 Main impacted area Source: Geo Risks Research, Nat. Cat. SERVICE © 2011 Munich Re 35
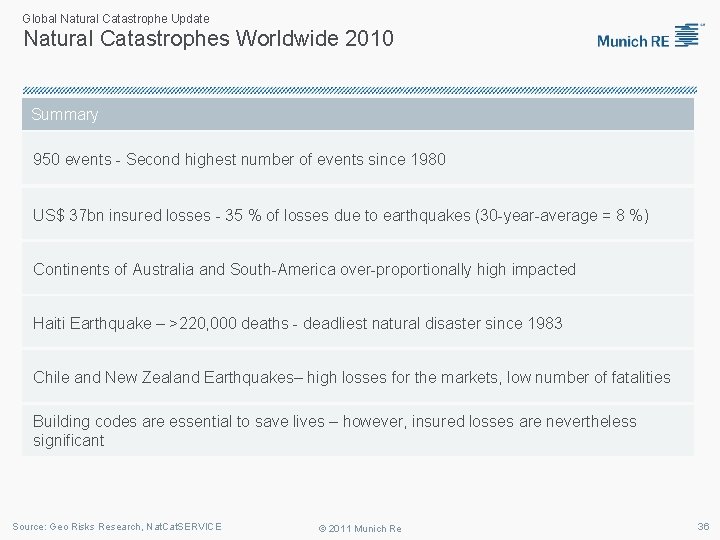
Global Natural Catastrophe Update Natural Catastrophes Worldwide 2010 Summary 950 events - Second highest number of events since 1980 US$ 37 bn insured losses - 35 % of losses due to earthquakes (30 -year-average = 8 %) Continents of Australia and South-America over-proportionally high impacted Haiti Earthquake – >220, 000 deaths - deadliest natural disaster since 1983 Chile and New Zealand Earthquakes– high losses for the markets, low number of fatalities Building codes are essential to save lives – however, insured losses are nevertheless significant Source: Geo Risks Research, Nat. Cat. SERVICE © 2011 Munich Re 36
Economic Financial Implications of Natural Catastrophe Losses in 2010 January 10, 2011 Robert P. Hartwig, Ph. D. , CPCU, President & Economist Insurance Information Institute 110 William Street New York, NY 10038 Tel: 212. 346. 5520 Cell: 917. 453. 1885 bobh@iii. org www. iii. org
US Insured CAT Losses in 2010 Were Below Average Relative to the Prior Decade (2000 -2009) 38
US Insured Catastrophe Losses $100 Billion CAT Year is Coming Eventually ($ Billions) 2000 s: A Decade of Disaster 2000 s: $193 B (up 117%) 1990 s: $89 B First Half 2010 CAT Losses Were Down 19% or $1. 4 B from first half 2009 2010 CAT Losses Were Below the 2000 -2009 Average Figures Do Not Include an Estimate of Deepwater Horizon Loss *Estimate from Munich Re. Note: 2001 figure includes $20. 3 B for 9/11 losses reported through 12/31/01. Includes only business and personal property claims, business interruption and auto claims. Non-prop/BI losses = $12. 2 B. Sources: Property Claims Service/ISO; Munich Re; Insurance Information Institute. 39
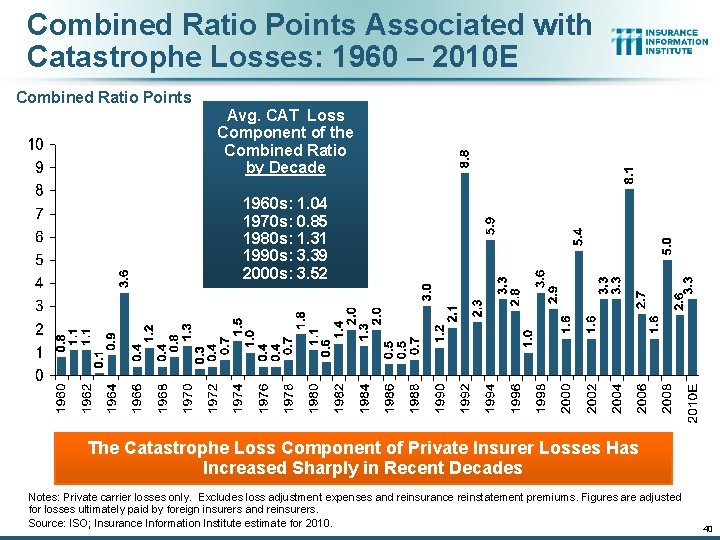
Combined Ratio Points Associated with Catastrophe Losses: 1960 – 2010 E Combined Ratio Points Avg. CAT Loss Component of the Combined Ratio by Decade 1960 s: 1. 04 1970 s: 0. 85 1980 s: 1. 31 1990 s: 3. 39 2000 s: 3. 52 The Catastrophe Loss Component of Private Insurer Losses Has Increased Sharply in Recent Decades Notes: Private carrier losses only. Excludes loss adjustment expenses and reinsurance reinstatement premiums. Figures are adjusted for losses ultimately paid by foreign insurers and reinsurers. Source: ISO; Insurance Information Institute estimate for 2010. 40
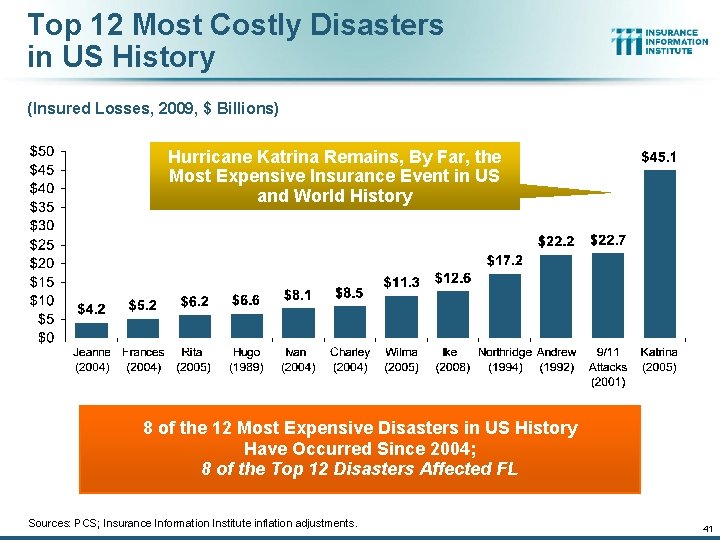
Top 12 Most Costly Disasters in US History (Insured Losses, 2009, $ Billions) Hurricane Katrina Remains, By Far, the Most Expensive Insurance Event in US and World History 8 of the 12 Most Expensive Disasters in US History Have Occurred Since 2004; 8 of the Top 12 Disasters Affected FL Sources: PCS; Insurance Information Institute inflation adjustments. 41
Financial Performance Lower Catastrophe Losses, Easing of Crisis Bolstered Results 42
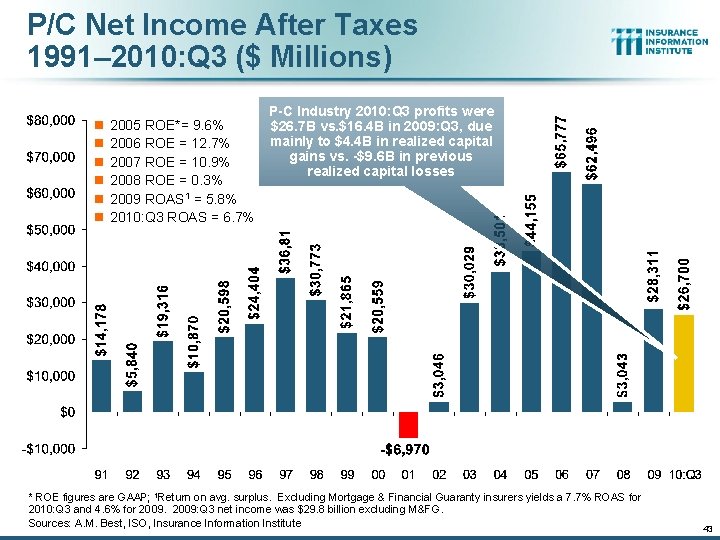
P/C Net Income After Taxes 1991– 2010: Q 3 ($ Millions) n n n 2005 ROE*= 9. 6% 2006 ROE = 12. 7% 2007 ROE = 10. 9% 2008 ROE = 0. 3% 2009 ROAS 1 = 5. 8% 2010: Q 3 ROAS = 6. 7% P-C Industry 2010: Q 3 profits were $26. 7 B vs. $16. 4 B in 2009: Q 3, due mainly to $4. 4 B in realized capital gains vs. -$9. 6 B in previous realized capital losses * ROE figures are GAAP; 1 Return on avg. surplus. Excluding Mortgage & Financial Guaranty insurers yields a 7. 7% ROAS for 2010: Q 3 and 4. 6% for 2009: Q 3 net income was $29. 8 billion excluding M&FG. Sources: A. M. Best, ISO, Insurance Information Institute 43
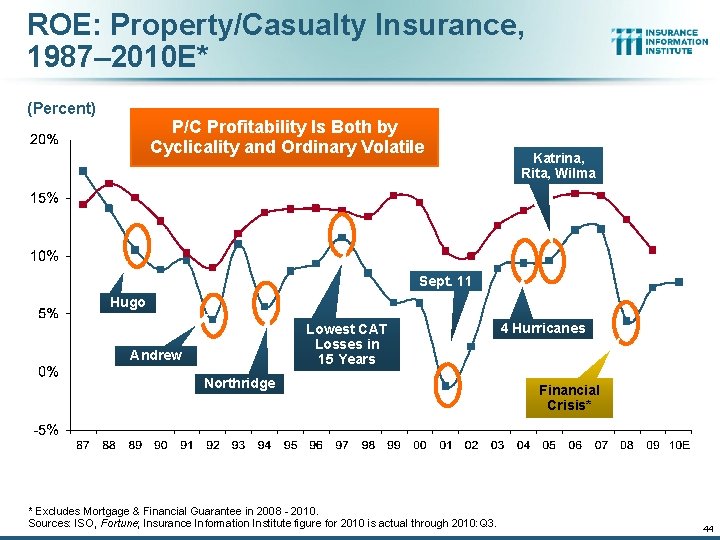
ROE: Property/Casualty Insurance, 1987– 2010 E* (Percent) P/C Profitability Is Both by Cyclicality and Ordinary Volatile Katrina, Rita, Wilma Sept. 11 Hugo Lowest CAT Losses in 15 Years Andrew Northridge * Excludes Mortgage & Financial Guarantee in 2008 - 2010. Sources: ISO, Fortune; Insurance Information Institute figure for 2010 is actual through 2010: Q 3. 4 Hurricanes Financial Crisis* 44
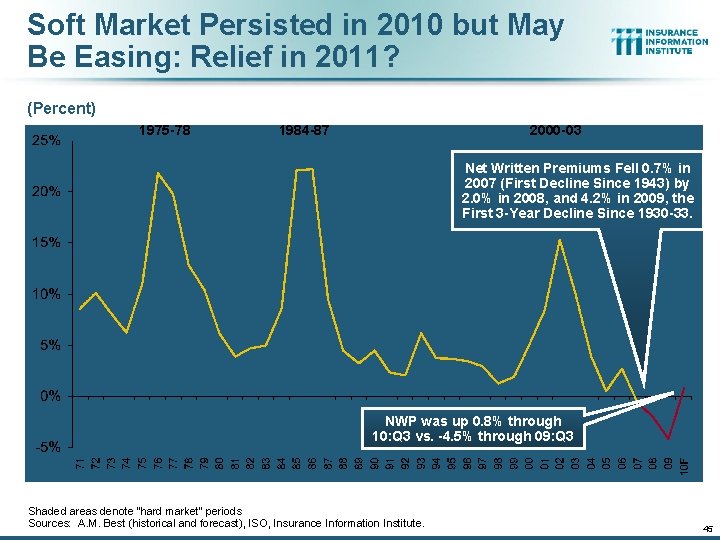
Soft Market Persisted in 2010 but May Be Easing: Relief in 2011? (Percent) 1975 -78 1984 -87 2000 -03 Net Written Premiums Fell 0. 7% in 2007 (First Decline Since 1943) by 2. 0% in 2008, and 4. 2% in 2009, the First 3 -Year Decline Since 1930 -33. NWP was up 0. 8% through 10: Q 3 vs. -4. 5% through 09: Q 3 Shaded areas denote “hard market” periods Sources: A. M. Best (historical and forecast), ISO, Insurance Information Institute. 45
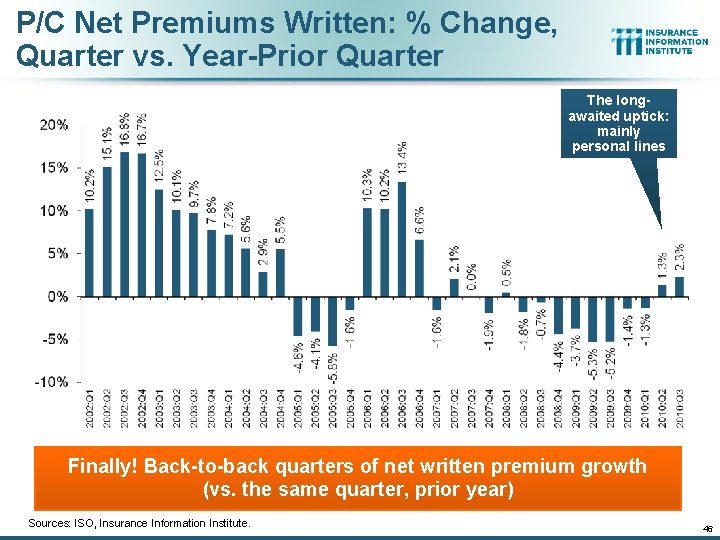
P/C Net Premiums Written: % Change, Quarter vs. Year-Prior Quarter The longawaited uptick: mainly personal lines Finally! Back-to-back quarters of net written premium growth (vs. the same quarter, prior year) Sources: ISO, Insurance Information Institute. 46
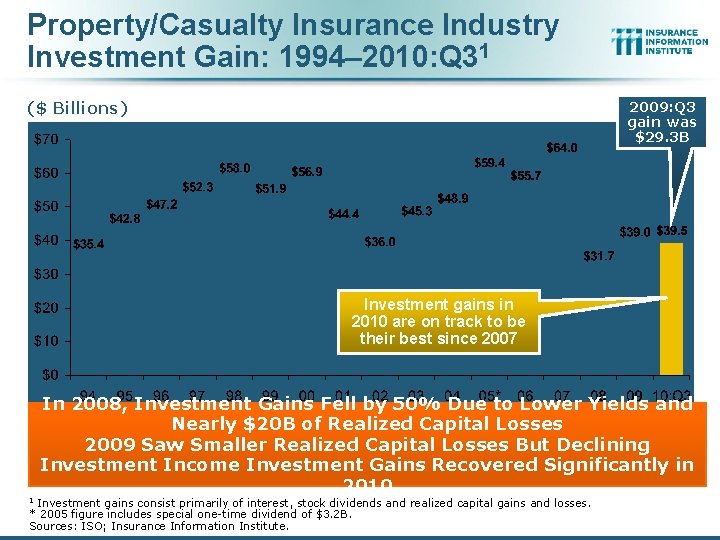
Property/Casualty Insurance Industry Investment Gain: 1994– 2010: Q 31 ($ Billions) 2009: Q 3 gain was $29. 3 B Investment gains in 2010 are on track to be their best since 2007 In 2008, Investment Gains Fell by 50% Due to Lower Yields and Nearly $20 B of Realized Capital Losses 2009 Saw Smaller Realized Capital Losses But Declining Investment Income Investment Gains Recovered Significantly in 2010 Investment gains consist primarily of interest, stock dividends and realized capital gains and losses. * 2005 figure includes special one-time dividend of $3. 2 B. Sources: ISO; Insurance Information Institute. 1
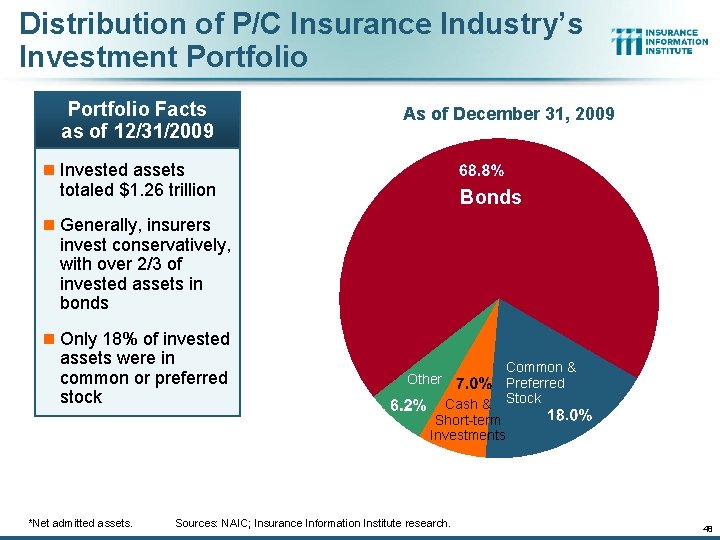
Distribution of P/C Insurance Industry’s Investment Portfolio Facts as of 12/31/2009 As of December 31, 2009 n Invested assets totaled $1. 26 trillion Bonds n Generally, insurers invest conservatively, with over 2/3 of invested assets in bonds n Only 18% of invested assets were in common or preferred stock *Net admitted assets. Other Cash & Short-term Investments Sources: NAIC; Insurance Information Institute research. Common & Preferred Stock 48
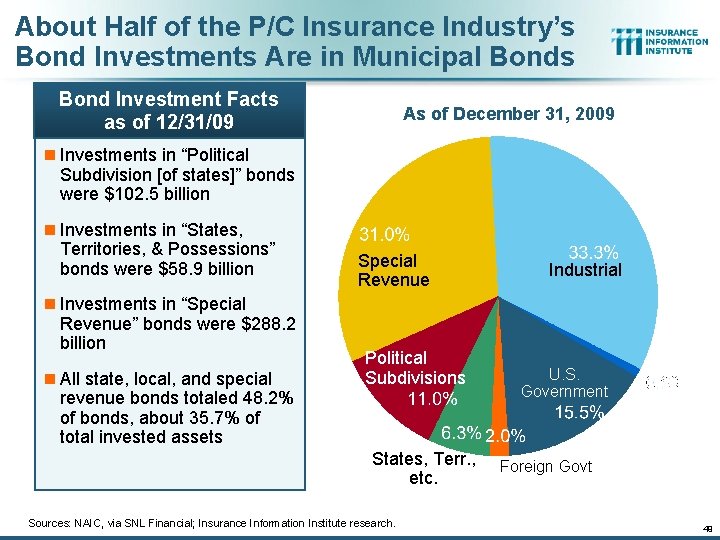
About Half of the P/C Insurance Industry’s Bond Investments Are in Municipal Bonds Bond Investment Facts as of 12/31/09 As of December 31, 2009 n Investments in “Political Subdivision [of states]” bonds were $102. 5 billion n Investments in “States, Territories, & Possessions” bonds were $58. 9 billion n Investments in “Special Revenue” bonds were $288. 2 billion n All state, local, and special revenue bonds totaled 48. 2% of bonds, about 35. 7% of total invested assets Special Revenue Political Subdivisions States, Terr. , etc. Sources: NAIC, via SNL Financial; Insurance Information Institute research. Industrial U. S. Government Foreign Govt 49
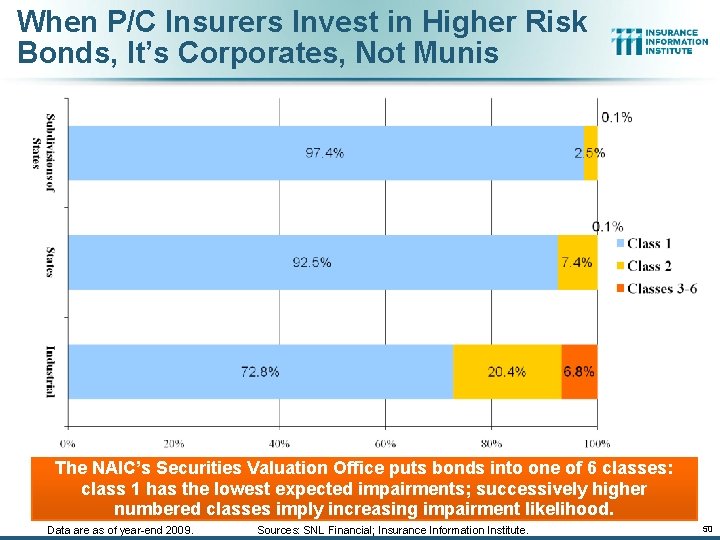
When P/C Insurers Invest in Higher Risk Bonds, It’s Corporates, Not Munis The NAIC’s Securities Valuation Office puts bonds into one of 6 classes: class 1 has the lowest expected impairments; successively higher numbered classes imply increasing impairment likelihood. Data are as of year-end 2009. Sources: SNL Financial; Insurance Information Institute. 50
Financial Strength & Ratings Industry Remained Strong in 2010 Despite Lingering Impacts of the Global Financial Crisis 51
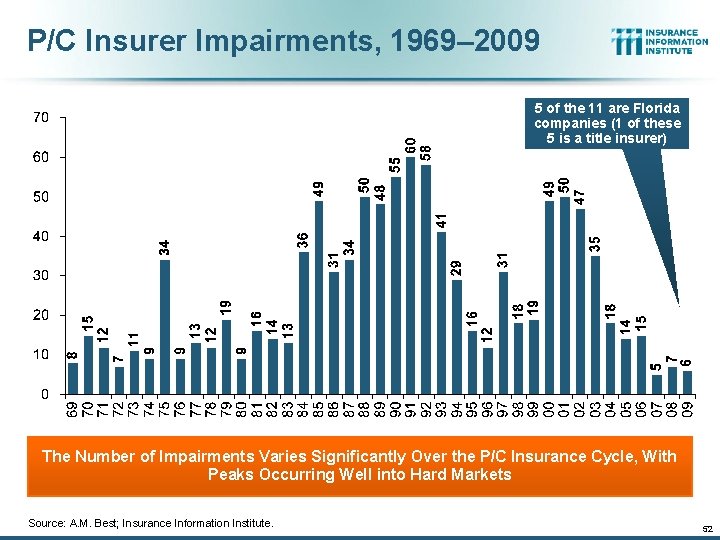
P/C Insurer Impairments, 1969– 2009 5 of the 11 are Florida companies (1 of these 5 is a title insurer) The Number of Impairments Varies Significantly Over the P/C Insurance Cycle, With Peaks Occurring Well into Hard Markets Source: A. M. Best; Insurance Information Institute. 52
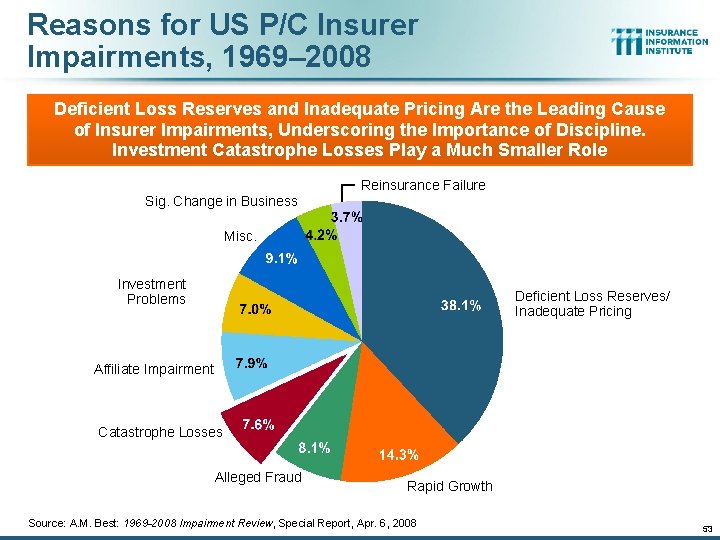
Reasons for US P/C Insurer Impairments, 1969– 2008 Deficient Loss Reserves and Inadequate Pricing Are the Leading Cause of Insurer Impairments, Underscoring the Importance of Discipline. Investment Catastrophe Losses Play a Much Smaller Role Reinsurance Failure Sig. Change in Business Misc. Investment Problems Deficient Loss Reserves/ Inadequate Pricing Affiliate Impairment Catastrophe Losses Alleged Fraud Rapid Growth Source: A. M. Best: 1969 -2008 Impairment Review, Special Report, Apr. 6, 2008 53
Capital/Policyholder Surplus (US) Improving Financial Markets, Moderate CAT Losses Are Restoring Capacity 54
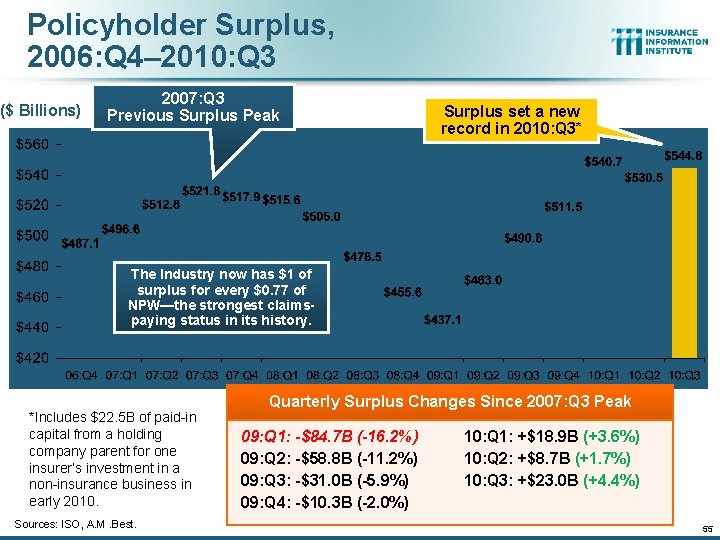
Policyholder Surplus, 2006: Q 4– 2010: Q 3 ($ Billions) 2007: Q 3 Previous Surplus Peak Surplus set a new record in 2010: Q 3* The Industry now has $1 of surplus for every $0. 77 of NPW—the strongest claimspaying status in its history. *Includes $22. 5 B of paid-in capital from a holding company parent for one insurer’s investment in a non-insurance business in early 2010. Sources: ISO, A. M. Best. Quarterly Surplus Changes Since 2007: Q 3 Peak 09: Q 1: -$84. 7 B (-16. 2%) 09: Q 2: -$58. 8 B (-11. 2%) 09: Q 3: -$31. 0 B (-5. 9%) 09: Q 4: -$10. 3 B (-2. 0%) 10: Q 1: +$18. 9 B (+3. 6%) 10: Q 2: +$8. 7 B (+1. 7%) 10: Q 3: +$23. 0 B (+4. 4%) 55
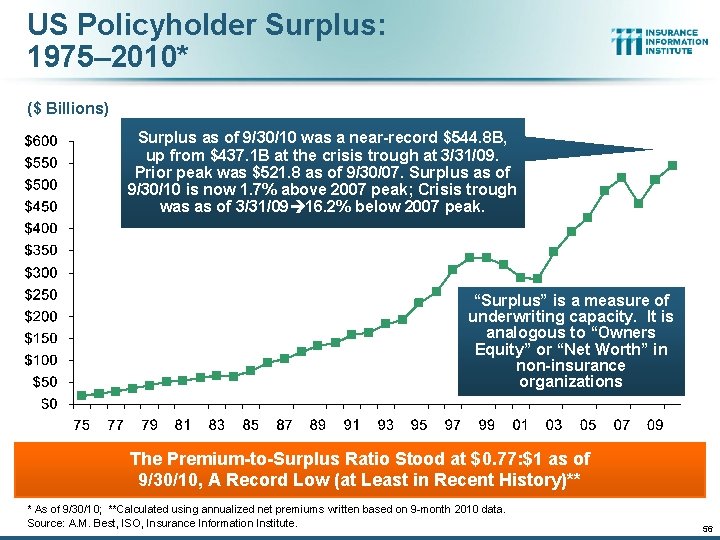
US Policyholder Surplus: 1975– 2010* ($ Billions) Surplus as of 9/30/10 was a near-record $544. 8 B, up from $437. 1 B at the crisis trough at 3/31/09. Prior peak was $521. 8 as of 9/30/07. Surplus as of 9/30/10 is now 1. 7% above 2007 peak; Crisis trough was as of 3/31/09 16. 2% below 2007 peak. “Surplus” is a measure of underwriting capacity. It is analogous to “Owners Equity” or “Net Worth” in non-insurance organizations The Premium-to-Surplus Ratio Stood at $0. 77: $1 as of 9/30/10, A Record Low (at Least in Recent History)** * As of 9/30/10; **Calculated using annualized net premiums written based on 9 -month 2010 data. Source: A. M. Best, ISO, Insurance Information Institute. 56
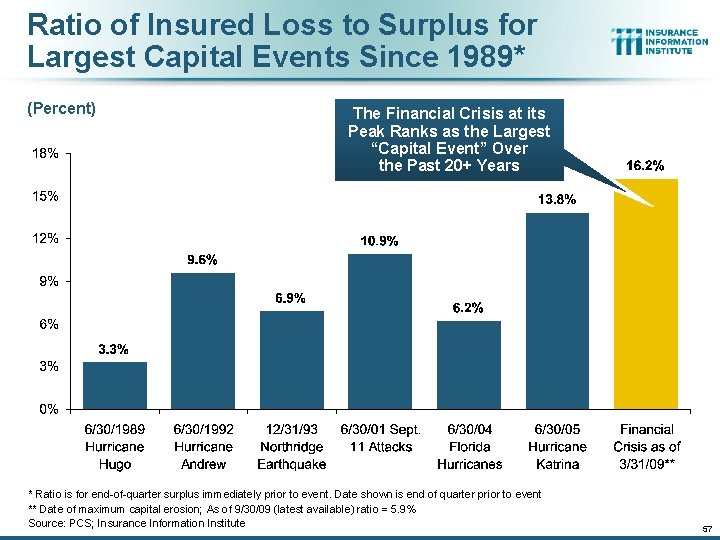
Ratio of Insured Loss to Surplus for Largest Capital Events Since 1989* (Percent) The Financial Crisis at its Peak Ranks as the Largest “Capital Event” Over the Past 20+ Years * Ratio is for end-of-quarter surplus immediately prior to event. Date shown is end of quarter prior to event ** Date of maximum capital erosion; As of 9/30/09 (latest available) ratio = 5. 9% Source: PCS; Insurance Information Institute 57
The Deepwater Horizon Disaster: Insurance Market Impacts Download Full Power. Point Presentation at: www. iii. org/presentations
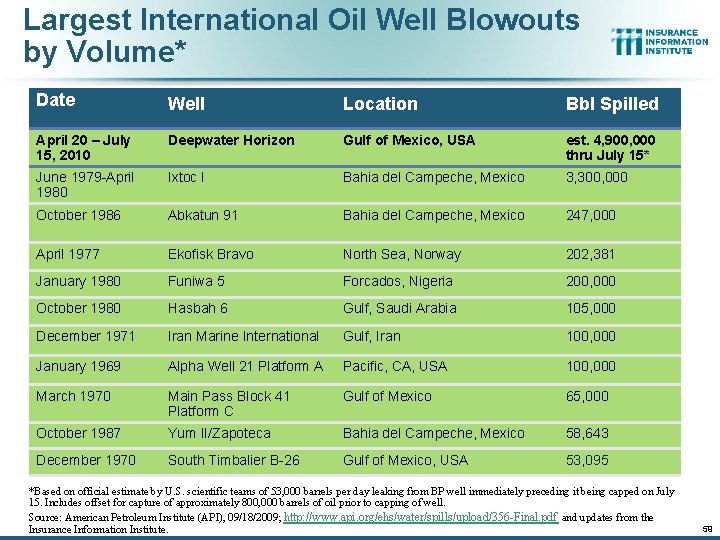
Largest International Oil Well Blowouts by Volume* Date Well Location Bbl Spilled April 20 – July 15, 2010 Deepwater Horizon Gulf of Mexico, USA est. 4, 900, 000 thru July 15* June 1979 -April 1980 Ixtoc I Bahia del Campeche, Mexico 3, 300, 000 October 1986 Abkatun 91 Bahia del Campeche, Mexico 247, 000 April 1977 Ekofisk Bravo North Sea, Norway 202, 381 January 1980 Funiwa 5 Forcados, Nigeria 200, 000 October 1980 Hasbah 6 Gulf, Saudi Arabia 105, 000 December 1971 Iran Marine International Gulf, Iran 100, 000 January 1969 Alpha Well 21 Platform A Pacific, CA, USA 100, 000 March 1970 Main Pass Block 41 Platform C Gulf of Mexico 65, 000 October 1987 Yum II/Zapoteca Bahia del Campeche, Mexico 58, 643 December 1970 South Timbalier B-26 Gulf of Mexico, USA 53, 095 *Based on official estimate by U. S. scientific teams of 53, 000 barrels per day leaking from BP well immediately preceding it being capped on July 15. Includes offset for capture of approximately 800, 000 barrels of oil prior to capping of well. Source: American Petroleum Institute (API), 09/18/2009; http: //www. api. org/ehs/water/spills/upload/356 -Final. pdf and updates from the Insurance Information Institute. 59
Long-Run Implications of Deepwater Horizon on Energy & Energy Insurance Markets n Deepwater Horizon Will Become the Single Most Expensive Environmental Disaster in US History n Vast Majority of Losses Will Be Paid by BP and Its Partners n $20 Billion Compensation Fund Should Reduce Litigation n Total Insured Losses Likely in the $3 Billion Range (still uncertain) n Insured losses are Spread Globally Across a Wide Range of Insurers and Reinsurers Ø Although unprecedented, the event was manageable and had a minimally disruptive effect on offshore energy insurance markets n Reaction (and Overreaction) to Spill Will Have Multi-Decade Impact on Energy Business and Insurers Ø Impacts will not be confined to offshore oil & gas industry n Regulatory Changes Are Occurring n Insurers Developing Products to Meet New Regulatory Requirements Imposed on Operators Source: Insurance Information Institute 60
Some Property Catastrophe Issues Likely To Be in the News in 2011 A Wide Variety of Potential Concerns in the Year Ahead 61
Property Insurance Issues Likely To Be in the News in 2011 n Busy 2011 Hurricane Season Anticipated Ø 2010 was busy, but with little impact on US Ø Solvency of state-run insurers may be questioned n Terrorism Ø Was a major concern in 2010, perhaps more so in 2011 Ø 10 th anniversary of 9/11 attack n Environmental Disasters Ø Reverberations of Deepwater Horizon n Flood Program Reauthorization (expires 9/30/11) n Sinkholes Ø Florida’s “other” property insurance problem n Regulatory Issues Ø Nearly half of the state insurance regulators in the US are new in 2011. How will they react to the challenges poses by CAT losses? Source: Insurance Information Institute 62
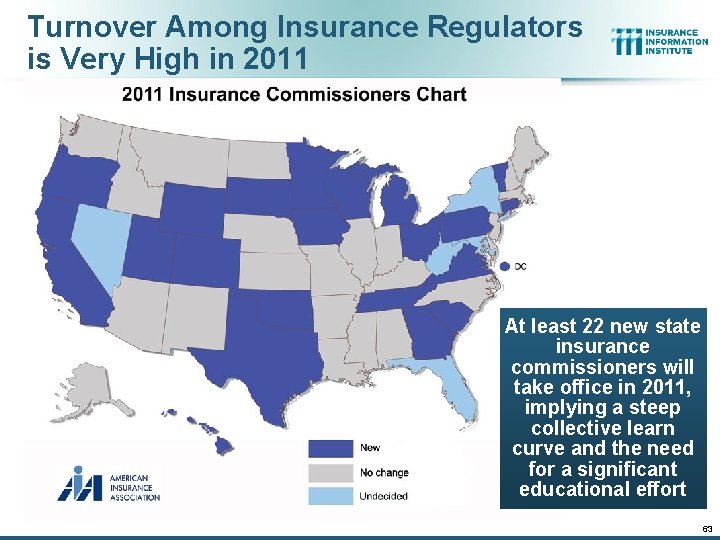
Turnover Among Insurance Regulators is Very High in 2011 At least 22 new state insurance commissioners will take office in 2011, implying a steep collective learn curve and the need for a significant educational effort 63
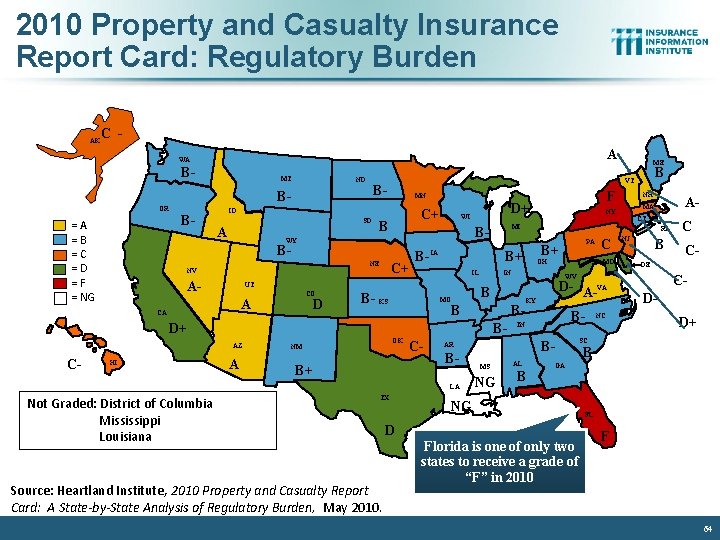
2010 Property and Casualty Insurance Report Card: Regulatory Burden C - AK AL A WA B- MT ND OR B- =A =B =C =D =F = NG A NV A- C+ A D B- KS D+ Not Graded: District of Columbia Mississippi Louisiana MO TX Source: Heartland Institute, 2010 Property and Casualty Report Card: A State-by-State Analysis of Regulatory Burden, May 2010. CT OH NJ B B- D- A-VA KY B- TN B- NC C C- DE WV B B- OK NM MD IN B C PA B+ B+ IL A- MA NY RI C- AR Source: James Madison Institute, February B- 2008. AL MS A B+ B NG LA AZ HI B- IA NH MI B- UT CO D+ WI WY B- CA C- C+ B NE F MN ID SD B VT B- B- ME CDD+ SC B- GA NG D Florida is one of only two states to receive a grade of “F” in 2010 FL F 64
Insurance Information Institute Online: www. iii. org Thank you for your time and your attention! Twitter: twitter. com/bob_hartwig 65
Q AND A
Question and Answer Process To ask a question, please press 1 4 on your phone. An operator will facilitate your participation. 67
More Information Press Inquiries Terese Rosenthal Phone: 609. 243. 4339 E-mail: trosenthal@munichreamerica. com 68
THANK YOU FOR ATTENDING TODAY’S WEBINAR.
© Copyright 2011 Munich Reinsurance America, Inc. All rights reserved. "Munich Re" and the Munich Re logo are internationally protected registered trademarks. The material in this presentation is provided for your information only, and is not permitted to be further distributed without the express written permission of Munich Reinsurance America, Inc. or Munich Re. This material is not intended to be legal, underwriting, financial, or any other type of professional advice. Examples given are for illustrative purposes only. Each reader should consult an attorney and other appropriate advisors to determine the applicability of any particular contract language to the reader's specific circumstances.