Xchromosomal markers and Fam Link X Athens May
- Slides: 21
X-chromosomal markers and Fam. Link. X Athens, May 29, 2014
Use of markers on the X-chromosome to solve relationship issues • X-chromosomal typing in males reveals their haplotype. • Males transmit their whole chromosome X to their daughters. • All sisters share their paternal Chr. X haplotype. • Furthermore, it is very likely that haplotypes of linkage groups remain stable throughout many generations. Consequently, they are a powerful means to demonstrate kinship
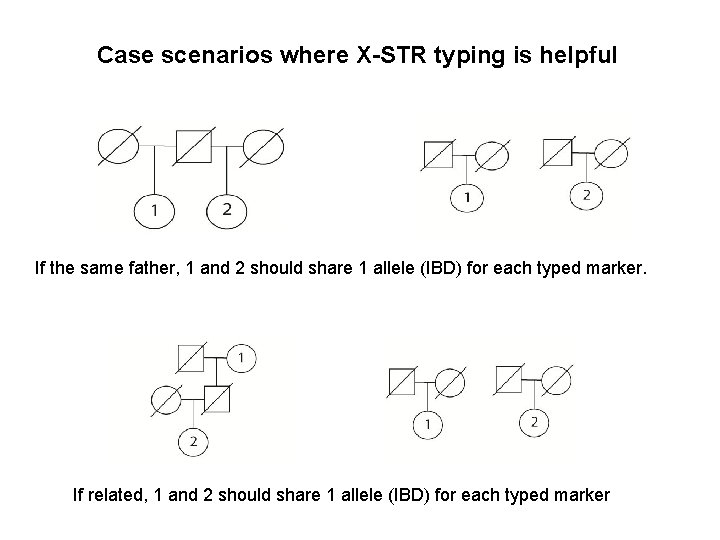
Case scenarios where X-STR typing is helpful If the same father, 1 and 2 should share 1 allele (IBD) for each typed marker. If related, 1 and 2 should share 1 allele (IBD) for each typed marker
Argus X 12 12 STRs in 4 clusters (3 STRs in each cluster) LD and linkage should be accounted for
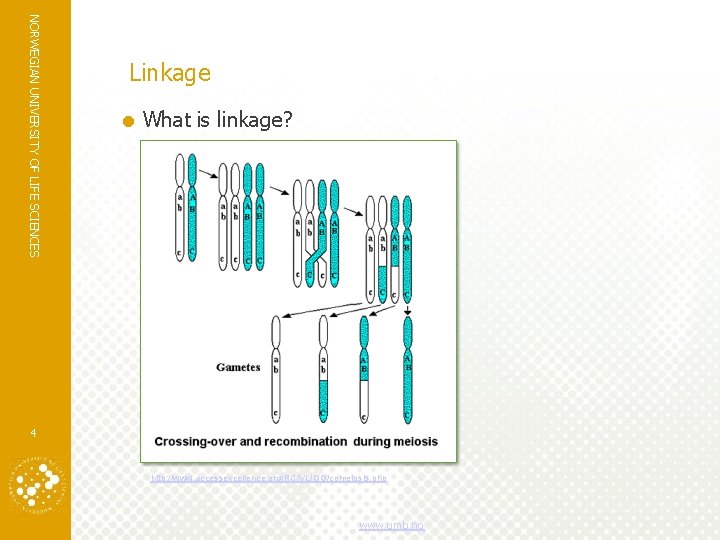
NORWEGIAN UNIVERSITY OF LIFE SCIENCES Linkage What is linkage? – Two markers are inherited as a unit – Linkage is the opposite of recombina – Observable within a pedigree 4 http: //www. accessexcellence. org/RC/VL/GG/comeiosis. php www. umb. no
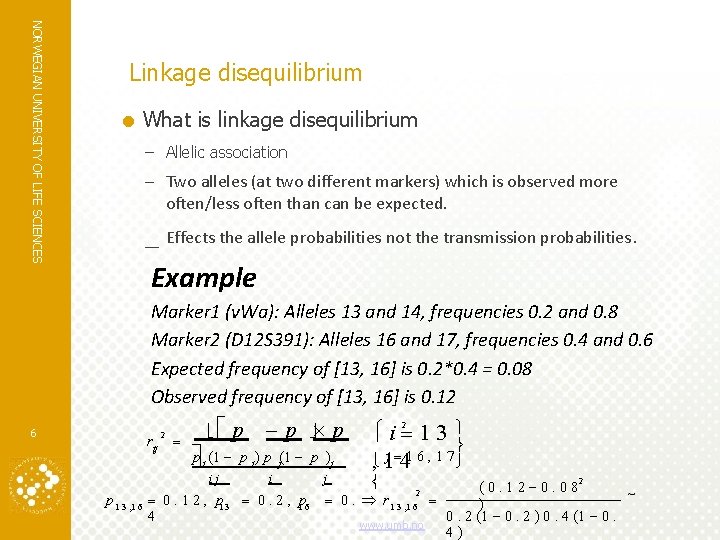
NORWEGIAN UNIVERSITY OF LIFE SCIENCES Linkage disequilibrium What is linkage disequilibrium – Allelic association – Two alleles (at two different markers) which is observed more often/less often than can be expected. – Effects the allele probabilities not the transmission probabilities. Example Marker 1 (v. Wa): Alleles 13 and 14, frequencies 0. 2 and 0. 8 Marker 2 (D 12 S 391): Alleles 16 and 17, frequencies 0. 4 and 0. 6 Expected frequency of [13, 16] is 0. 2*0. 4 = 0. 08 Observed frequency of [13, 16] is 0. 12 6 rij 2 p p p p (1 p ) i i ij j i p 1 3 , 1 6 0. 1 2 , p 1 3 0. 2 , 1 p 6 4 j j i 1 3 j 41 6 , 1 7 , 1 2 2 0. r 1 3 , 1 6 www. umb. no 2 (0. 12 0. 08 ) 0. 2 (1 0. 2 ) 0. 4 (1 0. 4) 0. 042
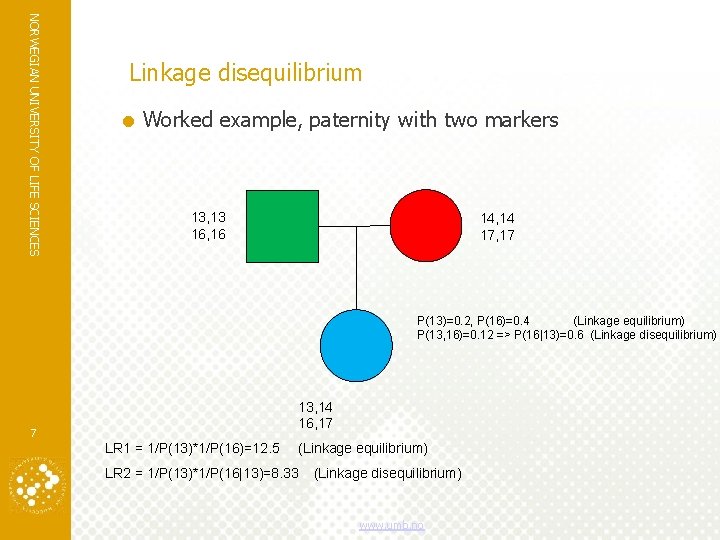
NORWEGIAN UNIVERSITY OF LIFE SCIENCES Linkage disequilibrium Worked example, paternity with two markers 13, 13 16, 16 14, 14 17, 17 P(13)=0. 2, P(16)=0. 4 (Linkage equilibrium) P(13, 16)=0. 12 => P(16|13)=0. 6 (Linkage disequilibrium) 13, 14 16, 17 7 LR 1 = 1/P(13)*1/P(16)=12. 5 (Linkage equilibrium) LR 2 = 1/P(13)*1/P(16|13)=8. 33 (Linkage disequilibrium) www. umb. no
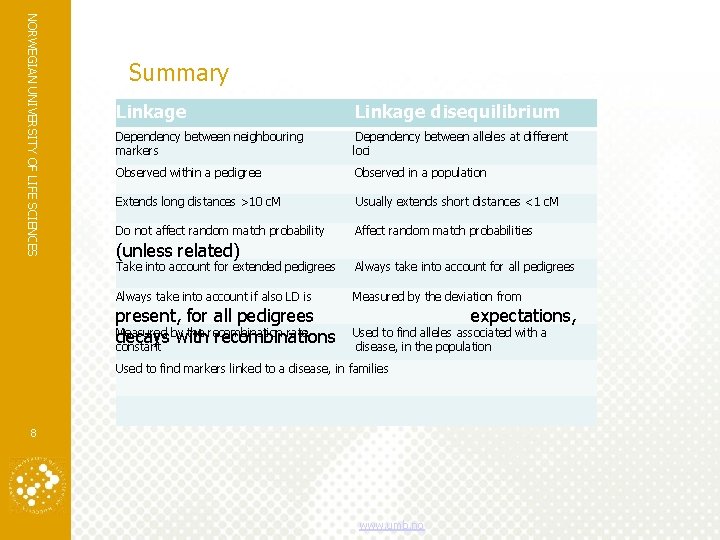
NORWEGIAN UNIVERSITY OF LIFE SCIENCES Summary Linkage disequilibrium Dependency between neighbouring markers Dependency between alleles at different loci Observed within a pedigree Observed in a population Extends long distances >10 c. M Usually extends short distances <1 c. M Do not affect random match probability Affect random match probabilities (unless related) Take into account for extended pedigrees Always take into account for all pedigrees Always take into account if also LD is Measured by the deviation from present, for all pedigrees Measured by the recombination rate, decays with recombinations constant expectations, Used to find alleles associated with a disease, in the population Used to find markers linked to a disease, in families 8 www. umb. no
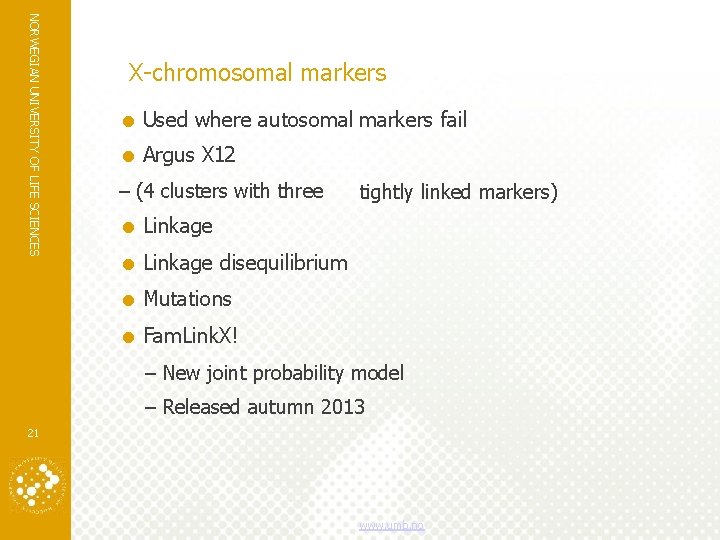
NORWEGIAN UNIVERSITY OF LIFE SCIENCES X-chromosomal markers Used where autosomal markers fail Argus X 12 – (4 clusters with three tightly linked markers) Linkage disequilibrium Mutations Fam. Link. X! – New joint probability model – Released autumn 2013 21 www. umb. no
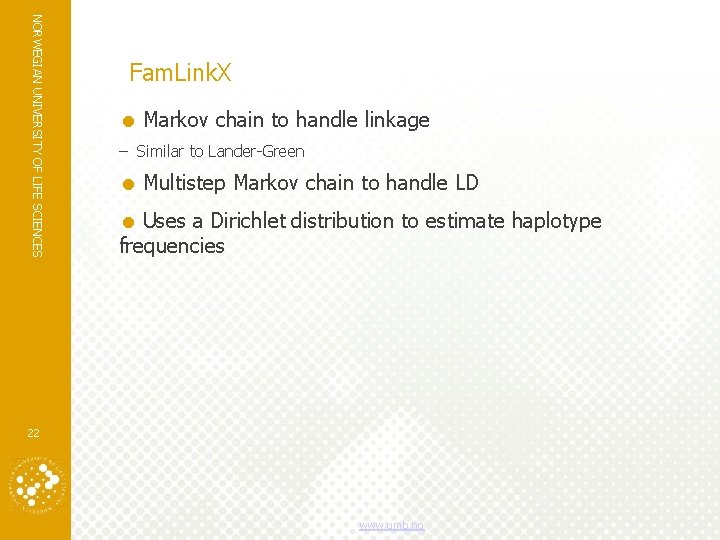
NORWEGIAN UNIVERSITY OF LIFE SCIENCES Fam. Link. X Markov chain to handle linkage – Similar to Lander-Green Multistep Markov chain to handle LD Uses a Dirichlet distribution to estimate haplotype frequencies 22 www. umb. no
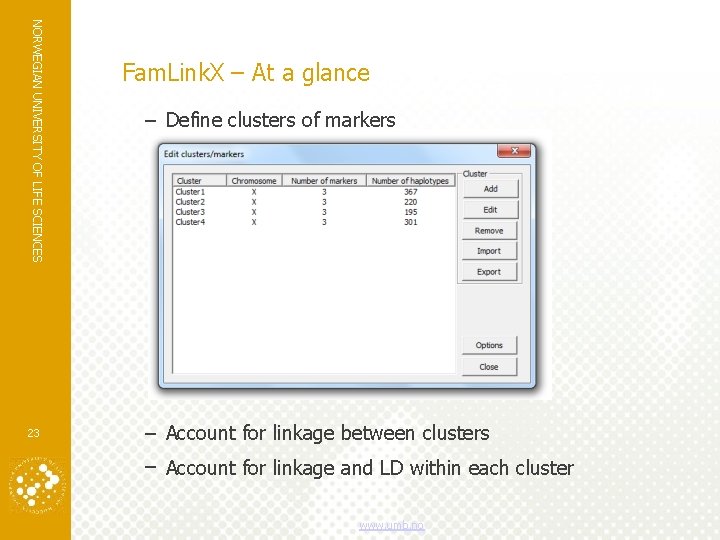
NORWEGIAN UNIVERSITY OF LIFE SCIENCES 23 Fam. Link. X – At a glance – Define clusters of markers – Account for linkage between clusters – Account for linkage and LD within each cluster www. umb. no
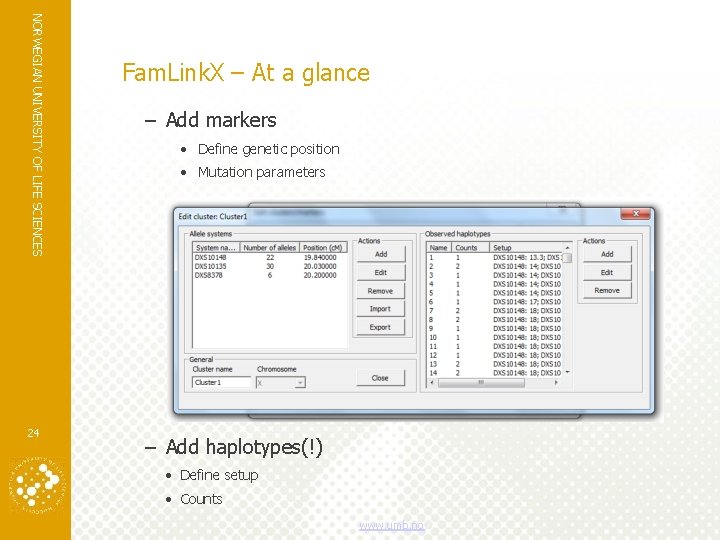
NORWEGIAN UNIVERSITY OF LIFE SCIENCES 24 Fam. Link. X – At a glance – Add markers • Define genetic position • Mutation parameters – Add haplotypes(!) • Define setup • Counts www. umb. no
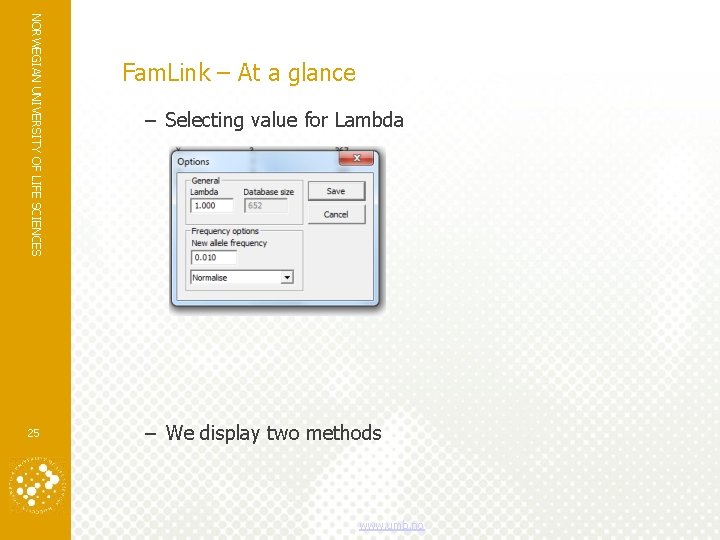
NORWEGIAN UNIVERSITY OF LIFE SCIENCES 25 Fam. Link – At a glance – Selecting value for Lambda – We display two methods www. umb. no
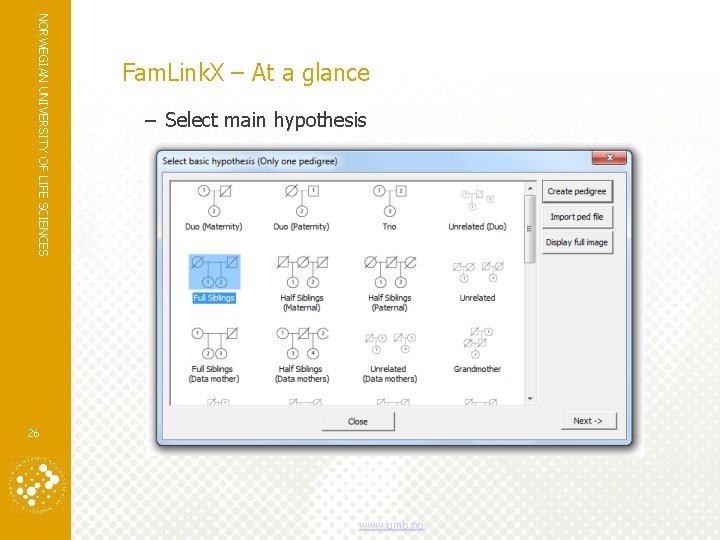
NORWEGIAN UNIVERSITY OF LIFE SCIENCES Fam. Link. X – At a glance – Select main hypothesis 26 www. umb. no
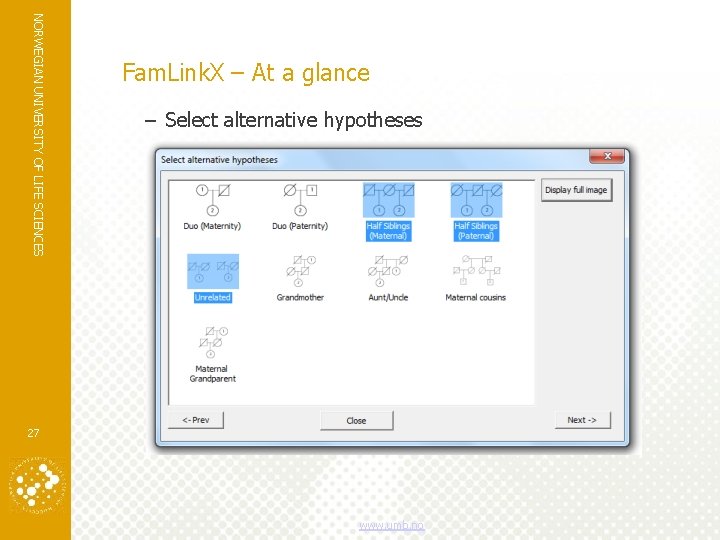
NORWEGIAN UNIVERSITY OF LIFE SCIENCES Fam. Link. X – At a glance – Select alternative hypotheses 27 www. umb. no
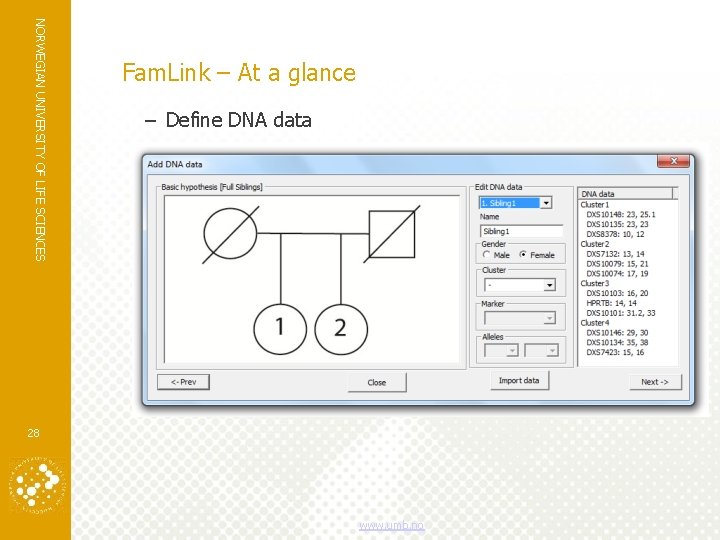
NORWEGIAN UNIVERSITY OF LIFE SCIENCES Fam. Link – At a glance – Define DNA data 28 www. umb. no
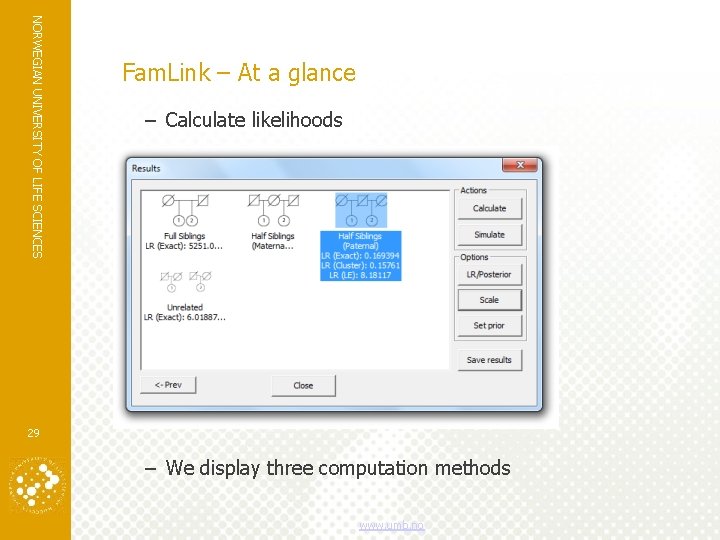
NORWEGIAN UNIVERSITY OF LIFE SCIENCES Fam. Link – At a glance – Calculate likelihoods 29 – We display three computation methods www. umb. no
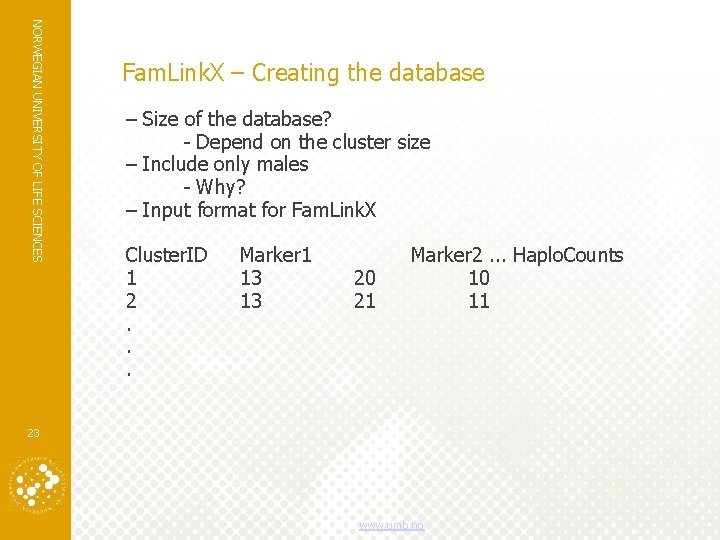
NORWEGIAN UNIVERSITY OF LIFE SCIENCES Fam. Link. X – Creating the database – Size of the database? - Depend on the cluster size – Include only males - Why? – Input format for Fam. Link. X Cluster. ID 1 2. . . Marker 1 13 13 20 21 Marker 2. . . Haplo. Counts 10 11 23 www. umb. no
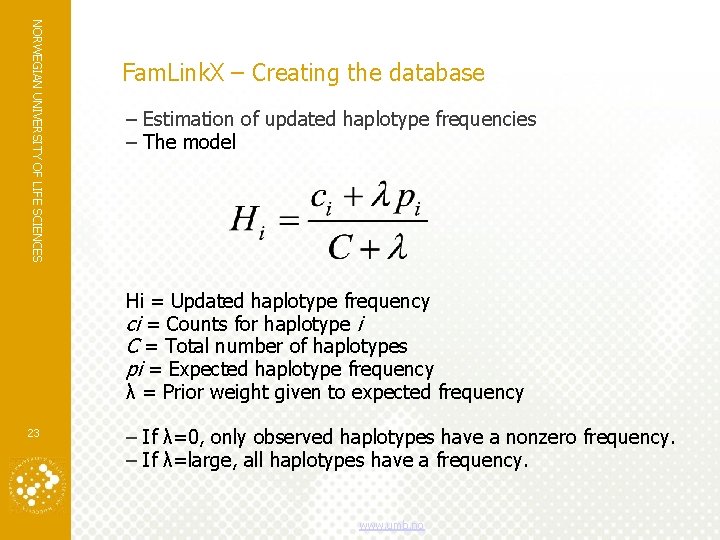
NORWEGIAN UNIVERSITY OF LIFE SCIENCES Fam. Link. X – Creating the database – Estimation of updated haplotype frequencies – The model Hi = Updated haplotype frequency ci = Counts for haplotype i C = Total number of haplotypes pi = Expected haplotype frequency λ = Prior weight given to expected frequency 23 – If λ=0, only observed haplotypes have a nonzero frequency. – If λ=large, all haplotypes have a frequency. www. umb. no
NORWEGIAN UNIVERSITY OF LIFE SCIENCES Fam. Link. X – Questions? 30 www. umb. no
NORWEGIAN UNIVERSITY OF LIFE SCIENCES EXERCISES 31 www. umb. no