What are the causes and consequences of variation
- Slides: 49
What are the causes and consequences of variation in diversity?
What are the causes and consequences of variation in diversity? How is diversity related to temporal variability?
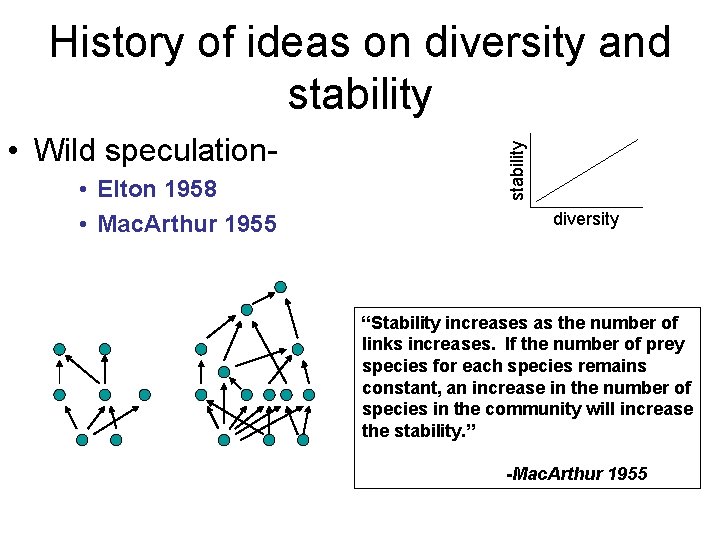
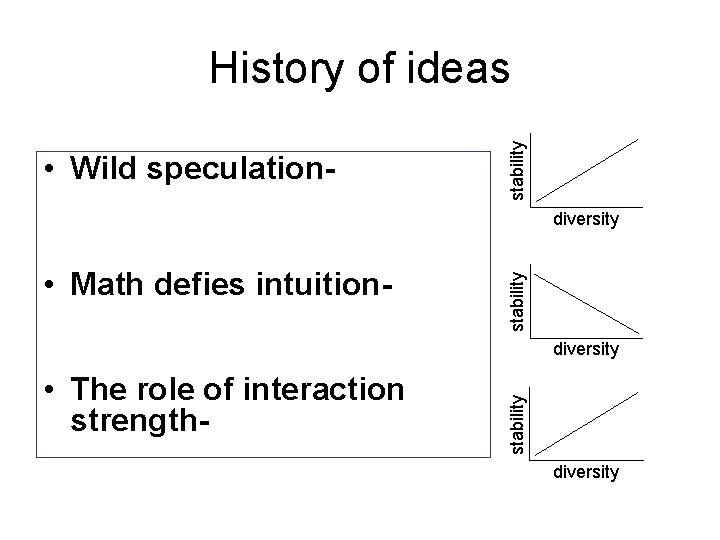
• Wild speculation • Elton 1958 • Mac. Arthur 1955 stability History of ideas on diversity and stability diversity “Stability increases as the number of links increases. If the number of prey species for each species remains constant, an increase in the number of species in the community will increase the stability. ” -Mac. Arthur 1955
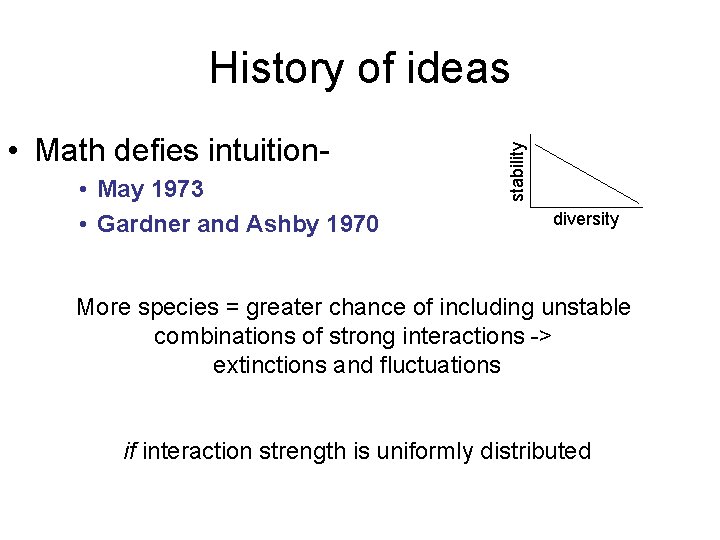
• Math defies intuition • May 1973 • Gardner and Ashby 1970 stability History of ideas diversity More species = greater chance of including unstable combinations of strong interactions -> extinctions and fluctuations if interaction strength is uniformly distributed
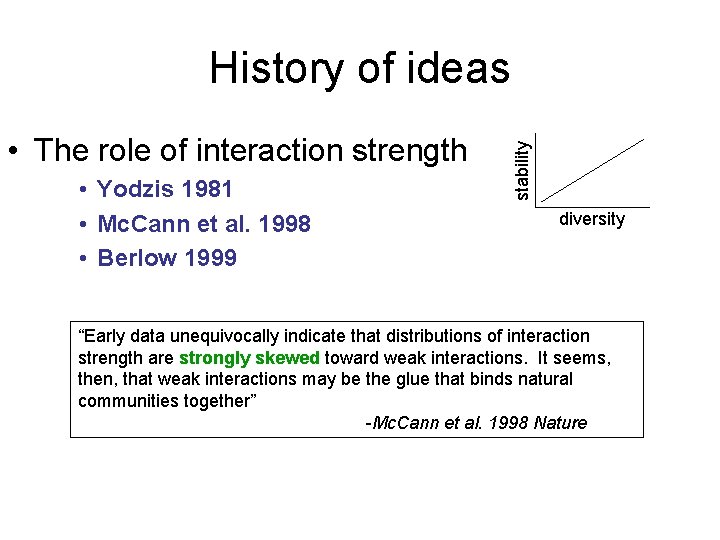
• The role of interaction strength • Yodzis 1981 • Mc. Cann et al. 1998 • Berlow 1999 stability History of ideas diversity “Early data unequivocally indicate that distributions of interaction strength are strongly skewed toward weak interactions. It seems, then, that weak interactions may be the glue that binds natural communities together” -Mc. Cann et al. 1998 Nature
• Wild speculation- stability History of ideas • Math defies intuition- stability diversity • The role of interaction strength- stability diversity
How are diversity and stability related in nature? What can species-time relations tell us about diversity and stability?
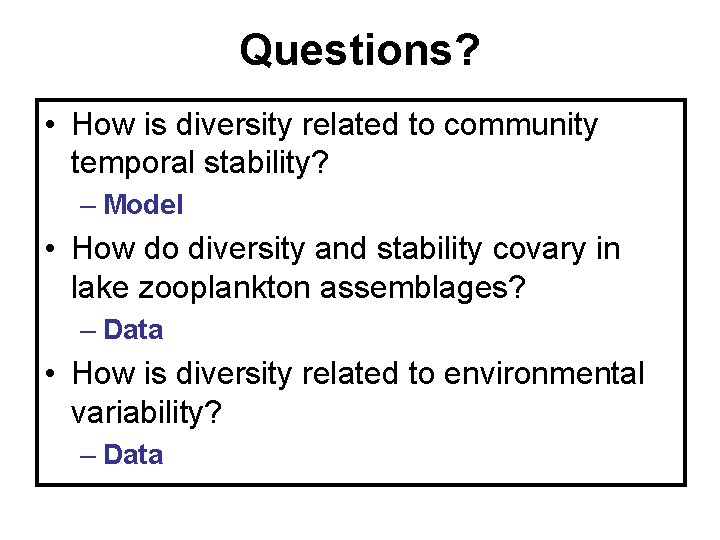
Questions? • How is diversity related to community temporal stability? – Model • How do diversity and stability covary in lake zooplankton assemblages? – Data • How is diversity related to environmental variability? – Data
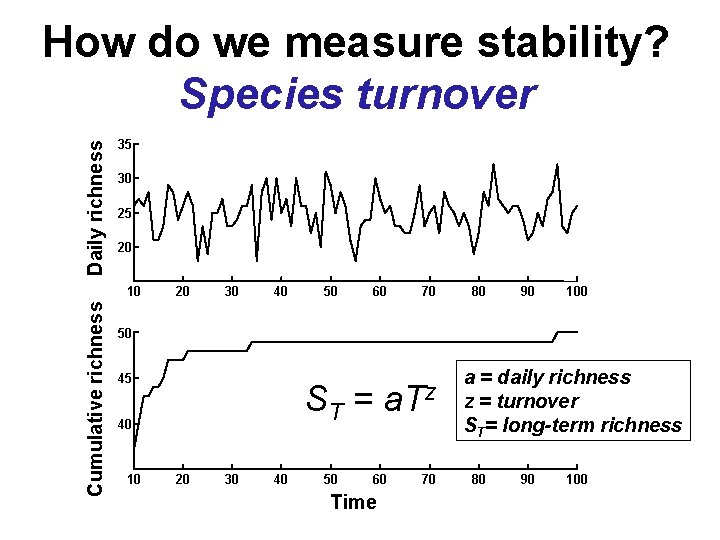
Daily richness How do we measure stability? Species turnover 35 30 25 20 Cumulative richness 10 20 30 40 50 60 70 80 90 100 50 45 ST = a. Tz 40 10 20 30 40 50 60 Time 70 a = daily richness z = turnover ST= long-term richness 80 90 100
How do species partition time… if diversity is driven by history ? Shurin 2007 Oikos 116: 957
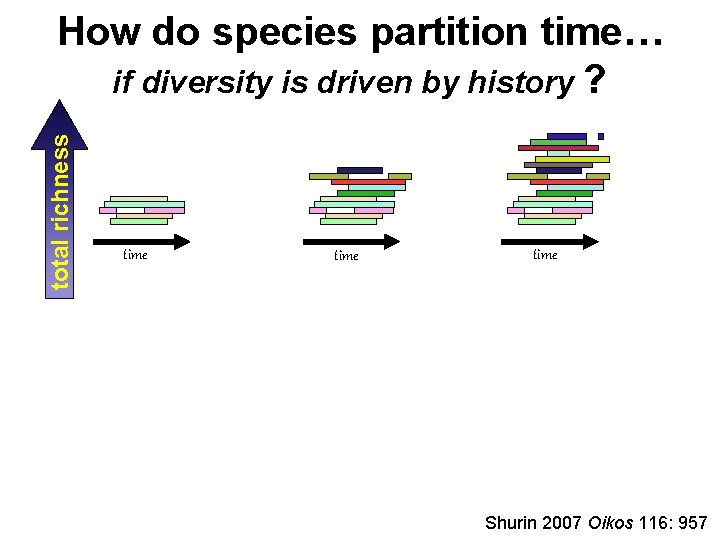
total richness How do species partition time… if diversity is driven by history ? time Shurin 2007 Oikos 116: 957
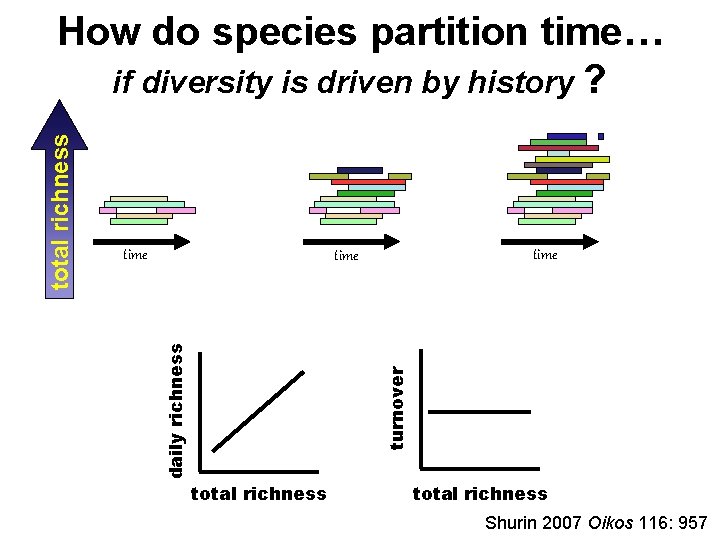
time turnover daily richness total richness How do species partition time… if diversity is driven by history ? total richness Shurin 2007 Oikos 116: 957
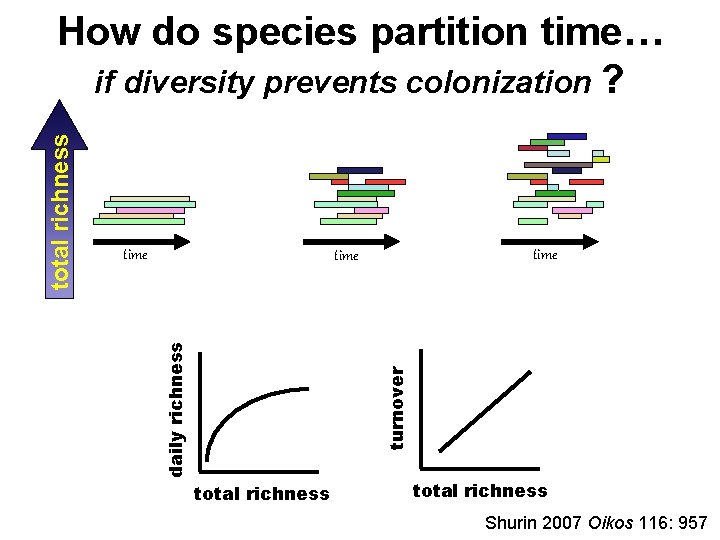
time turnover daily richness total richness How do species partition time… if diversity prevents colonization ? total richness Shurin 2007 Oikos 116: 957
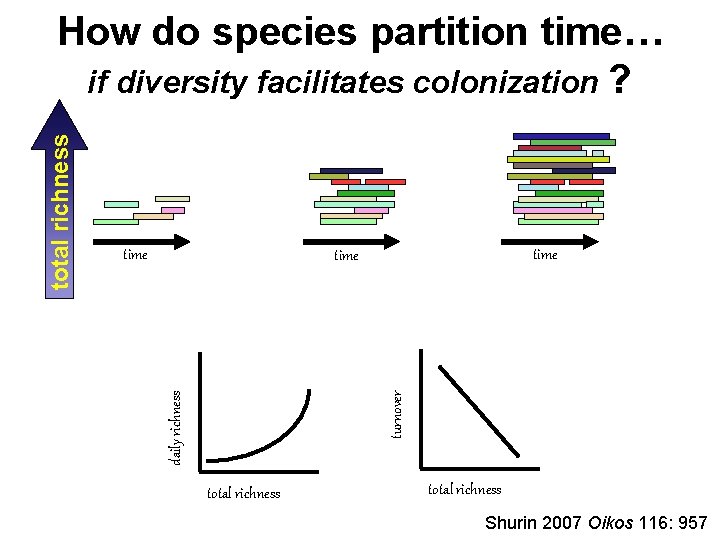
time turnover daily richness total richness How do species partition time… if diversity facilitates colonization ? total richness Shurin 2007 Oikos 116: 957
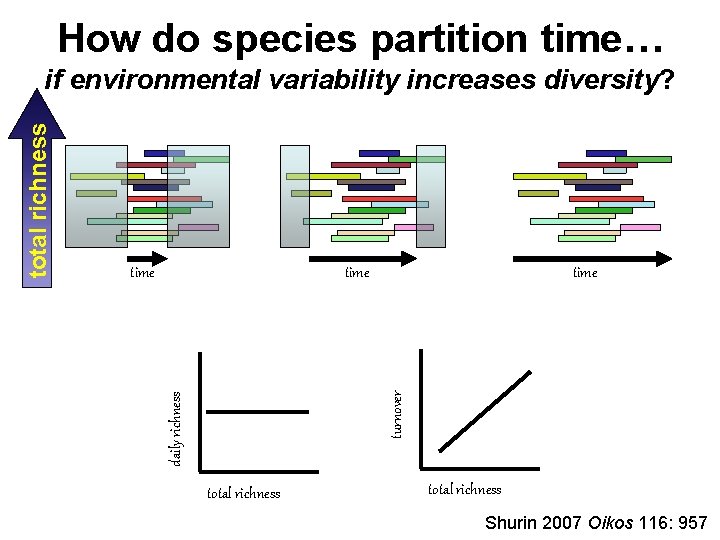
How do species partition time… time turnover time daily richness total richness if environmental variability increases diversity? total richness Shurin 2007 Oikos 116: 957
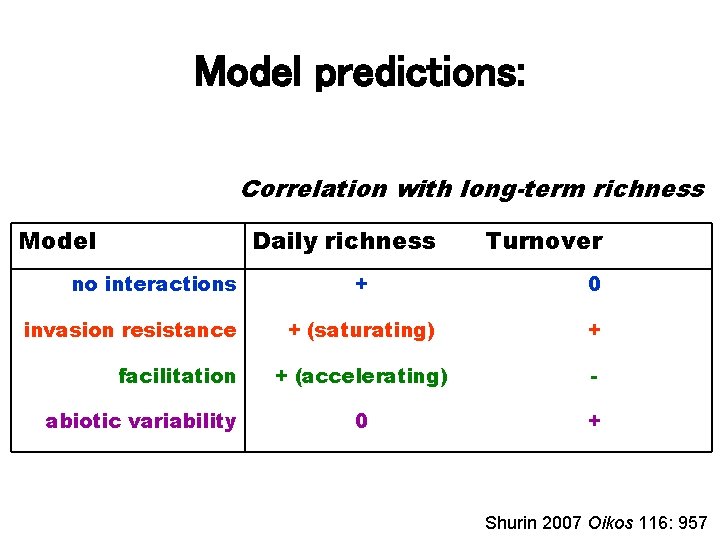
Model predictions: Correlation with long-term richness Model Daily richness no interactions invasion resistance facilitation abiotic variability Turnover + 0 + (saturating) + + (accelerating) - 0 + Shurin 2007 Oikos 116: 957
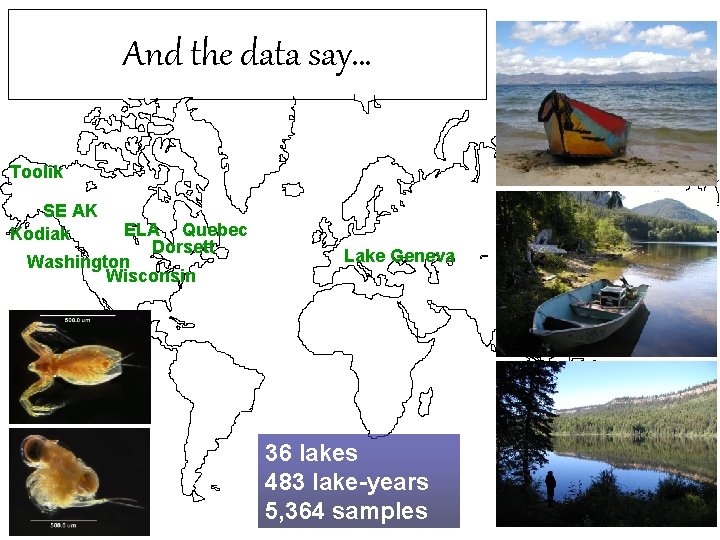
And the data say… Toolik SE AK Kodiak ELA Quebec Dorsett Washington Wisconsin Lake Geneva 36 lakes 483 lake-years 5, 364 samples
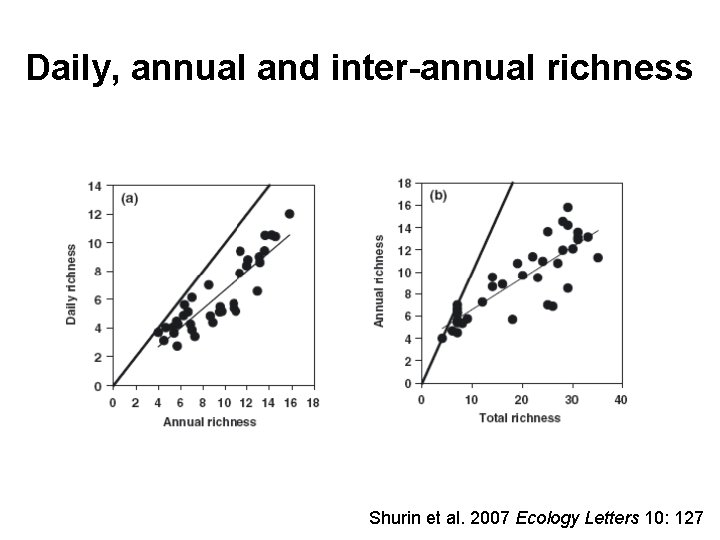
Daily, annual and inter-annual richness Shurin et al. 2007 Ecology Letters 10: 127
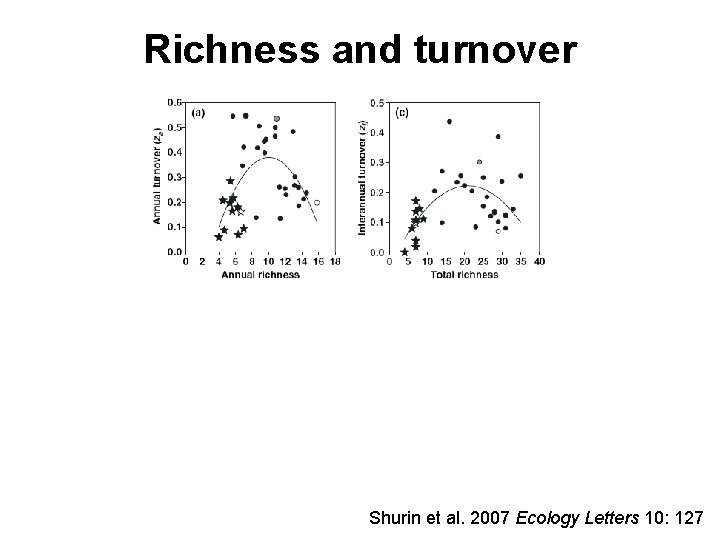
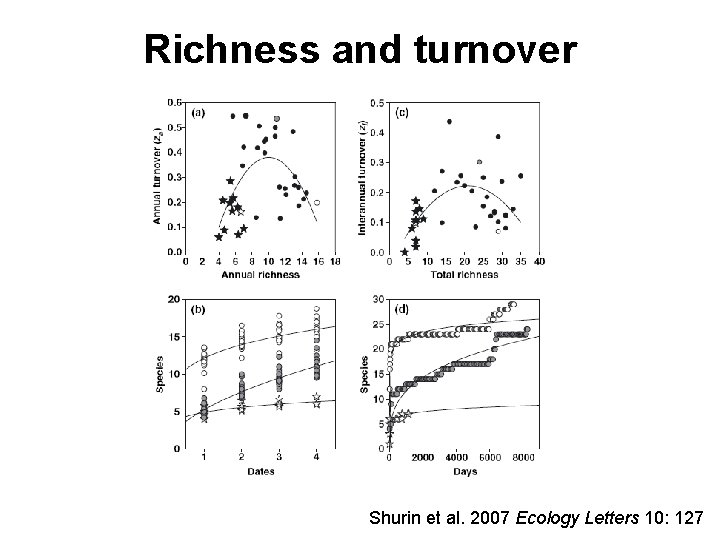
Richness and turnover Shurin et al. 2007 Ecology Letters 10: 127
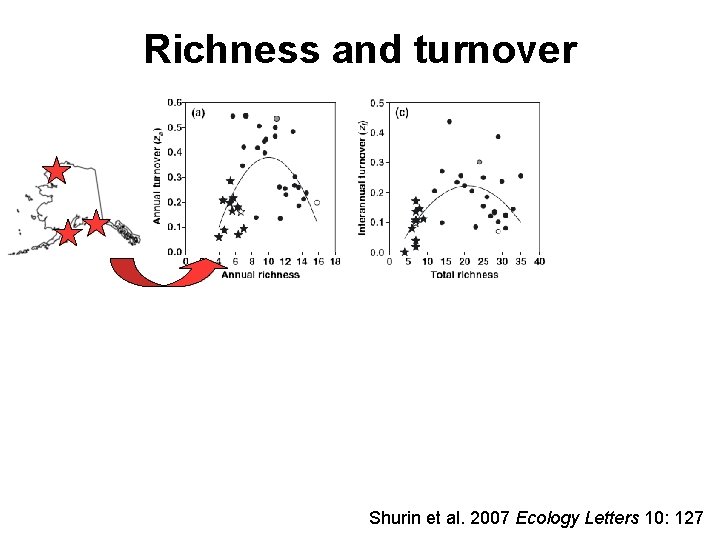
Richness and turnover Shurin et al. 2007 Ecology Letters 10: 127
Richness and turnover Shurin et al. 2007 Ecology Letters 10: 127
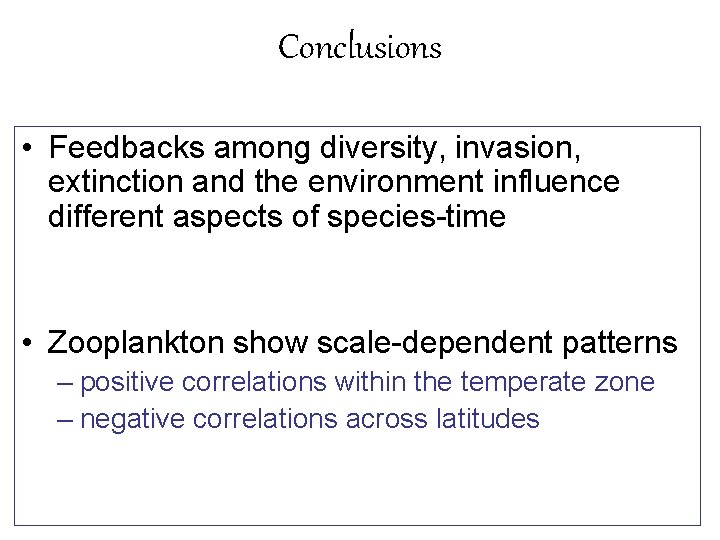
Conclusions • Feedbacks among diversity, invasion, extinction and the environment influence different aspects of species-time • Zooplankton show scale-dependent patterns – positive correlations within the temperate zone – negative correlations across latitudes
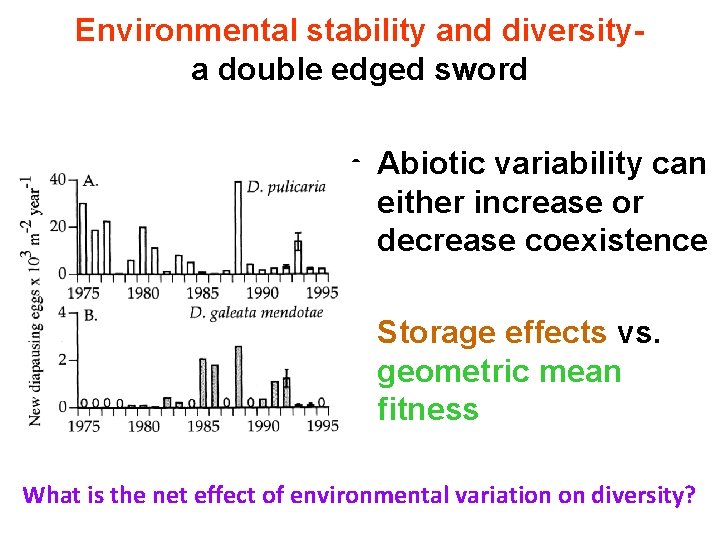
Environmental stability and diversitya double edged sword • Abiotic variability can either increase or decrease coexistence • Storage effects vs. geometric mean fitness What is the net effect of environmental variation on diversity?
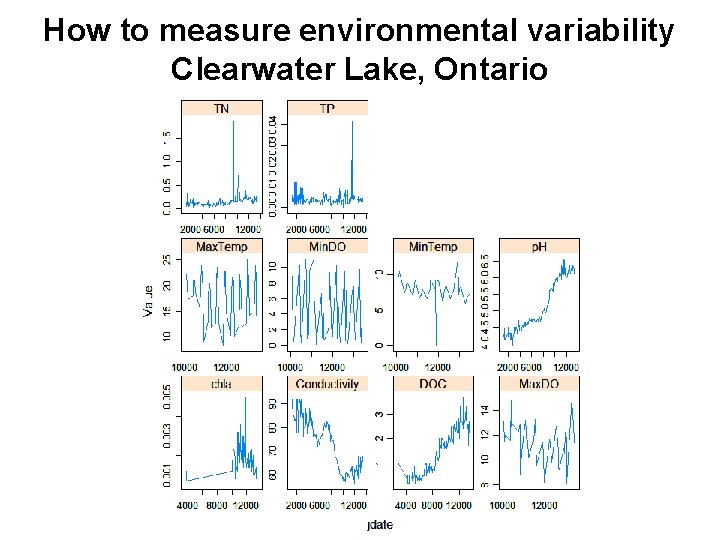
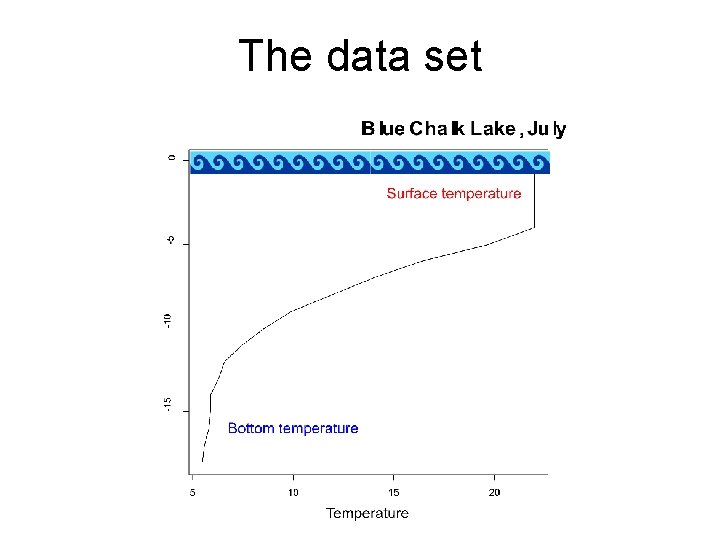
How to measure environmental variability Clearwater Lake, Ontario
The data set
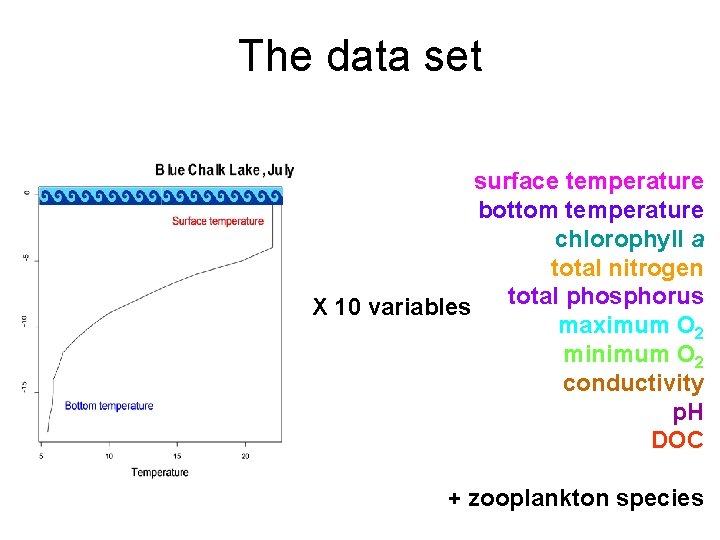
The data set surface temperature bottom temperature chlorophyll a total nitrogen total phosphorus X 10 variables maximum O 2 minimum O 2 conductivity p. H DOC + zooplankton species
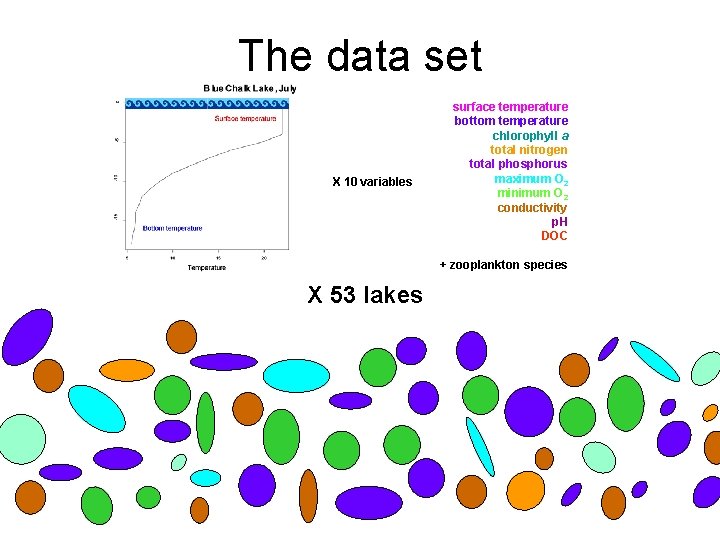
The data set X 10 variables surface temperature bottom temperature chlorophyll a total nitrogen total phosphorus maximum O 2 minimum O 2 conductivity p. H DOC + zooplankton species X 53 lakes
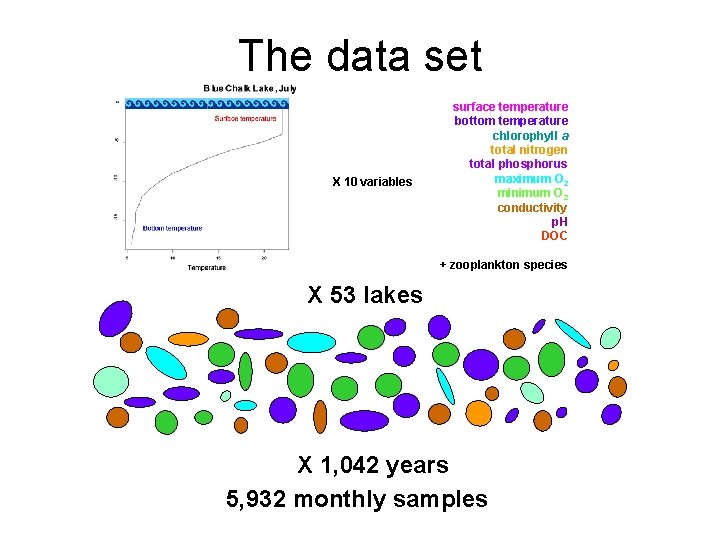
The data set X 10 variables surface temperature bottom temperature chlorophyll a total nitrogen total phosphorus maximum O 2 minimum O 2 conductivity p. H DOC + zooplankton species X 53 lakes X 1, 042 years 5, 932 monthly samples
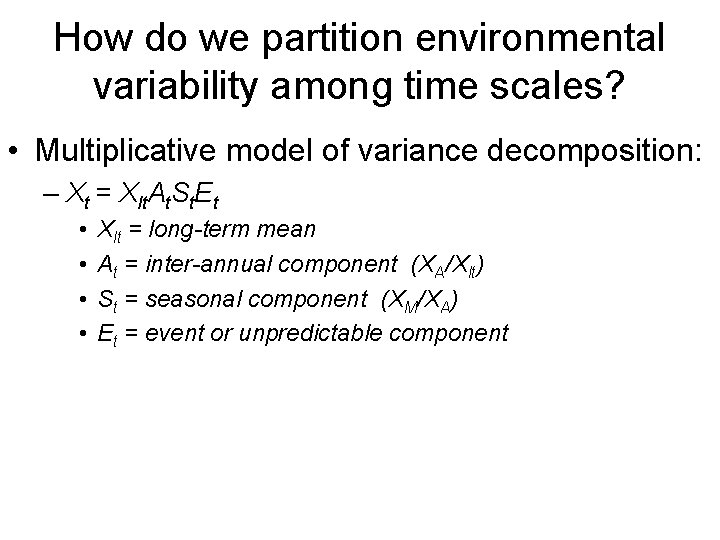
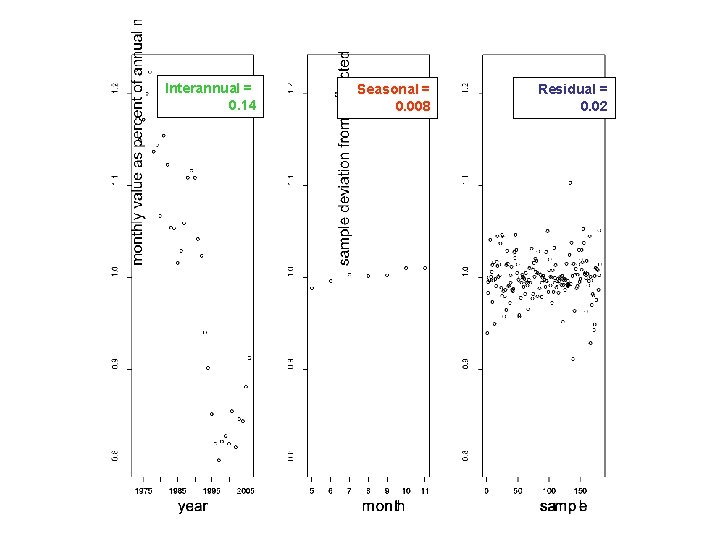
How do we partition environmental variability among time scales? • Multiplicative model of variance decomposition: – Xt = Xlt. At. St. Et • • Xlt = long-term mean At = inter-annual component (XA/Xlt) St = seasonal component (XM/XA) Et = event or unpredictable component
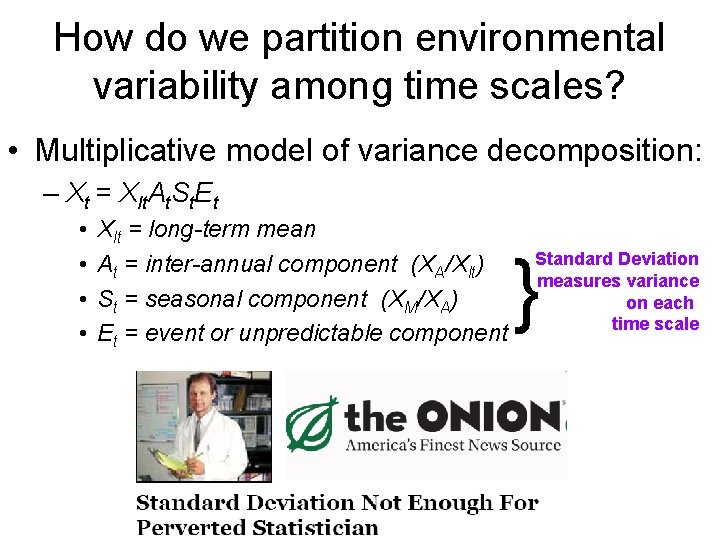
How do we partition environmental variability among time scales? • Multiplicative model of variance decomposition: – Xt = Xlt. At. St. Et • • Xlt = long-term mean At = inter-annual component (XA/Xlt) St = seasonal component (XM/XA) Et = event or unpredictable component } Standard Deviation measures variance on each time scale
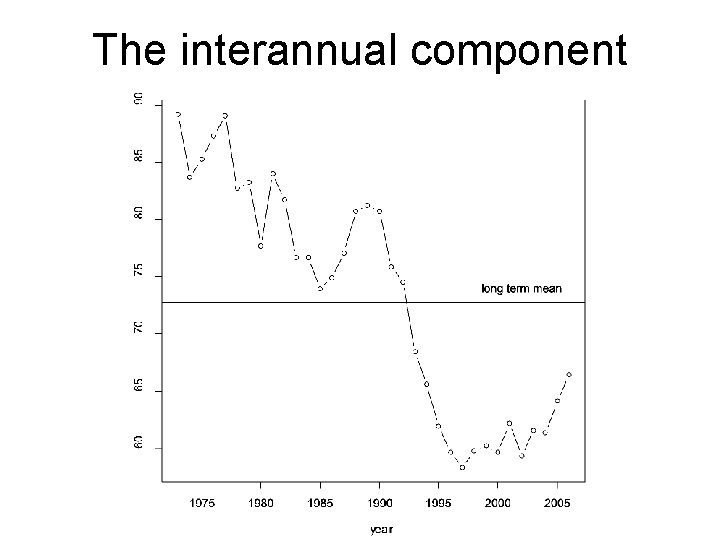
The interannual component
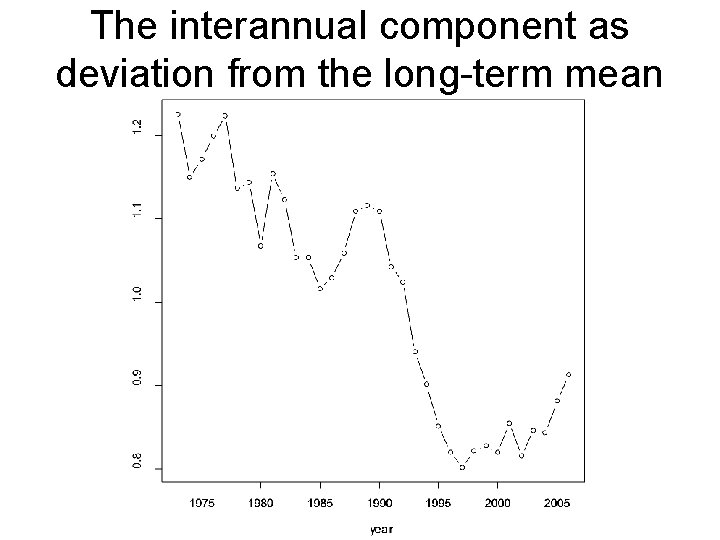
The interannual component as deviation from the long-term mean
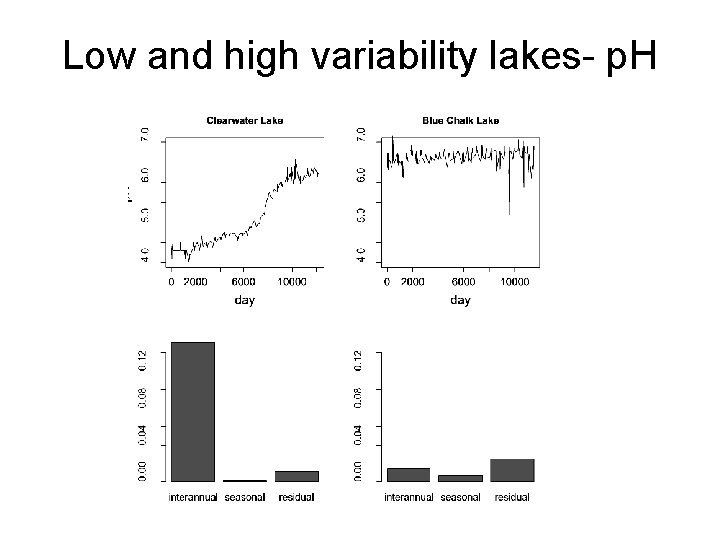
Interannual = 0. 14 Seasonal = 0. 008 Residual = 0. 02
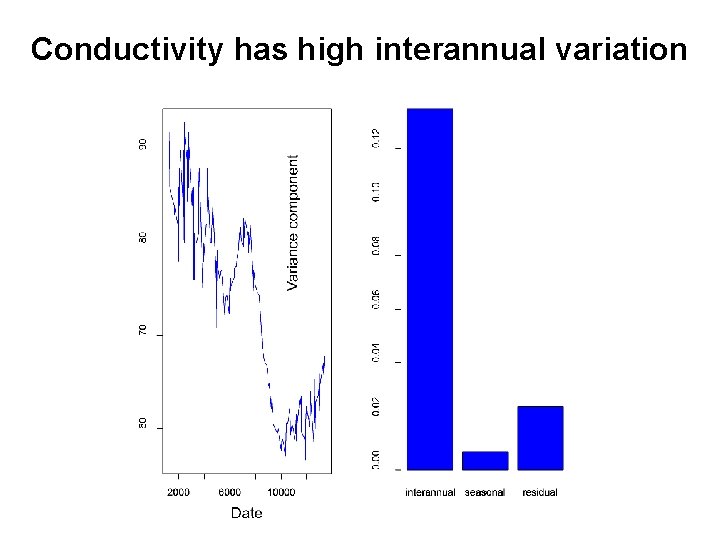
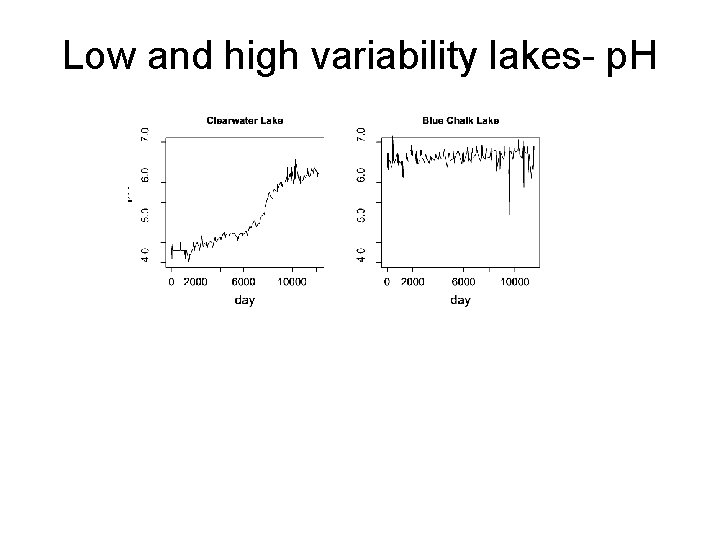
Conductivity has high interannual variation
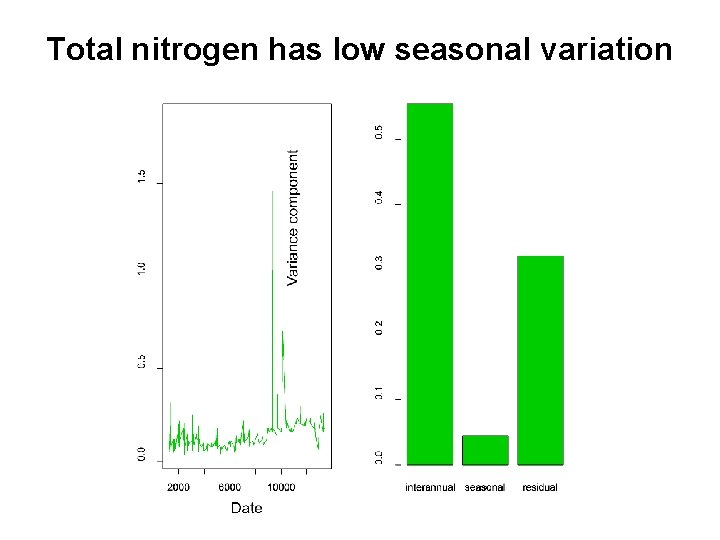
Total nitrogen has low seasonal variation
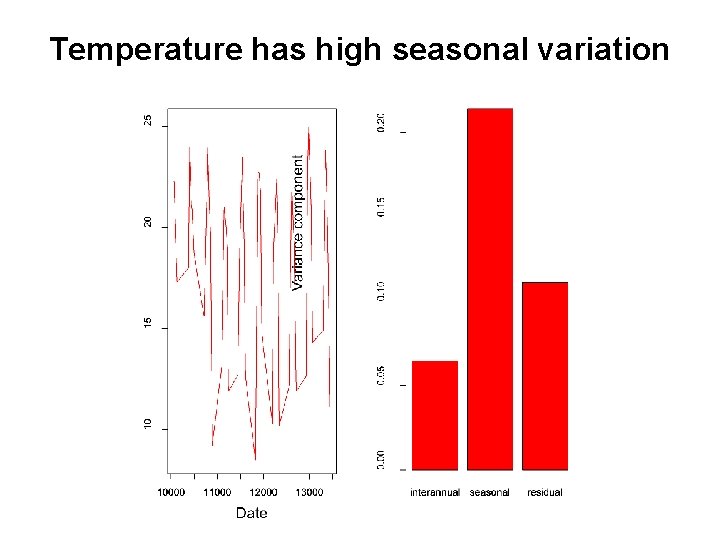
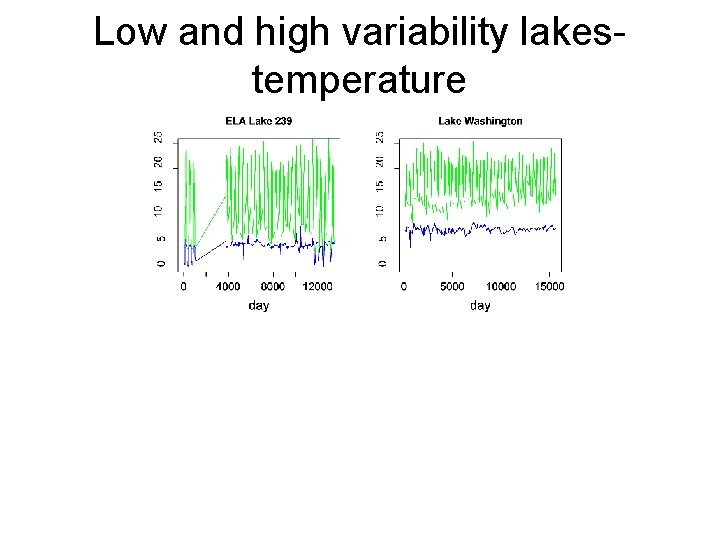
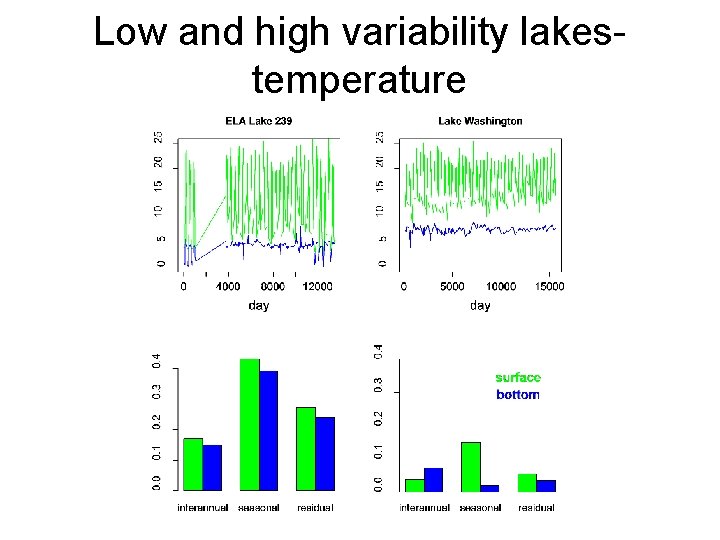
Temperature has high seasonal variation
Low and high variability lakes- p. H
Low and high variability lakes- p. H
Low and high variability lakestemperature
Low and high variability lakestemperature
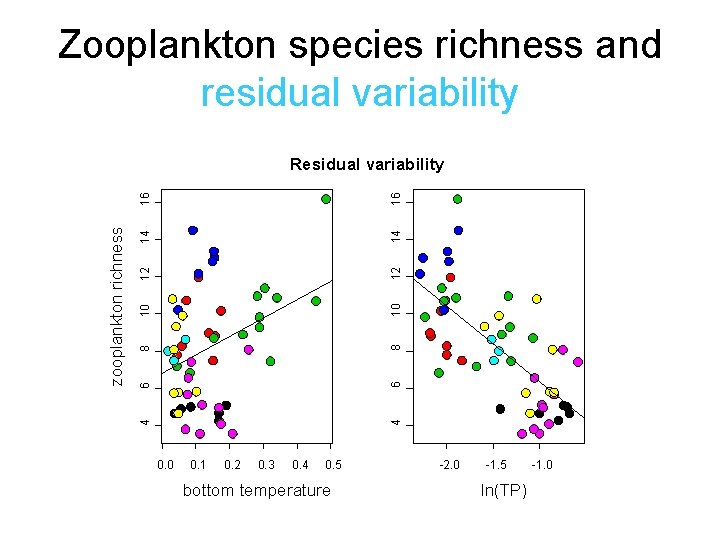
How does variability relate to zooplankton diversity? • Long-term mean • Interannual variability • Seasonal variability • Residual (unpredictable) variability
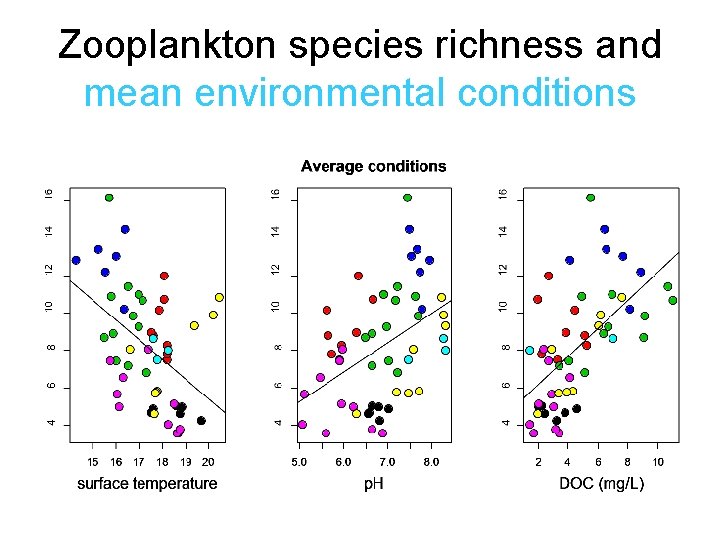
Zooplankton species richness and mean environmental conditions
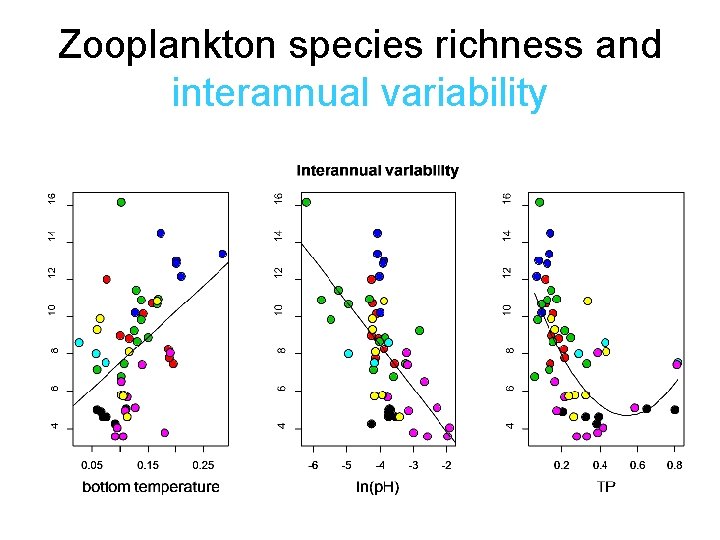
Zooplankton species richness and interannual variability
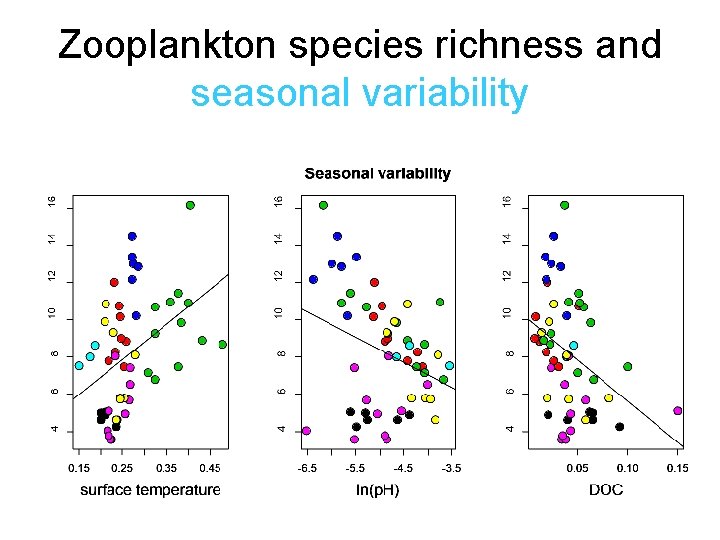
Zooplankton species richness and seasonal variability
Zooplankton species richness and residual variability 16 14 12 14 10 12 8 10 6 8 4 6 4 zooplankton richness 16 Residual variability 0. 0 0. 1 0. 2 0. 3 0. 4 0. 5 bottom temperature -2. 0 -1. 5 ln(TP) -1. 0
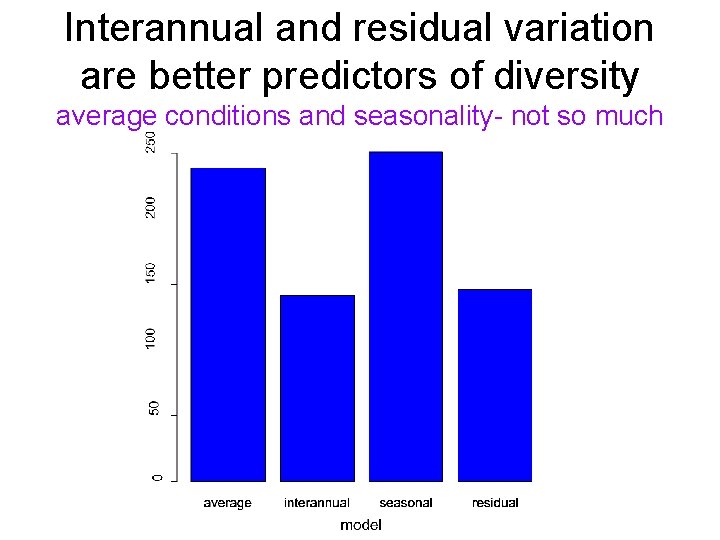
Interannual and residual variation are better predictors of diversity average conditions and seasonality- not so much
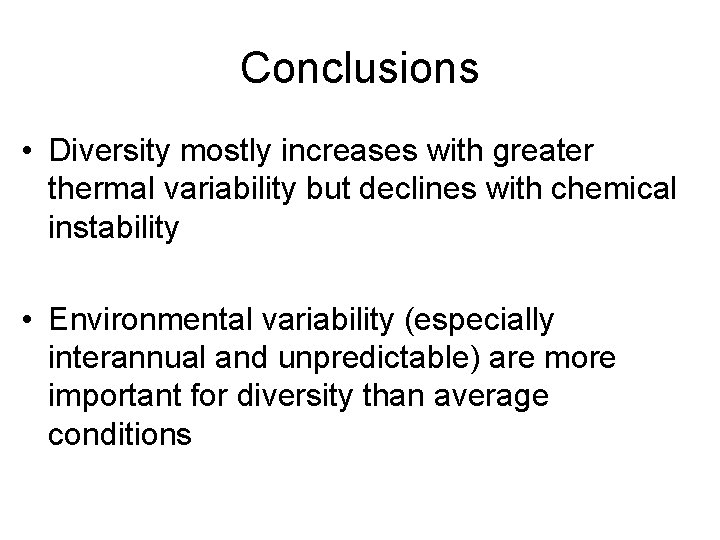
Conclusions • Diversity mostly increases with greater thermal variability but declines with chemical instability • Environmental variability (especially interannual and unpredictable) are more important for diversity than average conditions
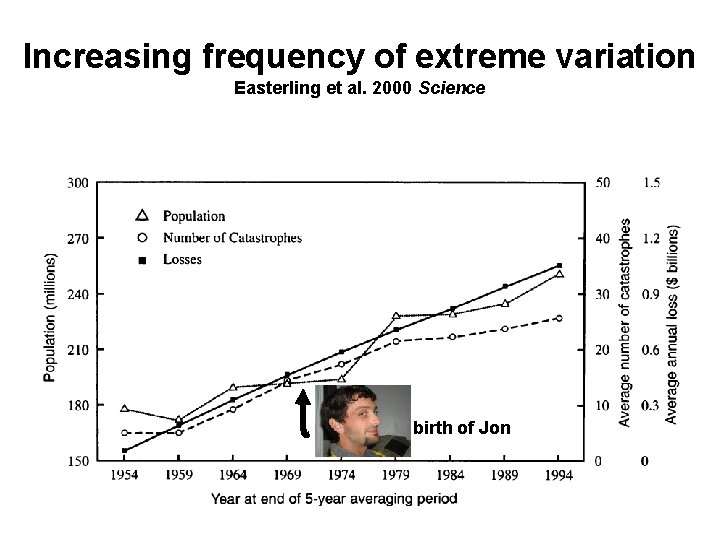
Increasing frequency of extreme variation Easterling et al. 2000 Science birth of Jon
Thanks • • • Helmut Hillebrand Monika Winder Rita Adrian Bill Keller Blake Matthews Andrew Paterson Michael Paterson Bernadette Pinel-Alloul Jim Rusak Shelley Arnott Allyson Longmuir Norm Yan