Water Quality and Water Testing Studies of streams


 Depth is needed to calculate Volume of Flow Calculation: • Measure the")
 A B C D E F G H I J K L")
 *At most points in the Brandywine that we test, the depth will")

 Velocity is a measure of how fast the stream water is moving")
 Calculation • Measure the width of the stream profile • Divide the")
 The volume of water that moves past a")

 x (average depth) x (average velocity) x")


 Temperature of the water directly affects biological and chemical processes. •")
 Calculation: • Temperature is measured at 4 points throughout the stream")


- Slides: 28
Water Quality and Water Testing
Studies of streams may involve the following measurements and analysis 1. Physical Parameters of the Stream 2. Biological Indicies 3. Chemical Composition of Stream Water
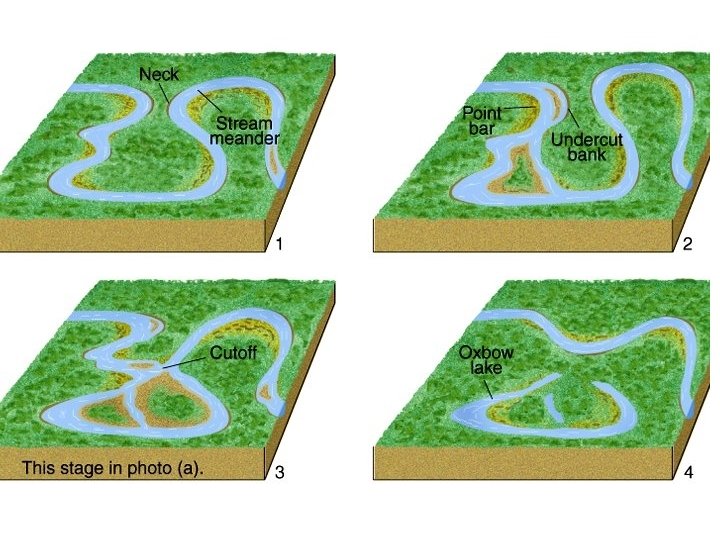
Physical Parameters Morphometry • The measurement of “shape” • I. e. How things change over a course
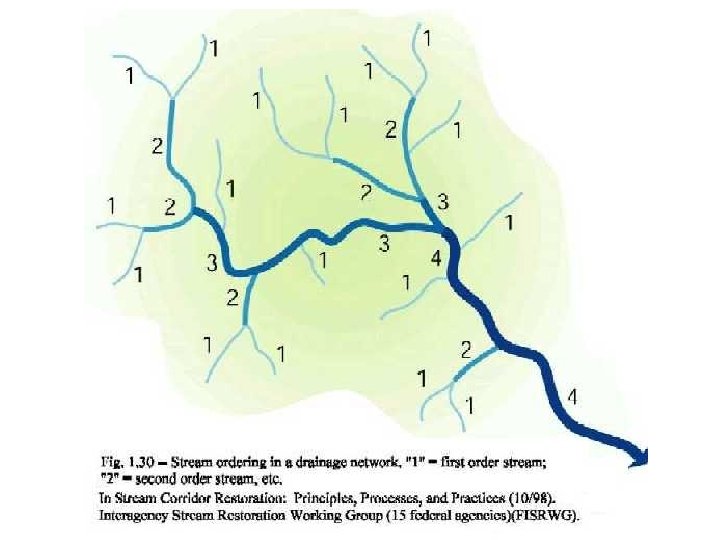
Stream Morphometry • Measurement of various stream attributes to discover stream properties
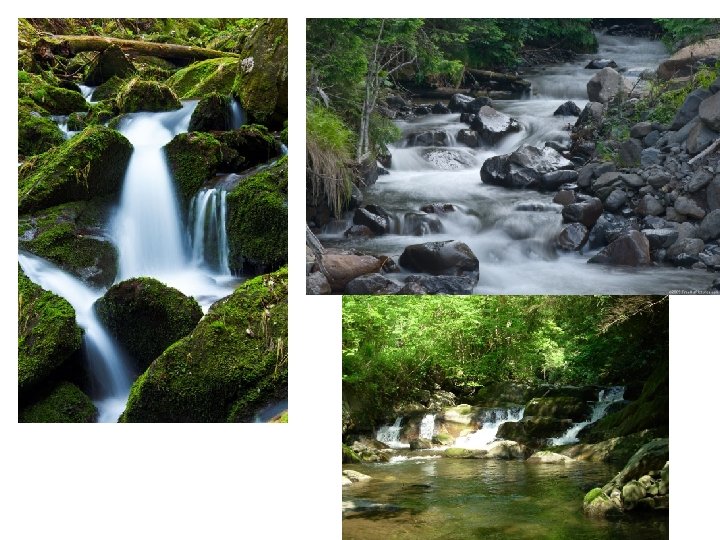
Mountain Streams • First-Order Streams • Smallest/ lowest volume • Steepest gradient • Fast Streams
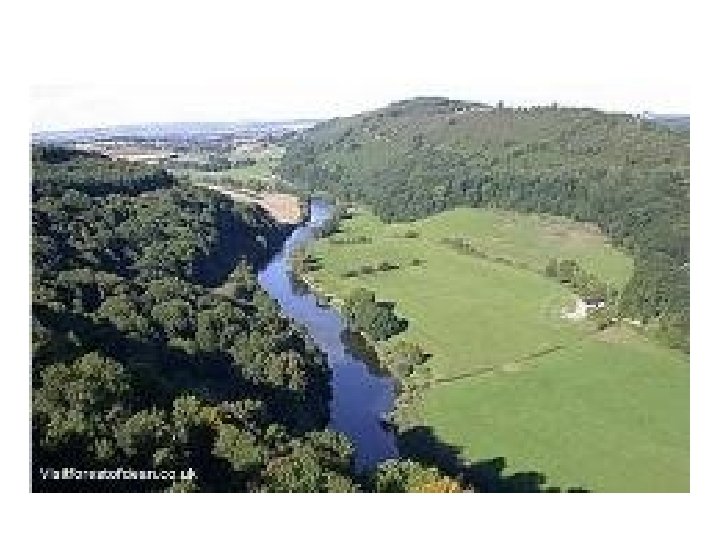
Streams in Flat Areas • Higher order streams • Larger/ Higher volume • Gradual gradient/ Flat • Slower velocity
Physical Tests Physical analysis of a stream is based on the following tests • Depth • Velocity • Volume of Flow/Stream Flow (discharge) • Temperature • Turbidity
Depth (m) Depth is needed to calculate Volume of Flow Calculation: • Measure the width of the stream profile • Measure the depth at 1 -meter intervals across the stream profile • Calculate the sum of all depth measurements • Divide the sum of depths by the number of measurements
Depth (m) A B C D E F G H I J K L M N O P Q R S TU VWXY A+B+C+D+E+F+G+H+I+J+K+L+M+N+O+P+Q+R+S+T+U+V+W+X+Y = Average Depth 25
Depth (m) *At most points in the Brandywine that we test, the depth will be less then 1 meter but the measurement should always be recorded in meters not centimeters
Velocity depends on: • Distance from shoreline • Depth of Water • Composition of Benthic Environment • (Smooth v Rough)
Velocity (m/sec) Velocity is a measure of how fast the stream water is moving
Velocity (m/sec) Calculation • Measure the width of the stream profile • Divide the width by 5 – you will take measurements at 4 points (not on the very edge of the stream) • Velocity is measured by timing the movement of a tennis ball over 1 meter • Record three sets of times for each point across the river and take the average • Calculate the sum of the 4 averages and divide by 4 to get an overall average velocity
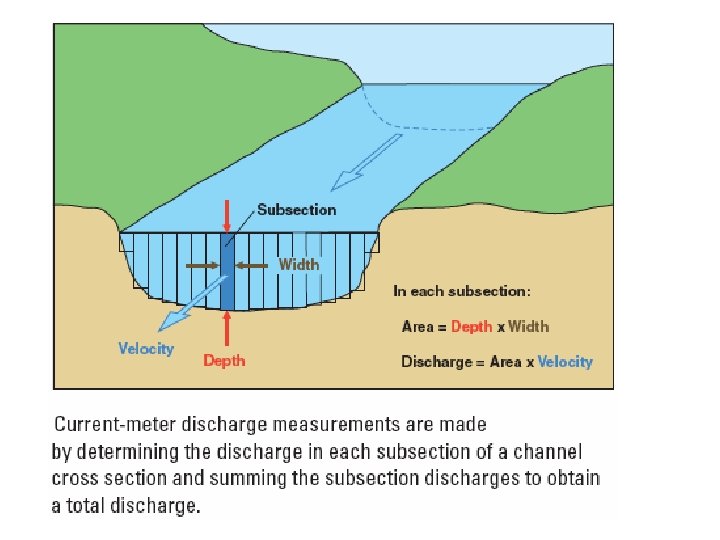
Volume of Flow/Stream Flow (m 3/sec) The volume of water that moves past a fixed point in a specific interval of time Stream flow or volume of flow is an important indicator of water quality. • Affects the available oxygen level in water that fish and other aquatic wildlife depend on to live. – Streams with higher flows have more oxygen available for aquatic wildlife.
Volume of Flow/Stream Flow • Controls the amount of sediment that is transported in a stream. • Determines how pollution is transported and influences the ability of a stream to dilute pollution. – Large, swift rivers have a greater ability to dilute and degrade runoff pollutants, unlike smaller streams.
Volume of Flow/Stream Flow Calculation: • (width) x (average depth) x (average velocity) x (bottom constant)
Volume of Flow/Stream Flow Bottom Constant = • 0. 8 if bottom is rough: rocks and course gravel
Volume of Flow/Stream Flow Bottom Constant = • 0. 9 if bottom is smooth: mud, sand, or bedrock
Water Temperature (°C) Temperature of the water directly affects biological and chemical processes. • Lower Temperature More Dissolved Gases (DO) Determines the type and location of organisms • Some fish species prefer colder waters than other species. • Bottom dwelling organisms will move in the stream in order to find their optimal temperature.
Water Temperature (°C) Calculation: • Temperature is measured at 4 points throughout the stream profile • Divide the sum of the measurements by 4 to get the average
Turbidity • Turbidity is a measure of water clarity. • Insoluble solids or suspended particles such as clay, silt, sand, algae, plankton and other substances affect the clarity of the water. • Water temperature is increased because suspended particles absorb more heat. • When turbidity is high, photosynthesis is reduced due to the decrease in the amount of light traveling through the water.
Turbidity Sources of turbidity include • soil erosion • waste discharge • urban runoff • eroding stream banks • large numbers of bottom feeders that stir up sediments • excessive algal growth
Turbidity • Measured using a Turbidity Tube • Unpolluted Streams: >53. 4 cm