Valgrind 1050 sudo apt install valgrind sudo yum


 char *p =(char *)")
 2002 -2012, and GNU")

 points to")

 • 日志输出的几种错误的分析")


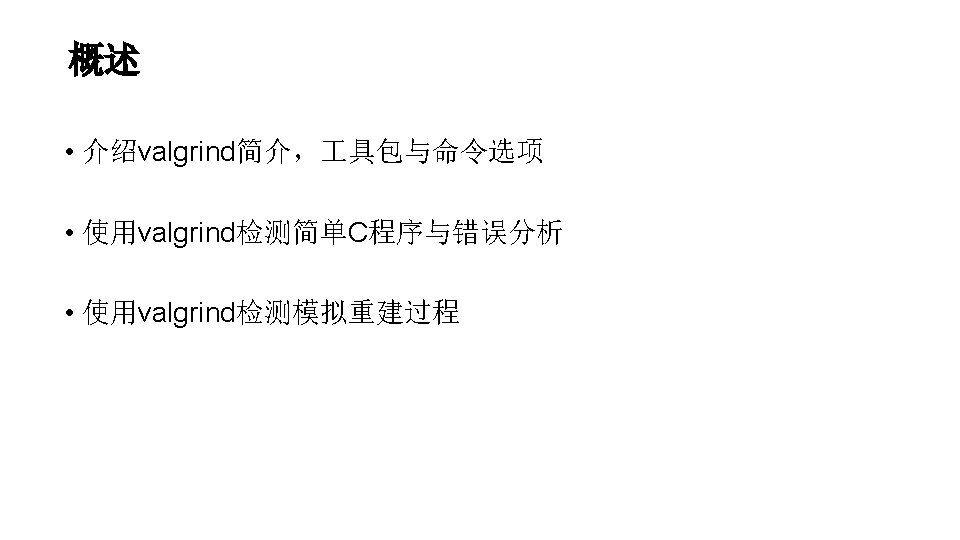
![异常释放 int main(int argc, char *argv[]) { char* big. Buff = (char*)malloc(1024); char* offset.](https://slidetodoc.com/presentation_image_h2/66e1260a854b1ef5e9fb67116cfc0f44/image-18.jpg "异常释放 int main(int argc, char *argv[]) { char* big. Buff = (char*)malloc(1024); char* offset.")
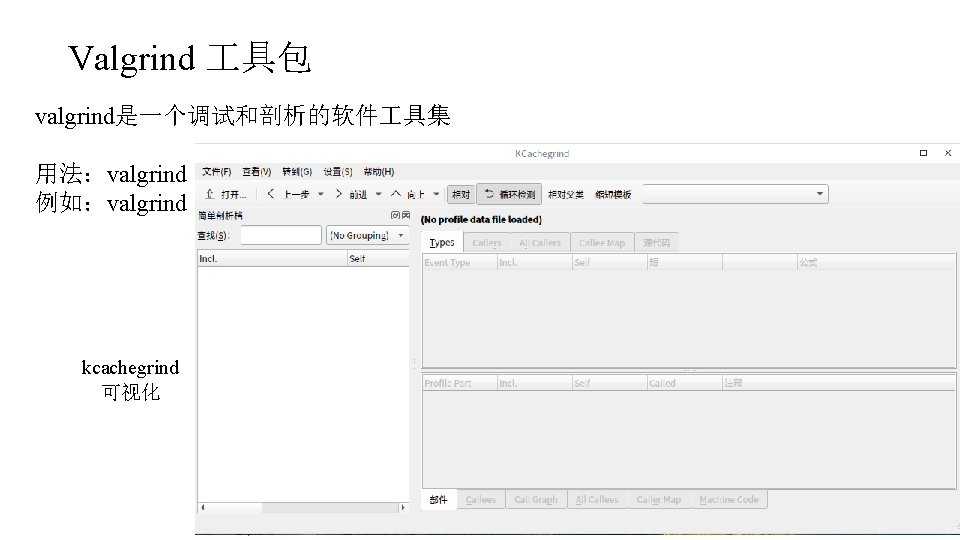
![非法读写 int main(int argc, char *argv[]) { char* big. Buff = (char*)malloc(1024); uint 64_t*](https://slidetodoc.com/presentation_image_h2/66e1260a854b1ef5e9fb67116cfc0f44/image-19.jpg "非法读写 int main(int argc, char *argv[]) { char* big. Buff = (char*)malloc(1024); uint 64_t*")
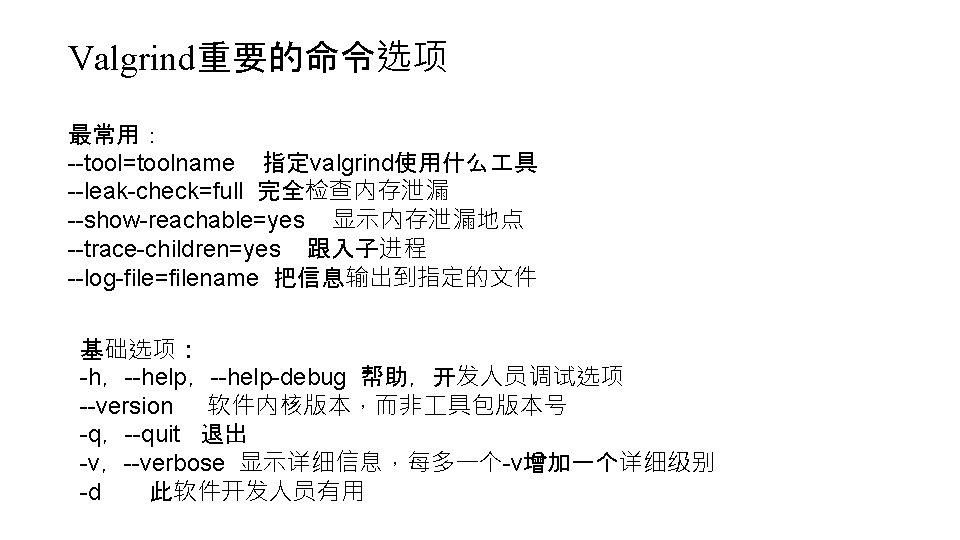
![不匹配的释放 int main(int argc, char *argv[]) { int unused; char* big. Buff = (char*)malloc(1024);](https://slidetodoc.com/presentation_image_h2/66e1260a854b1ef5e9fb67116cfc0f44/image-20.jpg "不匹配的释放 int main(int argc, char *argv[]) { int unused; char* big. Buff = (char*)malloc(1024);")
 { int i; if(i ==")

")
- Slides: 23
Valgrind简介 自由软件:内存调试、内存泄漏检测以及性能分析 未知行为 检测,函数和内存分析, 数据竞争条件侦测, 内存泄露检查 具 速度拖慢 10~50倍 $ sudo apt install valgrind $ sudo yum install valgrind https: //blog. csdn. net/zerokkqq/article/details/79742060 内 核
Valgrind测试简单C程序 #include <stdio. h> #include <stdlib. h> int { main() char *p =(char *) malloc(8); sprintf(p, "%s", "test"); fprintf(stderr, "p: %sn", p); return 0; } $ gcc –g malloc. c $ ls a. out malloc. c $ valgrind --leak-check=full --show-reachable=yes --trace-children=yes . /a. out
valgrind错误分析 ==19468== Memcheck, a memory error detector ==19468== Copyright (C) 2002 -2012, and GNU GPL'd, by Julian Seward et al. 1. copyright 版权声明 ==19468== Using Valgrind-3. 8. 1 and Lib. VEX; rerun with -h for copyright info 2. 异常读写报告 ==19468== Command: . /a. out 2. 1 主线程异常读写 ==19468== 2. 2 线程A异常读写报告 程序返回值 p: test 2. 3 线程B异常读写报告 ==19468== 2. . . 其他线程 ==19468== HEAP SUMMARY: 3. 堆内存泄露报告 ==19468== in use at exit: 8 bytes in 1 blocks 3. 1 堆内存使用情况概述(HEAP SUMMARY) ==19468== total heap usage: 1 allocs, 0 frees, 8 bytes allocated ==19468== 3. 2 确信的内存泄露报告(definitely lost) ==19468== 8 bytes in 1 blocks are definitely lost in loss record 1 of 1 3. 3 可疑内存操作报告 (show-reachable=no关闭 ==19468== at 0 x 4 A 07 A 2 E: malloc (vg_replace_malloc. c: 270) ==19468== by 0 x 400545: main (malloc. c: 6) ==19468== {问题描述} ==19468== LEAK SUMMARY: (LEAK SUMMARY) 泄露情况概 at {地址、函数名、模块或代码行} ==19468== definitely lost: 8 bytes 述 in 1 blocks ==19468== indirectly lost: 0 bytes in 0 blocks by {地址、函数名、代码行} ==19468== possibly lost: 0 bytes in 0 blocks by. . . {逐层依次显示调用堆栈} ==19468== still reachable: 0 bytes in 0 blocks Address 0 x 1234567 {描述地址的相对关系 ==19468== suppressed: 0 bytes in 0 blocks ==19468== For counts of detected and suppressed errors, rerun with: -v https: //blog. csdn. net/jinzeyu_cn/article/details/45969877 ==19468== ERROR SUMMARY: 1 errors from 1 contexts (suppressed: 8 from 6)
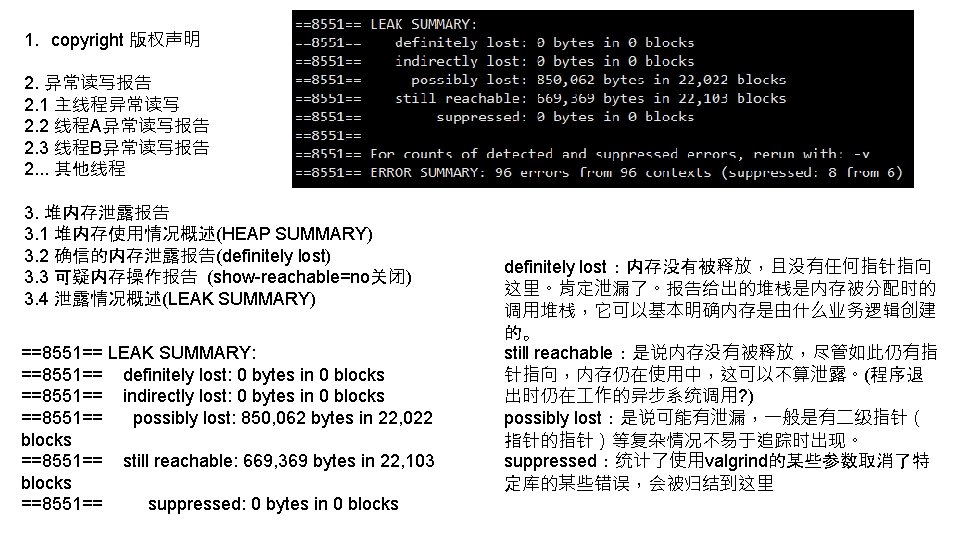
valgrind错误分析 ==8551== LEAK SUMMARY: ==8551== definitely lost: 0 bytes in 0 blocks ==8551== indirectly lost: 0 bytes in 0 blocks ==8551== possibly lost: 850, 062 bytes in 22, 022 blocks ==8551== still reachable: 669, 369 bytes in 22, 103 blocks ==8551== suppressed: 0 bytes in 0 blocks ==8551== For counts of detected and suppressed errors, rerun with: -v ==8551== ERROR SUMMARY: 96 errors from 96 contexts (suppressed: 8 from 6) 1)definitely lost: 肯定泄漏,内存没有被释放,且没有指针指向这里。 2) indirectly lost: 间接泄漏,指向该内存的指针都位于内存泄露处,只需修复“definitely lost”。 3) possibly lost: 可能泄漏,指针不是指向内存块头部、指针与该内存无关或二级指针。 4) still reachable: 程序运行完,仍旧有指针指向某内存,内存仍在使用中。 5) suppressed: 已被解决或者被忽略。 https: //blog. csdn. net/lou. Obaichu/article/details/45507365
valgrind错误分析 Conditional jump or move depends on uninitialised value syscall param write(buf) points to uninitilaised bytes 非法读写,跨界访问 使用未初始化的值 在系统调用中使用 未初始化或不可寻址的值 非法释放 使用不当的释放函数 释放堆块 重叠源和目标块 内存重叠 invalid free() Mismatched free()/delete[] invalid read of size 4 source and destination overlap in memcpy()
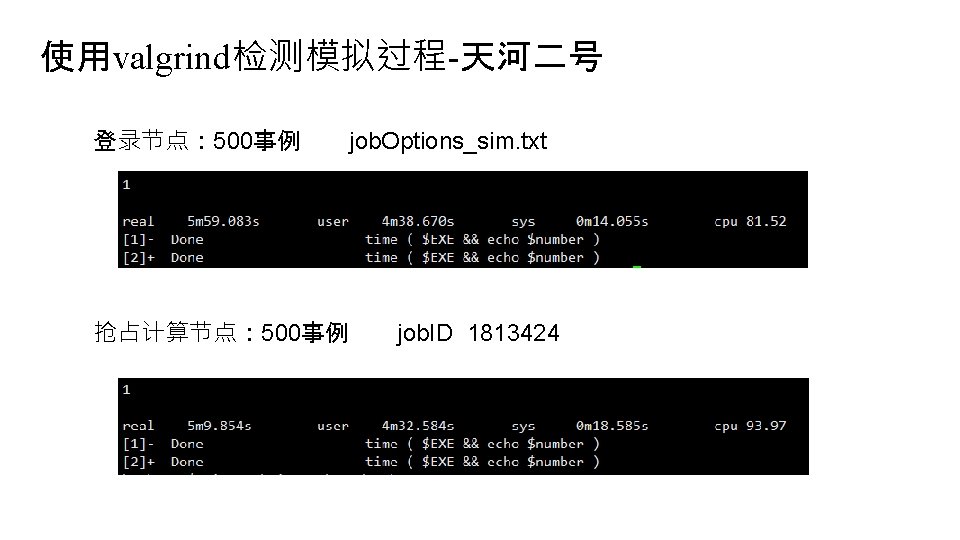
使用valgrind检测模拟过程-ihep 命令:valgrind --leak-check=full --show-reachable=yes --trace-children=yes --log-file=vallog boss. exe job. Options_sim. txt 模拟 500个事例� ,登录节点: 普通模拟: 3 : 34. 6 检测模拟: 32 : 29. 2 不使用 具 9倍 memchec k 日志vallog: 1, 159, 108行 � /afs/ihep. ac. cn/users/z/zhaoww/workarea/Test. Release-00 -00 -
总结 • valgrind 具包和基本命令 (valgrind --leak-check=full --show-reachable=yes --trace-children=yes --log-file=log program options ) • 日志输出的几种错误的分析 • 使用valgrind测试模拟重建过程 • 在天河二号运行模拟与重建,对比ihep上的运行时间
谢谢 赵问问 zhaoww 2013@126. com 2019年 6月20日 周四 下午
Backup
异常释放 int main(int argc, char *argv[]) { char* big. Buff = (char*)malloc(1024); char* offset. Buff = big. Buff + 888; free(offset. Buff); } Invalid free() / delete[] / realloc() at 0 x 402 B 06 C: free (in /usr/lib/valgrind/vgpreload_memcheck-x 86 -linux. so) by 0 x 8048461: main (main. cpp: 24) Address 0 x 41 f 23 a 0 is 888 bytes inside a block of size 1, 024 alloc’d at 0 x 402 BE 68: malloc (in /usr/lib/valgrind/vgpreload_memcheck-x 86 -linux. so) by 0 x 8048444: main (main. cpp: 17) free() / delete[] / realloc() 四种中的任一种,这里是free的非法释放。在描述地址的相对关系时,使用 了一个句子,句子的格式是:Address 0 x? ? ? ? is {x} bytes {inside/before/after} a block of size {y} {alloc’d/free’d} 它表示了释放的地址与一个y长度块的相对位置关系。如果地址位于块前,则用before,位于块内则用inside, 块后则是after。而最后的alloc’d代表这个y长度的块处于有效状态,其分配时的栈如下;而free’d代表y长度块已 删除,其删除时的栈如下。 所以上面的报告可以解释为:地址0 x 41 f 23 a 0位于一个长度 1024的有效块内+888处,其分配时的调用堆栈如下。
非法读写 int main(int argc, char *argv[]) { char* big. Buff = (char*)malloc(1024); uint 64_t* big. Num = (uint 64_t*)(big. Buff+1020); *big. Num = 0 x 12345678 AABBCCDD; printf("big. Num is %llun", *big. Num); free(big. Buff); } Invalid write of size 4 at 0 x 8048490: main (main. cpp: 19) Address 0 x 41 f 2428 is 0 bytes after a block of size 1, 024 allo at 0 x 402 BE 68: malloc (in /usr/lib/valgrind/vgpreload_memc by 0 x 8048474: main (main. cpp: 17) Invalid read of size 4 at 0 x 804849 B: main (main. cpp: 20) Address 0 x 41 f 2428 is 0 bytes after a block of size 1, 024 allo at 0 x 402 BE 68: malloc (in /usr/lib/valgrind/vgpreload_memc by 0 x 8048474: main (main. cpp: 17) 对一个内存区的使用超过了分配的大小时,可以触发Invalid write/read,同时被告知长度。本例中 uint 64_t有8字节长,访问超出了4字节。如果将big. Buff+1020改成big. Buff-20,那么报告中会准确的告 诉你Address xxx is 20 bytes before a block of … 另外一个有趣的现象是,我发现对uint 64_t的非法访问会产生 2次 4字节长度非法访问的报告,这说明 了什么?
不匹配的释放 int main(int argc, char *argv[]) { int unused; char* big. Buff = (char*)malloc(1024); delete[] big. Buff; printf("unused=%d", unused); } //gcc过不了 #include <stdio. h> #include <string. h> int main() { int i; if(i == 0) { printf("[%d]n", i); } return 0; } //gcc可以过 Mismatched free() / delete [] at 0 x 402 A 8 DC: operator delete[](void*) (in /usr/lib/valgrind/vgprelo linux. so) by 0 x 80484 FB: main (main. cpp: 19) Address 0 x 4323028 is 0 bytes inside a block of size 1, 024 alloc'd at 0 x 402 BE 68: malloc (in /usr/lib/valgrind/vgpreload_memcheck-x by 0 x 80484 E 4: main (main. cpp: 18) Use of uninitialised value of size 4 at 0 x 416 E 0 DB: _itoa_word (_itoa. c: 195) by 0 x 417221 A: vfprintf (vfprintf. c: 1629) by 0 x 4178 B 2 E: printf (printf. c: 35) by 0 x 41454 D 2: (below main) (libc-start. c: 226) 不管malloc分配后用delete还是delete[],又或者是new[] 之后粗心用delete释放,都会得到Mismatched free() / delete []报告,且报告主体内容基本一致。
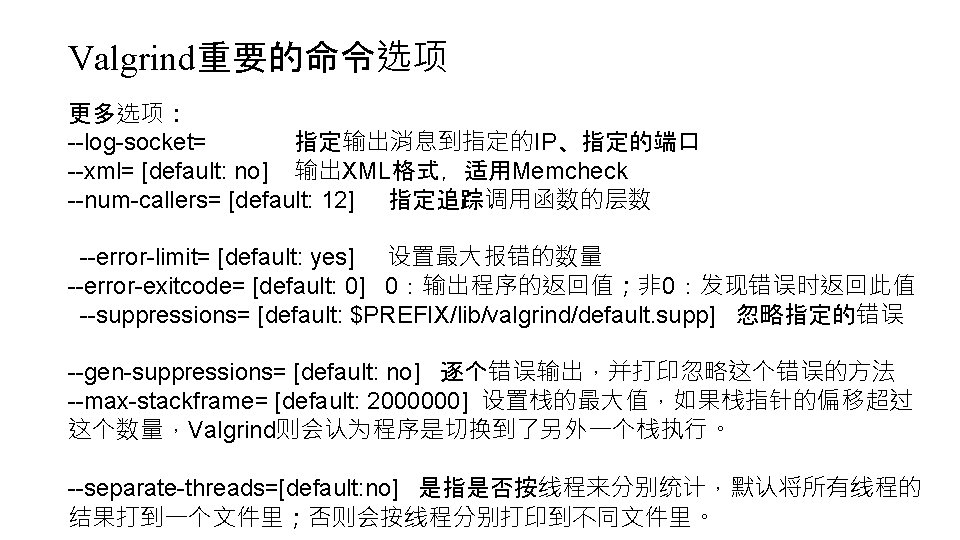
使用未初始的值 #include <stdio. h> #include <string. h> int main() { int i; if(i == 0) { printf("[%d]n", i); } return 0; } //gcc、g++可以过 Conditional jump or move depends on uninitialised value(s) ==14667== at 0 x 4004 B 0: main (uninitial. c: 7) ==14667== Use of uninitialised value of size 8 ==14667== at 0 x 317 B 24397 B: _itoa_word (in /lib 64/libc-2. 12. so) ==14667== by 0 x 317 B 246532: vfprintf (in /lib 64/libc-2. 12. so) ==14667== by 0 x 317 B 24 F 069: printf (in /lib 64/libc-2. 12. so) ==14667== by 0 x 4004 C 8: main (uninitial. c: 9) ==14667== Conditional jump or move depends on uninitialised value(s) ==14667== at 0 x 317 B 244 FC 3: vfprintf (in /lib 64/libc-2. 12. so) ==14667== by 0 x 317 B 24 F 069: printf (in /lib 64/libc-2. 12. so) ==14667== by 0 x 4004 C 8: main (uninitial. c: 9) 上例中int unused并未赋值即被使用,得到了Use of uninitialised value of size 4的报告, 这样的问题通常不致命,但是也需要排除。 可以观察到一个有趣情况,堆栈最后一层首次出现了 (below main),它表示代码位于main 函数以外被执行,也并非来自于线程,我还不能明确解释这种现象
静态构造和释放 class Global. Class Invalid write of size 4 at 0 x 804857 B: Global. Class: : Global. Class() (main. cpp: 21) by 0 x 804850 F: __static_initialization_and_destruction_0(int, int) (main. cpp: 3 by 0 x 8048551: _GLOBAL__sub_I_g_global. Class (main. cpp: 55) by 0 x 8048631: __libc_csu_init (in /home/jinzeyu/codelocal/build-mcsample. Desktop_Qt_5_3_GCC_32 bit-Debug/mcsample) by 0 x 4060469: (below main) (libc-start. c: 185) Address 0 x 41 f 2030 is 8 bytes inside a block of size 10 alloc'd at 0 x 402 BE 68: malloc (in /usr/lib/valgrind/vgpreload_memcheck-x 86 -linux. so by 0 x 8048571: Global. Class: : Global. Class() (main. cpp: 20) by 0 x 804850 F: __static_initialization_and_destruction_0(int, int) (main. cpp: 3 by 0 x 8048551: _GLOBAL__sub_I_g_global. Class (main. cpp: 55) by 0 x 8048631: __libc_csu_init (in /home/jinzeyu/codelocal/build-mcsample. Desktop_Qt_5_3_GCC_32 bit-Debug/mcsample) by 0 x 4060469: (below main) (libc-start. c: 185) { public: Global. Class() { char* buf = (char*)malloc(10); *(int*)(buf+8) = 100; free(buf); } ~Global. Class() { char* buf = (char*)malloc(10); *(int*)(buf+8) = 100; free(buf); Invalid write of size 4 静态类的构造和释放都在main之外,所以都出现了(below } at 0 x 80485 B 9: Global. Class: : ~Global. Class() (main. cpp: 27) main)的字样,堆栈的函数名也很好的证实了这两个过程。 void fake(){} by 0 x 4079 B 80: __run_exit_handlers (exit. c: 78) 这里我联想到了另一个问题,就是静态构造的顺序不一定 } g_global. Class; by 0 x 4079 C 0 C: exit (exit. c: 100) 按预期,强烈建议静态对象之间不要有依赖关系。 by 0 x 40604 DA: (below main) (libc-start. c: 258) int main(int argc, char *argv[]) Address 0 x 41 f 2070 is 8 bytes inside a block of size 10 alloc'd { at 0 x 402 BE 68: malloc (in /usr/lib/valgrind/vgpreload_memcheck-x 86 -linux. so g_global. Class. fake(); by 0 x 80485 AF: Global. Class: : ~Global. Class() (main. cpp: 26) }
Valgrind测试 bash : ls -l ==22583== Memcheck, a memory error detector ==22583== Copyright (C) 2002 -2012, and GNU GPL'd, by Julian Seward et al. ==22583== Using Valgrind-3. 8. 1 and Lib. VEX; rerun with -h for copyright info ==22583== Command: ls -l ==22583== total 20 -rwxr-xr-x 1 zhaoww physics 9125 Jun 16 23: 27 a. out -rw-r--r-- 1 zhaoww physics 187 Jun 16 23: 16 malloc. c -rw-r--r-- 1 zhaoww physics 130 Jun 15 19: 40 readme ==22583== HEAP SUMMARY: ==22583== in use at exit: 19, 453 bytes in 9 blocks ==22583== total heap usage: 208 allocs, 199 frees, 81, 854 bytes allocated ==22583== 22 bytes in 3 blocks are still reachable in loss record 1 of 7 ==22583== at 0 x 4 A 07 A 2 E: malloc (vg_replace_malloc. c: 270) ==22583== by 0 x 4118 D 8: ? ? ? (in /bin/ls) ==22583== by 0 x 41190 B: ? ? ? (in /bin/ls) ==22583== by 0 x 403 AFC: ? ? ? (in /bin/ls) ==22583== by 0 x 40817 E: ? ? ? (in /bin/ls) ==22583== by 0 x 408 B 2 C: ? ? ? (in /bin/ls) ==22583== by 0 x 313041 ED 1 F: (below main) (in /lib 64/libc-2. 12. so)