Using an Online Course to Support Instruction of
- Slides: 35
Using an Online Course to Support Instruction of Introductory Statistics CAUSE Webinar (8/14/2007) Oded Meyer Dept. of Statistics Carnegie Mellon University
Introduction n Educational Mission of Funder (The William and Flora Hewlett Foundation) Provide open access to high quality post-secondary education and educational materials to those who otherwise would be excluded due to: n n Geographical constraints Financial difficulties Social barriers To meet this goal: n n A complete stand-alone web-based introductory statistics course. openly and freely available to individual learners online.
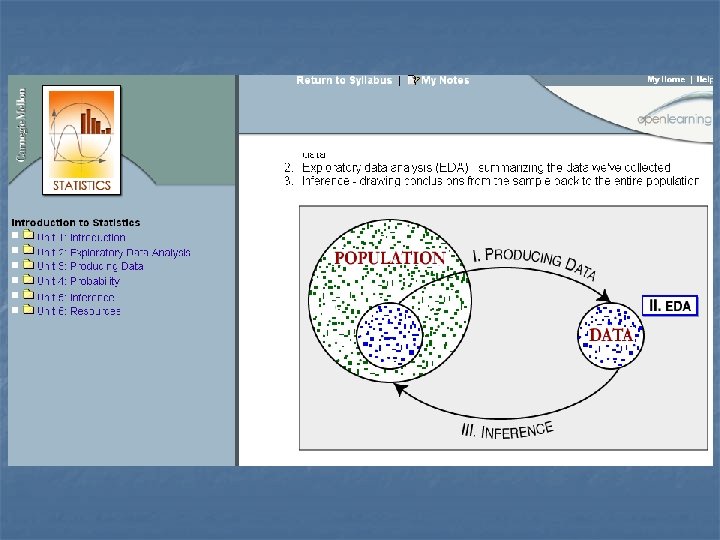
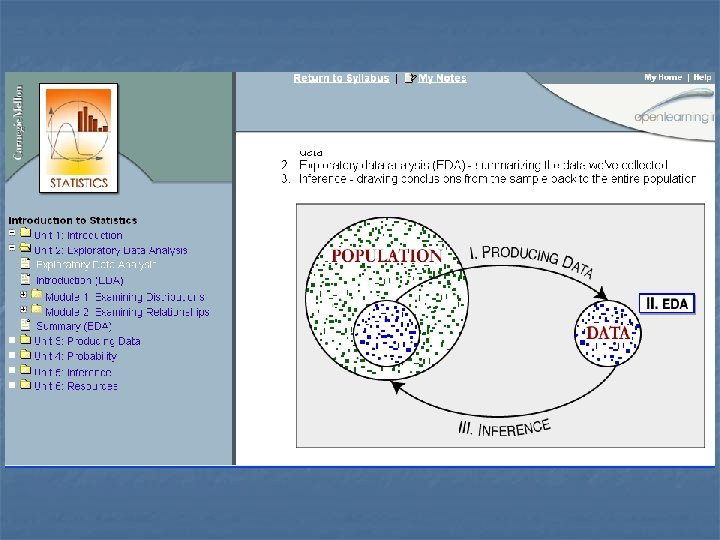
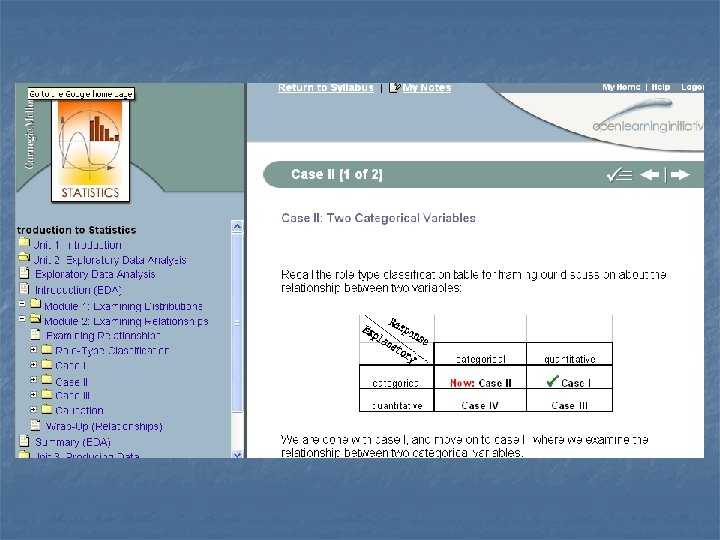
Moving Instruction Out of the Classroom: Challenges n Course Organization and Structure n n n Students often view what they learn as a set of isolated facts. Instructor promotes coherence, sets course path. Online course: high level of scaffolding in structure is needed. n n n Course is organized around the Big Picture. Rigid structure throughout material hierarchy. Smooth conceptual path.
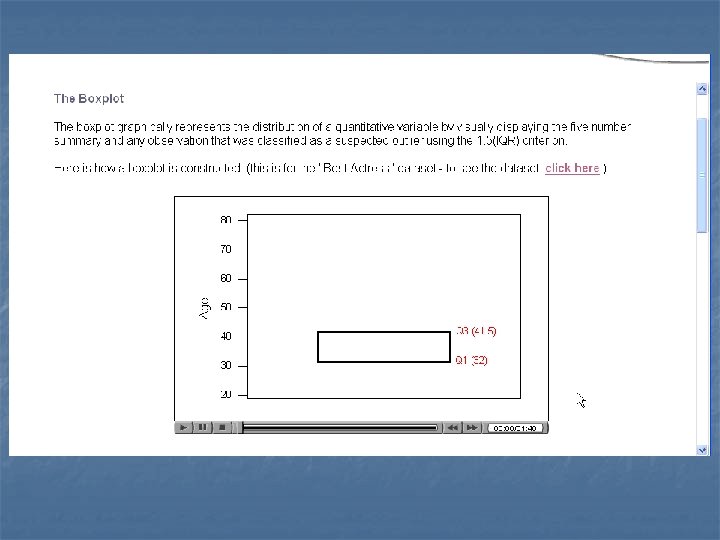
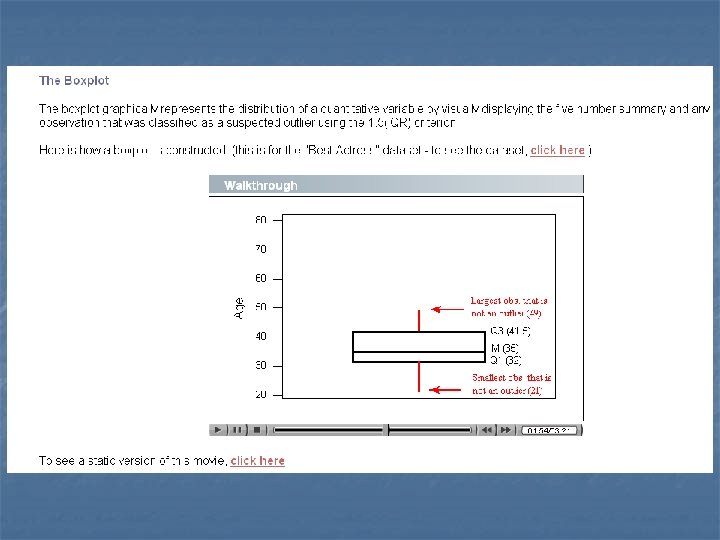
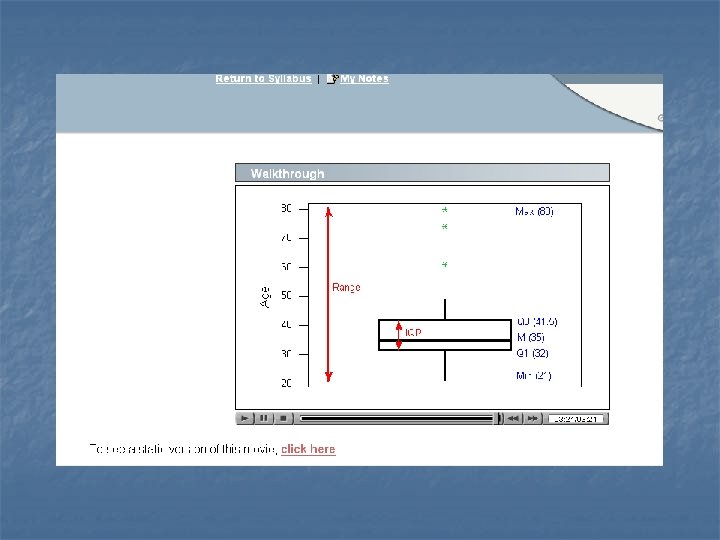
Challenges (cont. ) n Effective Use of Media Elements n n Course follows well researched principles to minimize cognitive load imposed by the learning design. For example… Best to reinforce information over auditory and visual channels simultaneously.
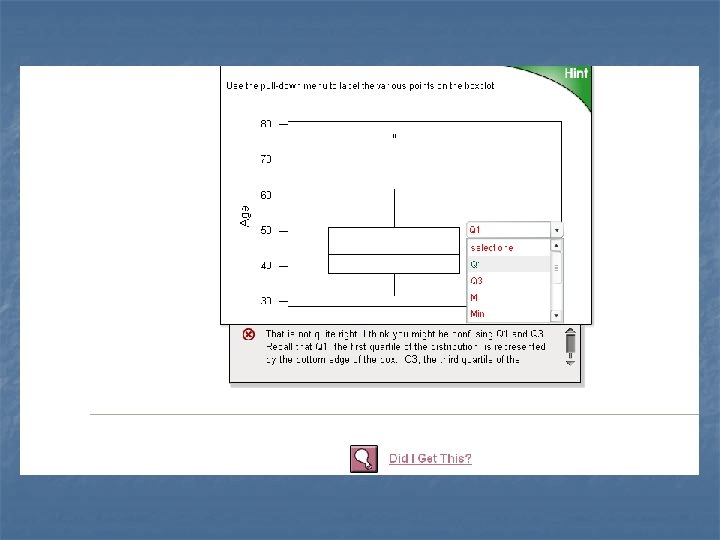
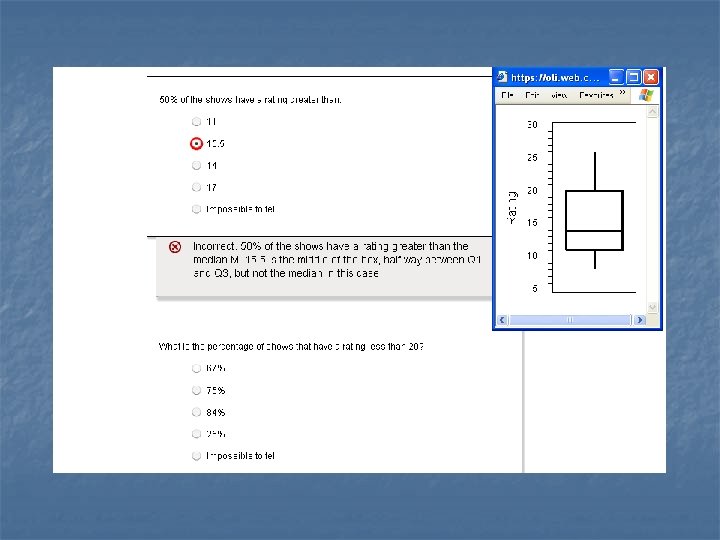
Challenges (cont. ) n Immediate and Targeted Feedback n n n Studies: immediate feedback students achieve desired level of performance faster. We needed to compensate for no immediate instructor – students feedback loops. Throughout the course immediate and tailored feedback is given. mini tutors embedded in the material. n self assessments activities (Did I get this? ) n
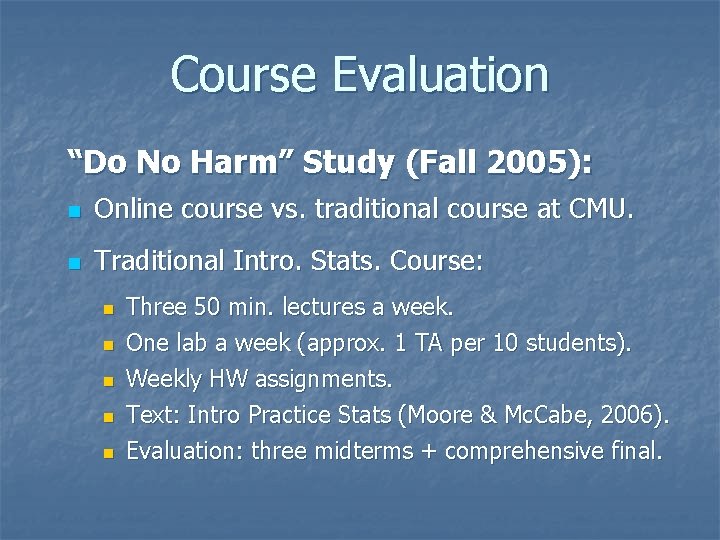
Course Evaluation “Do No Harm” Study (Fall 2005): n Online course vs. traditional course at CMU. n Traditional Intro. Stats. Course: n n n Three 50 min. lectures a week. One lab a week (approx. 1 TA per 10 students). Weekly HW assignments. Text: Intro Practice Stats (Moore & Mc. Cabe, 2006). Evaluation: three midterms + comprehensive final.
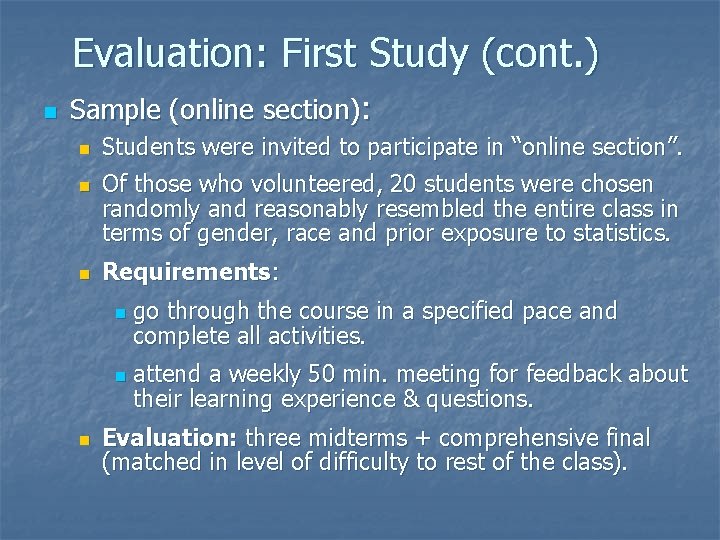
Evaluation: First Study (cont. ) n Sample (online section): n n n Students were invited to participate in “online section”. Of those who volunteered, 20 students were chosen randomly and reasonably resembled the entire class in terms of gender, race and prior exposure to statistics. Requirements: n n n go through the course in a specified pace and complete all activities. attend a weekly 50 min. meeting for feedback about their learning experience & questions. Evaluation: three midterms + comprehensive final (matched in level of difficulty to rest of the class).
Evaluation: First Study (cont. ) n Results: n n n All but 2 students followed schedule (with up to two days of delay). Three instances of clarifications (regression line, sampling distributions, p-value). Performance:
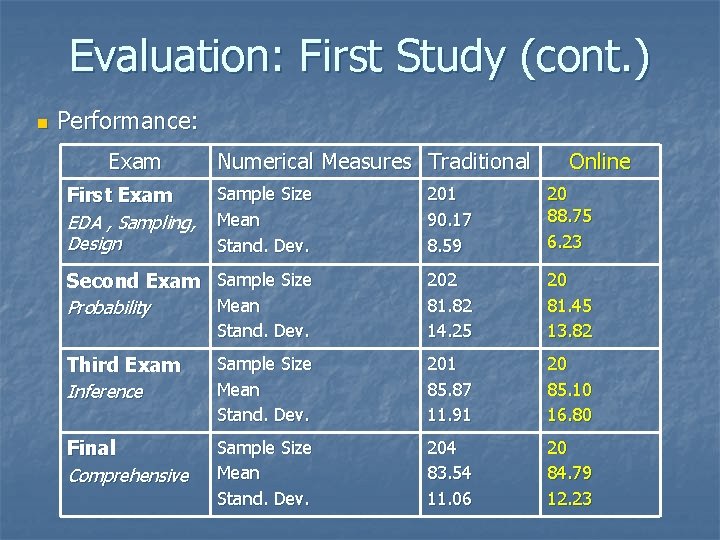
Evaluation: First Study (cont. ) n Performance: Exam First Exam EDA , Sampling, Design Numerical Measures Traditional Online Sample Size Mean Stand. Dev. 201 90. 17 8. 59 20 88. 75 6. 23 Second Exam Sample Size Mean Probability Stand. Dev. 202 81. 82 14. 25 20 81. 45 13. 82 Third Exam Inference Sample Size Mean Stand. Dev. 201 85. 87 11. 91 20 85. 10 16. 80 Final Comprehensive Sample Size Mean Stand. Dev. 204 83. 54 11. 06 20 84. 79 12. 23
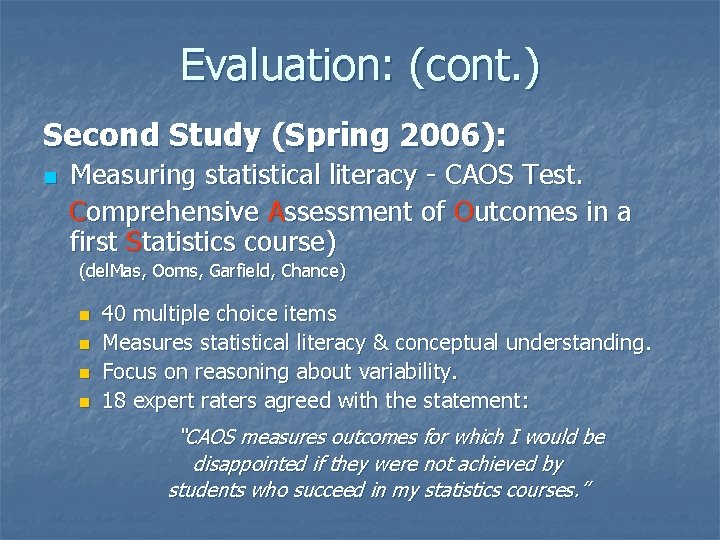
Evaluation: (cont. ) Second Study (Spring 2006): n Measuring statistical literacy - CAOS Test. Comprehensive Assessment of Outcomes in a first Statistics course) (del. Mas, Ooms, Garfield, Chance) n n 40 multiple choice items Measures statistical literacy & conceptual understanding. Focus on reasoning about variability. 18 expert raters agreed with the statement: “CAOS measures outcomes for which I would be disappointed if they were not achieved by students who succeed in my statistics courses. ”
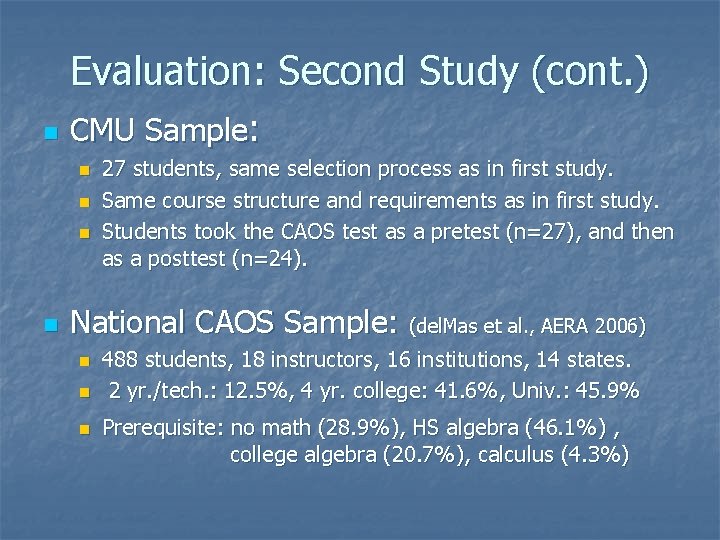
Evaluation: Second Study (cont. ) n CMU Sample: n n 27 students, same selection process as in first study. Same course structure and requirements as in first study. Students took the CAOS test as a pretest (n=27), and then as a posttest (n=24). National CAOS Sample: (del. Mas et al. , AERA 2006) n n n 488 students, 18 instructors, 16 institutions, 14 states. 2 yr. /tech. : 12. 5%, 4 yr. college: 41. 6%, Univ. : 45. 9% Prerequisite: no math (28. 9%), HS algebra (46. 1%) , college algebra (20. 7%), calculus (4. 3%)
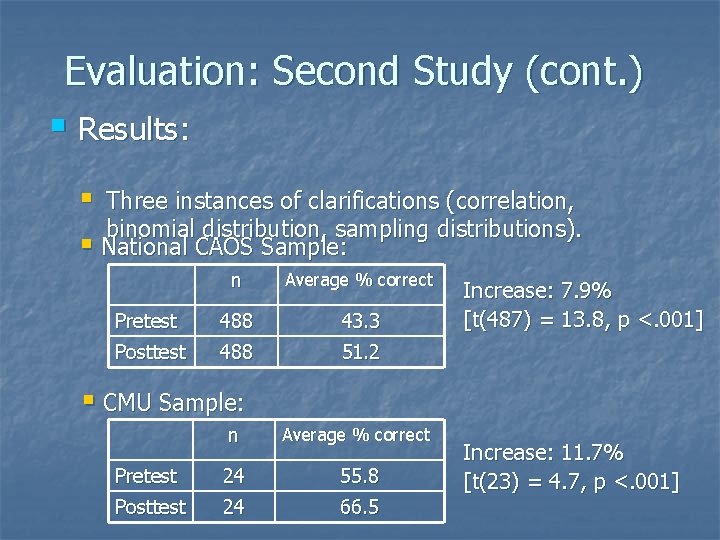
Evaluation: Second Study (cont. ) § Results: § Three instances of clarifications (correlation, binomial distribution, sampling distributions). § National CAOS Sample: n Average % correct Pretest 488 43. 3 Posttest 488 51. 2 Increase: 7. 9% [t(487) = 13. 8, p <. 001] § CMU Sample: n Average % correct Pretest 24 55. 8 Posttest 24 66. 5 Increase: 11. 7% [t(23) = 4. 7, p <. 001]
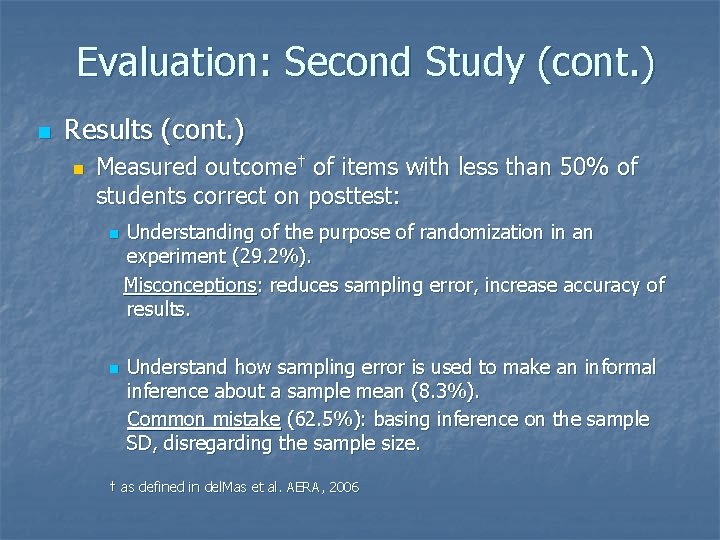
Evaluation: Second Study (cont. ) n Results (cont. ) n Measured outcome† of items with less than 50% of students correct on posttest: n n Understanding of the purpose of randomization in an experiment (29. 2%). Misconceptions: reduces sampling error, increase accuracy of results. Understand how sampling error is used to make an informal inference about a sample mean (8. 3%). Common mistake (62. 5%): basing inference on the sample SD, disregarding the sample size. † as defined in del. Mas et al. AERA, 2006
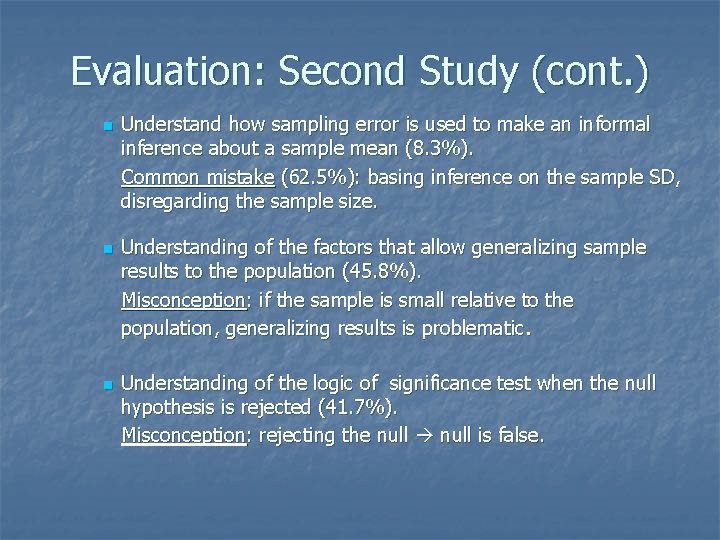
Evaluation: Second Study (cont. ) n n n Understand how sampling error is used to make an informal inference about a sample mean (8. 3%). Common mistake (62. 5%): basing inference on the sample SD, disregarding the sample size. Understanding of the factors that allow generalizing sample results to the population (45. 8%). Misconception: if the sample is small relative to the population, generalizing results is problematic. Understanding of the logic of significance test when the null hypothesis is rejected (41. 7%). Misconception: rejecting the null is false.
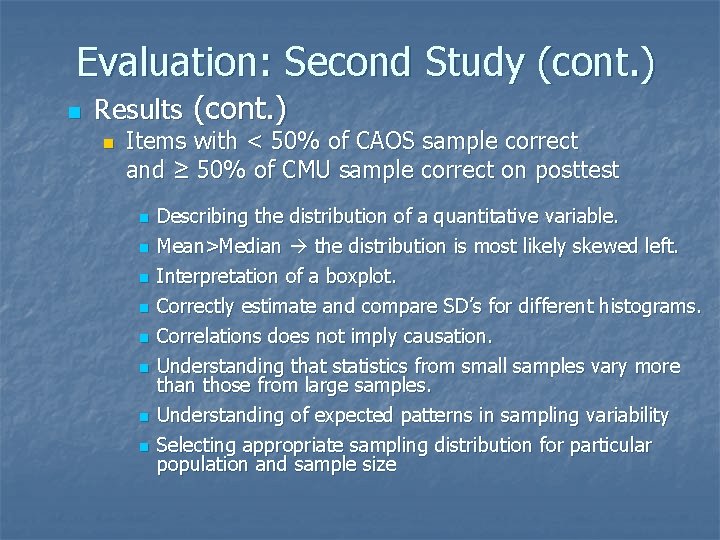
Evaluation: Second Study (cont. ) n Results (cont. ) n Items with < 50% of CAOS sample correct and ≥ 50% of CMU sample correct on posttest n n n n Describing the distribution of a quantitative variable. Mean>Median the distribution is most likely skewed left. Interpretation of a boxplot. Correctly estimate and compare SD’s for different histograms. Correlations does not imply causation. Understanding that statistics from small samples vary more than those from large samples. Understanding of expected patterns in sampling variability Selecting appropriate sampling distribution for particular population and sample size
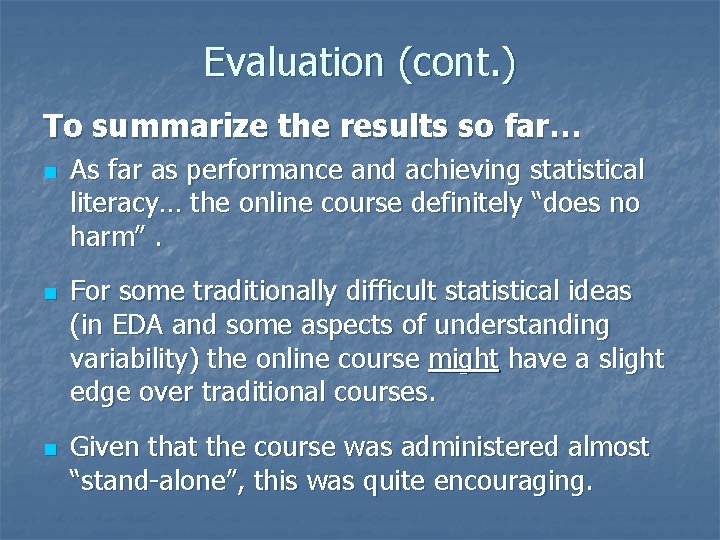
Evaluation (cont. ) To summarize the results so far… n n n As far as performance and achieving statistical literacy… the online course definitely “does no harm”. For some traditionally difficult statistical ideas (in EDA and some aspects of understanding variability) the online course might have a slight edge over traditional courses. Given that the course was administered almost “stand-alone”, this was quite encouraging.
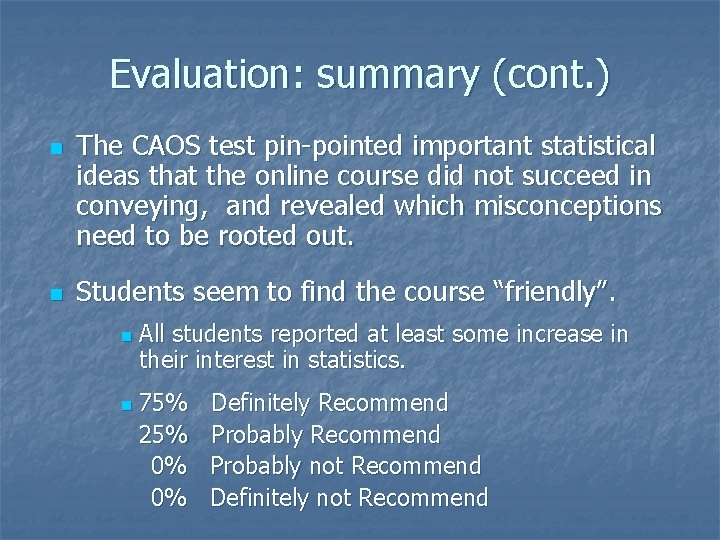
Evaluation: summary (cont. ) n n The CAOS test pin-pointed important statistical ideas that the online course did not succeed in conveying, and revealed which misconceptions need to be rooted out. Students seem to find the course “friendly”. n n All students reported at least some increase in their interest in statistics. 75% 25% 0% 0% Definitely Recommend Probably not Recommend Definitely not Recommend
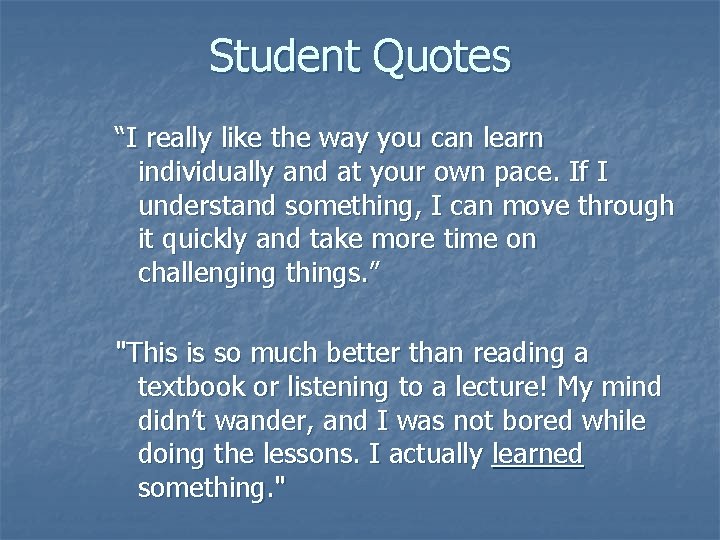
Student Quotes “I really like the way you can learn individually and at your own pace. If I understand something, I can move through it quickly and take more time on challenging things. ” "This is so much better than reading a textbook or listening to a lecture! My mind didn’t wander, and I was not bored while doing the lessons. I actually learned something. "
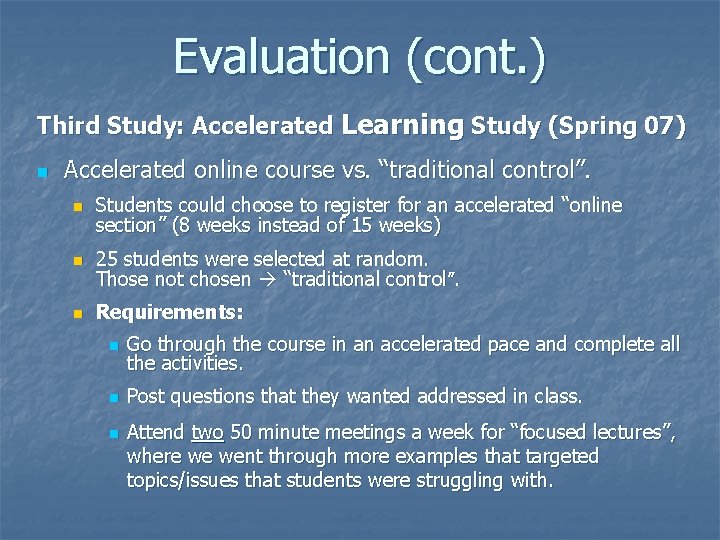
Evaluation (cont. ) Third Study: Accelerated Learning Study (Spring 07) n Accelerated online course vs. “traditional control”. n n n Students could choose to register for an accelerated “online section” (8 weeks instead of 15 weeks) 25 students were selected at random. Those not chosen “traditional control”. Requirements: n Go through the course in an accelerated pace and complete all the activities. n Post questions that they wanted addressed in class. n Attend two 50 minute meetings a week for “focused lectures”, where we went through more examples that targeted topics/issues that students were struggling with.
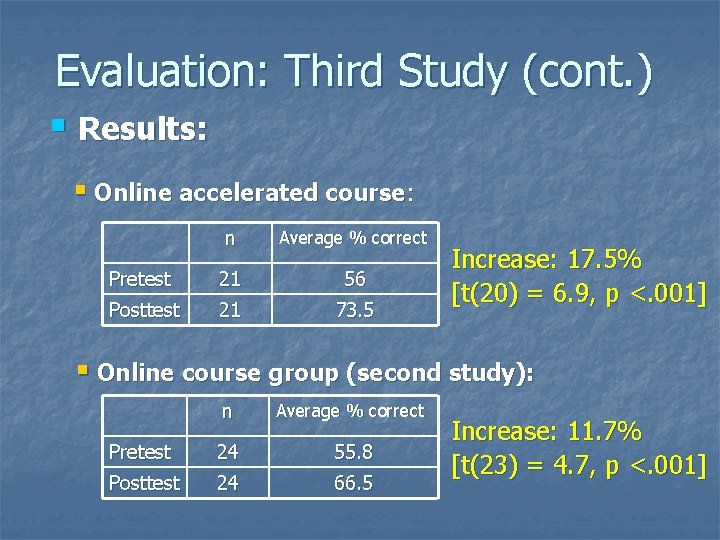
Evaluation: Third Study (cont. ) § Results: § Online accelerated course: n Average % correct Pretest 21 56 Posttest 21 73. 5 Increase: 17. 5% [t(20) = 6. 9, p <. 001] § Online course group (second study): n Average % correct Pretest 24 55. 8 Posttest 24 66. 5 Increase: 11. 7% [t(23) = 4. 7, p <. 001]
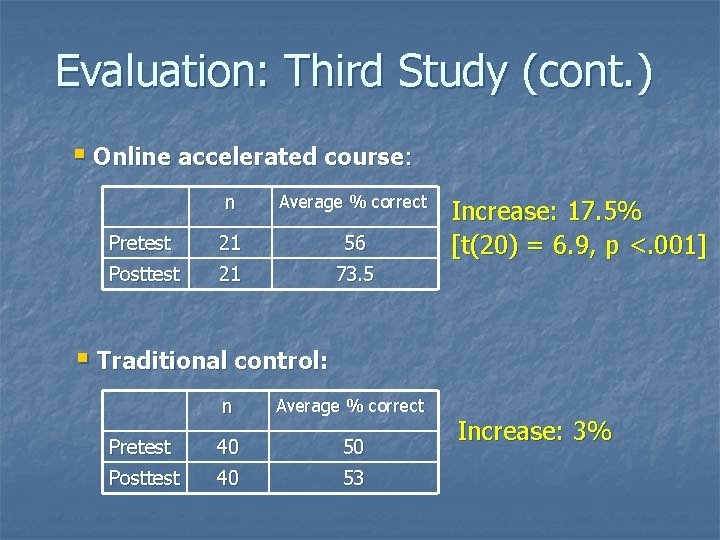
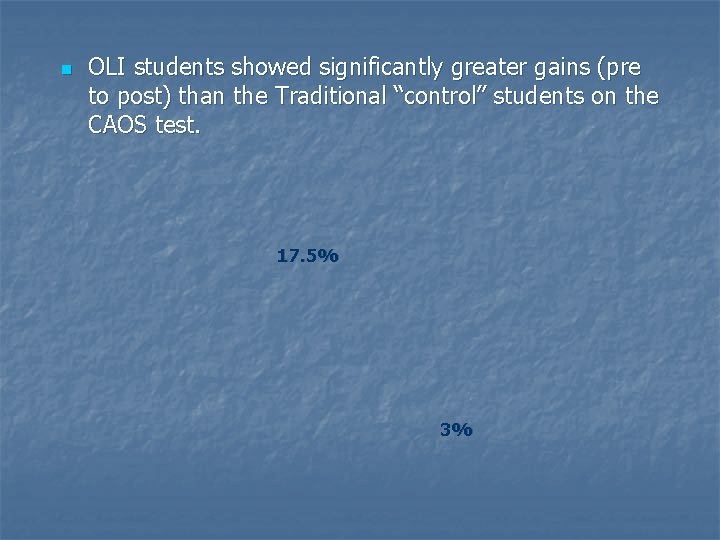
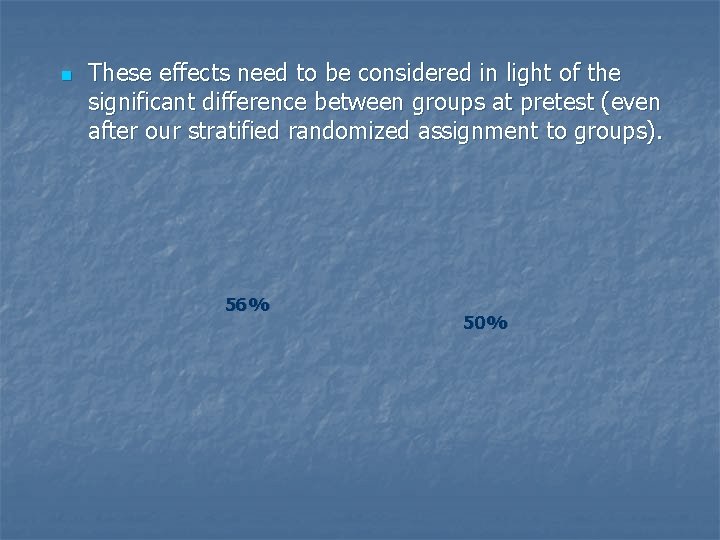
Evaluation: Third Study (cont. ) § Online accelerated course: n Average % correct Pretest 21 56 Posttest 21 73. 5 Increase: 17. 5% [t(20) = 6. 9, p <. 001] § Traditional control: n Average % correct Pretest 40 50 Posttest 40 53 Increase: 3%
n OLI students showed significantly greater gains (pre to post) than the Traditional “control” students on the CAOS test. 17. 5% 3%
n These effects need to be considered in light of the significant difference between groups at pretest (even after our stratified randomized assignment to groups). 56% 50%
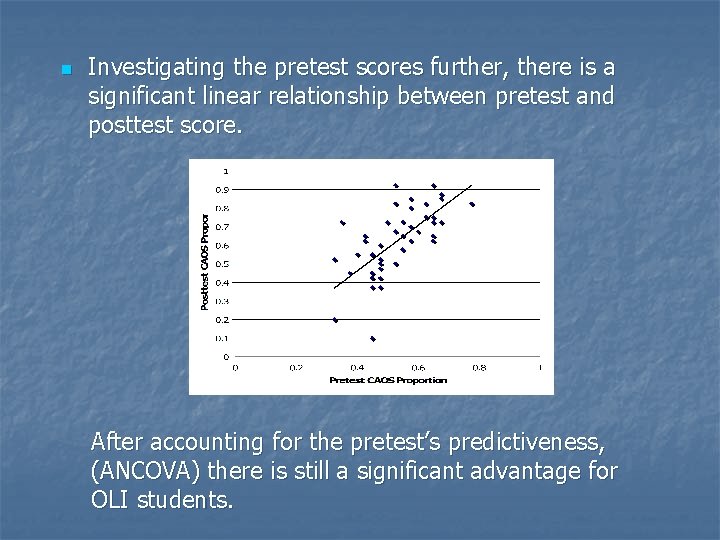
n Investigating the pretest scores further, there is a significant linear relationship between pretest and posttest score. After accounting for the pretest’s predictiveness, (ANCOVA) there is still a significant advantage for OLI students.
Summary of third study & final thoughts: § The online students gained much more (on the CAOS test) than did the “traditional controls”. § This is noteworthy given that the OLI students had half a semester to cover a semester’s worth of material. § I believe that the gain in the third study (course + focused lectures format) was better than the gain in the second study (stand-alone format) because the course was developed as a standalone course (how ironic…)
n n An issue that needs to be examined is the effect of the accelerated learning on retention (a follow -up study is planned in down-stream courses). The format of the third study was among the best teaching experiences I’ve had in my 15 years of teaching statistics. I strongly believe (and hope, maybe…) that no online course will ever be able to replace an enthusiastic and engaging teacher. However… Having the students engage with material on their own using an online course supplemented by focused lectures is a “winning combination”.
Contact Information: n n Oded Meyer meyer@stat. cmu. edu To access the course: go to: www. cmu. edu/oli/ and follow the link to the statistics course.