
USING ASSESSMENT DATA TO DRIVE INSTRUCTION 1 WE
- Slides: 59
USING ASSESSMENT DATA TO DRIVE INSTRUCTION 1
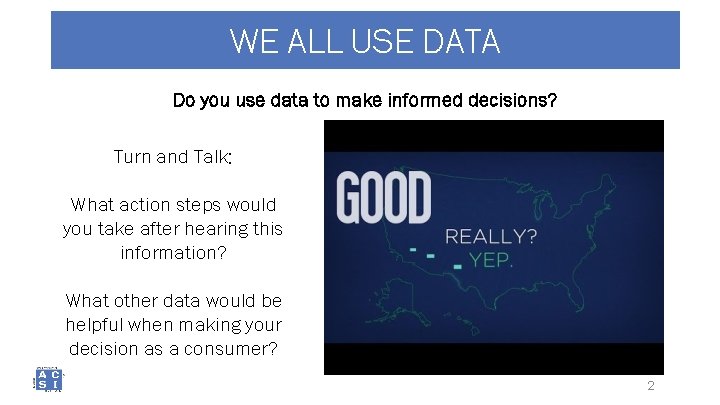
WE ALL USE DATA Do you use data to make informed decisions? Turn and Talk: What action steps would you take after hearing this information? What other data would be helpful when making your decision as a consumer? 2
ACHIEVEMENT COACH PROGRAM • This session is part of the New Jersey Achievement Coach Program. • Achievement Coaches are educators selected by their districts as leaders who share their knowledge of teaching and learning with their peers. • The three sessions led by Achievement Coaches were developed by New Jersey's educators to address specific needs. 3
NORMS Active Listening and Learning Listen hard, speak softly Take ownership over your learning Be solution-oriented Think about how this looks in your classroom or school Parking Lot Please write any outstanding questions you have on the “Parking Lot” in the back of the room Cell Phones Please keep phones on silent and take emergency calls/texts outside 4
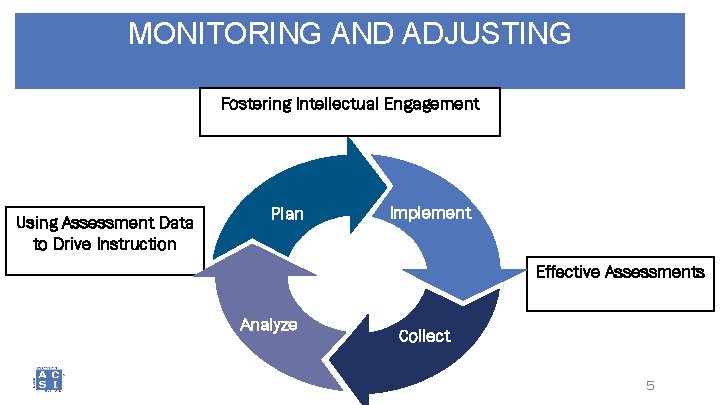
MONITORING AND ADJUSTING Fostering Intellectual Engagement Using Assessment Data to Drive Instruction Plan Implement Effective Assessments Analyze Collect 5
SESSION OBJECTIVES Apply concepts from today’s presentation in planning concrete steps toward… • understanding what data is useful in driving instruction to improve student achievement. • identifying trends from data to make informed educational decisions. • creating next steps and goals that are data-driven, actionable, and measurable. • consistently reflecting and revising as part of the cycle of teaching and learning. 6
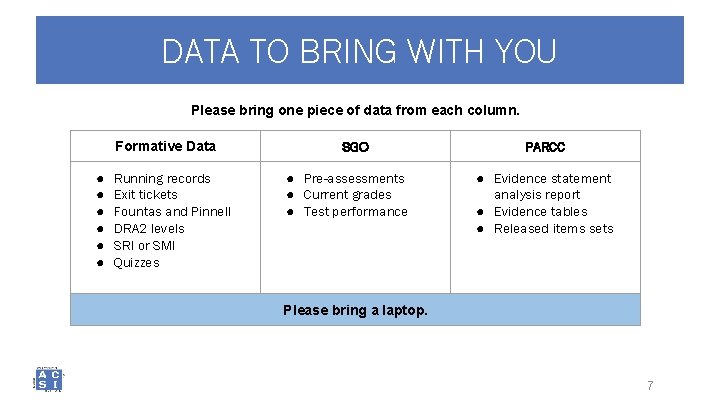
DATA TO BRING WITH YOU Please bring one piece of data from each column. Formative Data ● ● ● Running records Exit tickets Fountas and Pinnell DRA 2 levels SRI or SMI Quizzes SGO ● Pre-assessments ● Current grades ● Test performance PARCC ● Evidence statement analysis report ● Evidence tables ● Released items sets Please bring a laptop. 7
AGENDA • INTRODUCING CORE CONCEPTS • USING DATA TO DRIVE INSTRUCTION- FORMATIVE, SGO, PARCC • CLOSING THOUGHTS 8 8
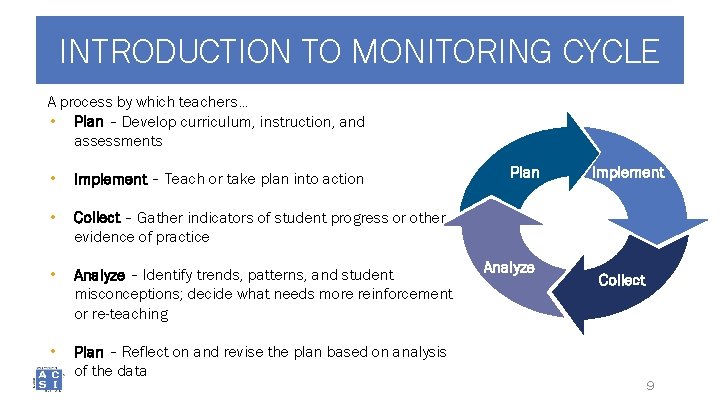
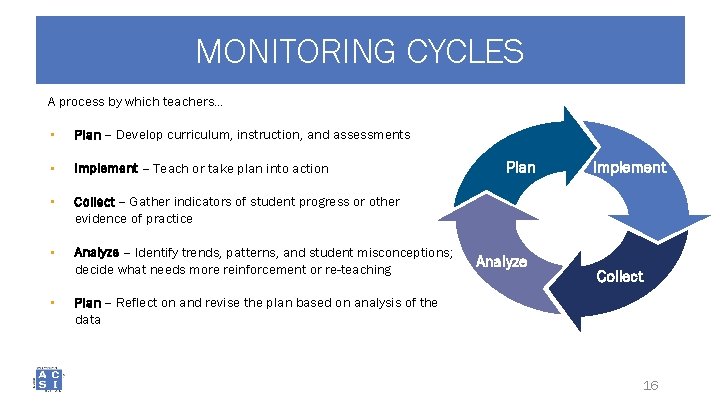
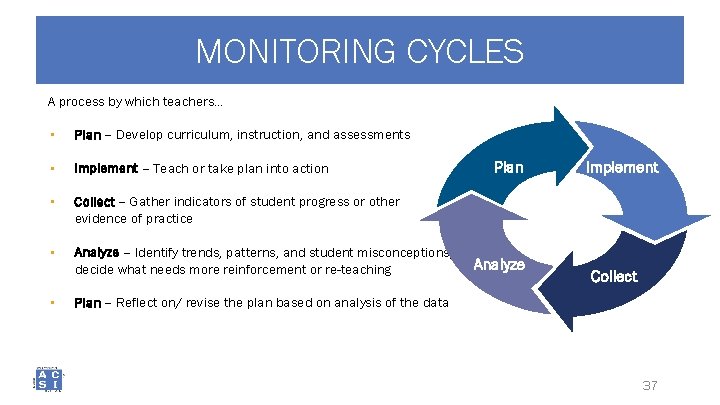
INTRODUCTION TO MONITORING CYCLE A process by which teachers… • Plan – Develop curriculum, instruction, and assessments • Implement – Teach or take plan into action • Collect – Gather indicators of student progress or other evidence of practice • Analyze – Identify trends, patterns, and student misconceptions; decide what needs more reinforcement or re-teaching • Plan – Reflect on and revise the plan based on analysis of the data Plan Analyze Implement Collect 9
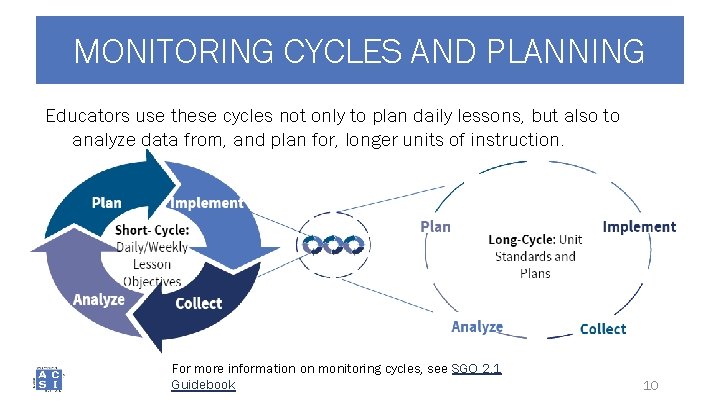
MONITORING CYCLES AND PLANNING Educators use these cycles not only to plan daily lessons, but also to analyze data from, and plan for, longer units of instruction. For more information on monitoring cycles, see SGO 2. 1 Guidebook 10
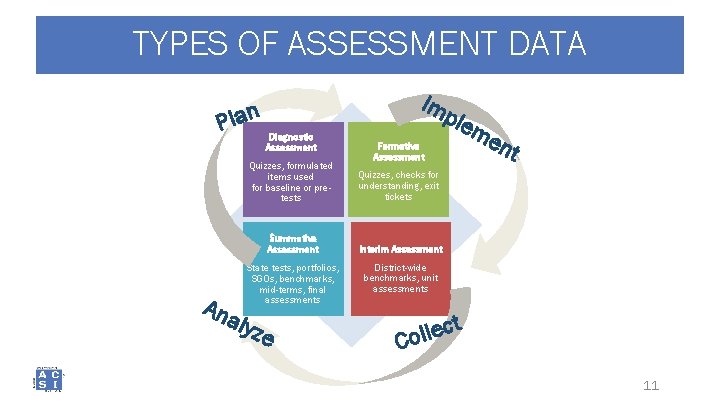
TYPES OF ASSESSMENT DATA Plan Ana l Im Diagnostic Assessment Formative Assessment ple m Quizzes, formulated items used for baseline or pretests Quizzes, checks for understanding, exit tickets Summative Assessment Interim Assessment State tests, portfolios, SGOs, benchmarks, mid-terms, final assessments yze en t District-wide benchmarks, unit assessments t c e l l Co 11
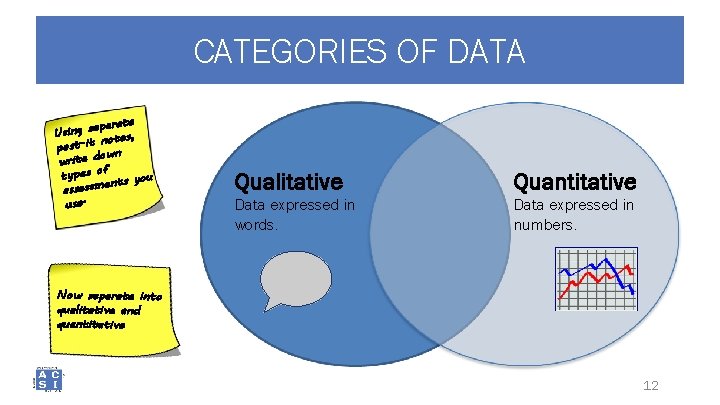
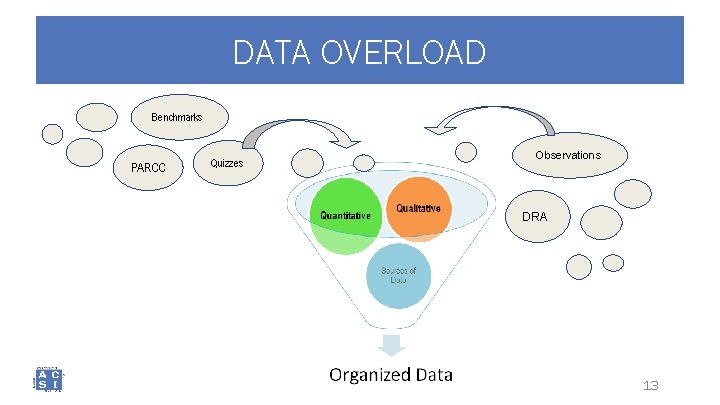
CATEGORIES OF DATA eparate Using s notes, post-it own write d f types o ts you en assessm use. Qualitative Quantitative Data expressed in words. Data expressed in numbers. Now separate into qualitative and quantitative 12
DATA OVERLOAD Benchmarks PARCC Quizzes Observations DRA 13
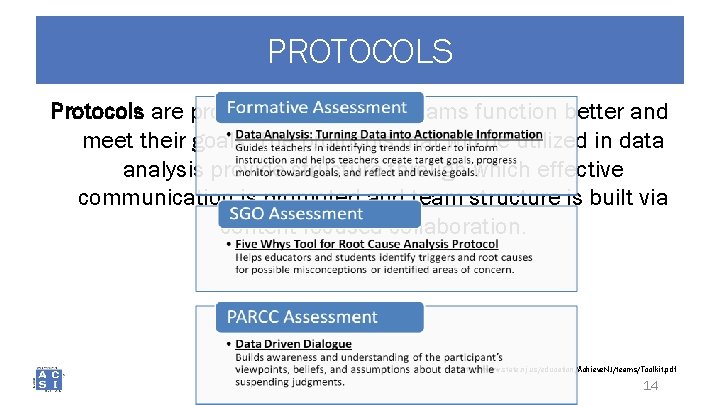
PROTOCOLS Protocols are procedures that help teams function better and meet their goals. The protocols that will be utilized in data analysis provide structure through which effective communication is promoted and team structure is built via content-focused collaboration. http: //www. state. nj. us/education/Achieve. NJ/teams/Toolkit. pdf 14
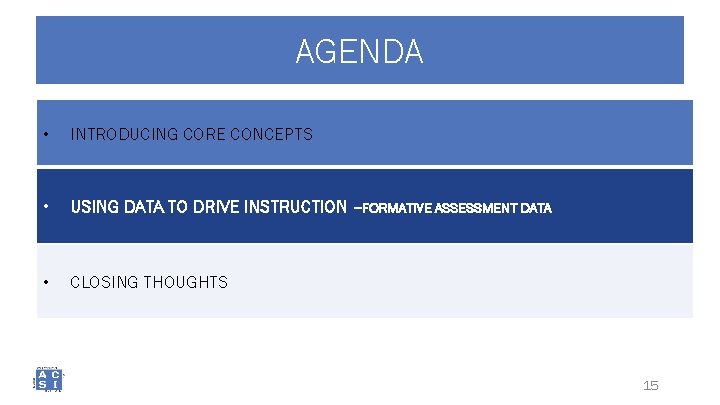
AGENDA • INTRODUCING CORE CONCEPTS • USING DATA TO DRIVE INSTRUCTION –FORMATIVE ASSESSMENT DATA • CLOSING THOUGHTS 15
MONITORING CYCLES A process by which teachers… • Plan – Develop curriculum, instruction, and assessments • Implement – Teach or take plan into action • Collect – Gather indicators of student progress or other evidence of practice • Analyze – Identify trends, patterns, and student misconceptions; decide what needs more reinforcement or re-teaching • Plan Analyze Implement Collect Plan – Reflect on and revise the plan based on analysis of the data 16
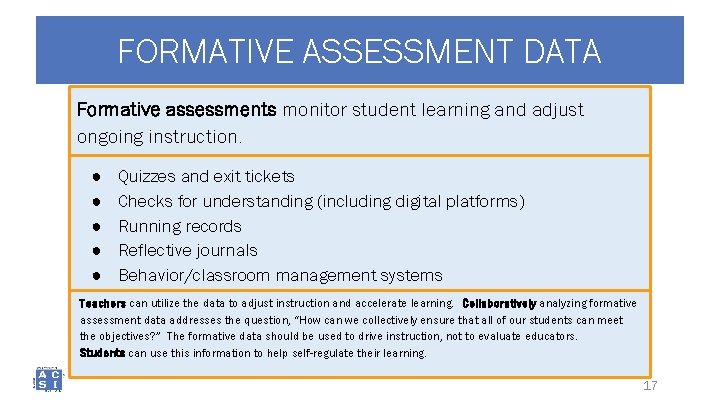
FORMATIVE ASSESSMENT DATA Formative assessments monitor student learning and adjust ongoing instruction. ● ● ● Quizzes and exit tickets Checks for understanding (including digital platforms) Running records Reflective journals Behavior/classroom management systems Teachers can utilize the data to adjust instruction and accelerate learning. Collaboratively analyzing formative assessment data addresses the question, “How can we collectively ensure that all of our students can meet the objectives? ” The formative data should be used to drive instruction, not to evaluate educators. Students can use this information to help self-regulate their learning. 17
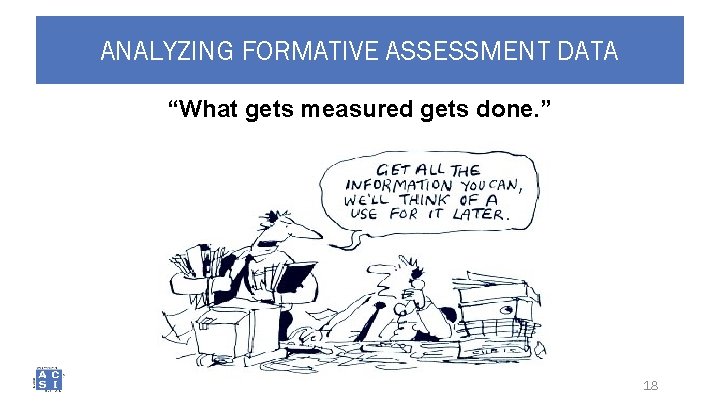
ANALYZING FORMATIVE ASSESSMENT DATA “What gets measured gets done. ” 18
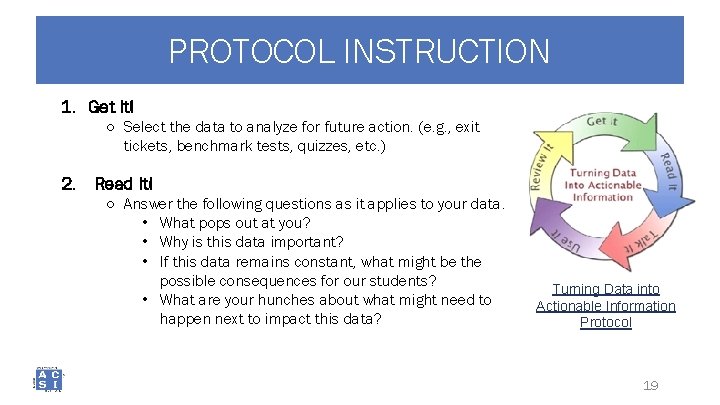
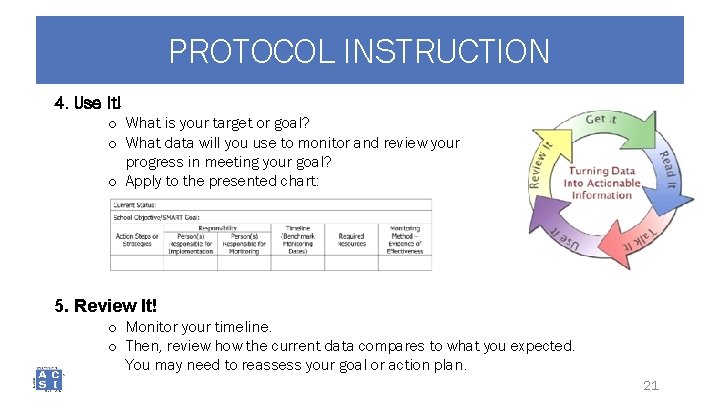
PROTOCOL INSTRUCTION 1. Get It! ○ Select the data to analyze for future action. (e. g. , exit tickets, benchmark tests, quizzes, etc. ) 2. Read It! ○ Answer the following questions as it applies to your data. • What pops out at you? • Why is this data important? • If this data remains constant, what might be the possible consequences for our students? • What are your hunches about what might need to happen next to impact this data? Turning Data into Actionable Information Protocol 19
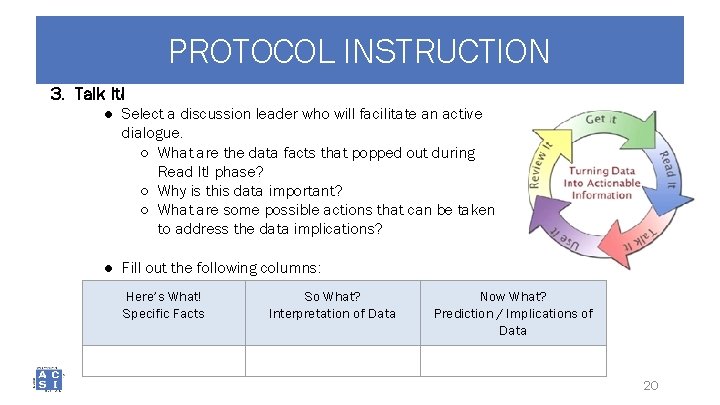
PROTOCOL INSTRUCTION 3. Talk It! ● Select a discussion leader who will facilitate an active dialogue. ○ What are the data facts that popped out during Read It! phase? ○ Why is this data important? ○ What are some possible actions that can be taken to address the data implications? ● Fill out the following columns: Here’s What! Specific Facts So What? Interpretation of Data Now What? Prediction / Implications of Data 20
DATA ANALYSIS PROTOCOL INSTRUCTION 4. Use It! o What is your target or goal? o What data will you use to monitor and review your progress in meeting your goal? o Apply to the presented chart: 5. Review It! o Monitor your timeline. o Then, review how the current data compares to what you expected. You may need to reassess your goal or action plan. 21
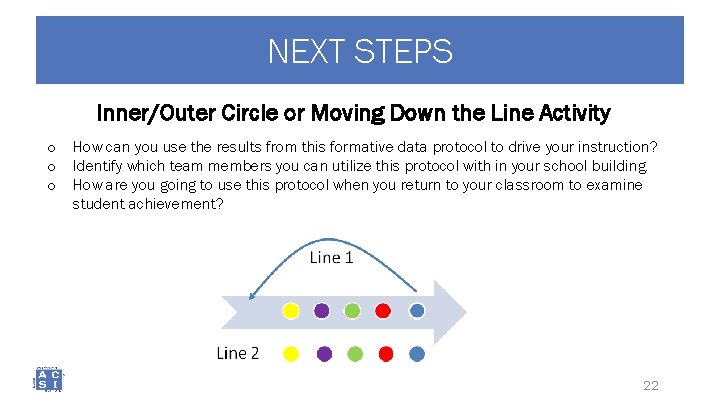
NEXT STEPS Inner/Outer Circle or Moving Down the Line Activity o How can you use the results from this formative data protocol to drive your instruction? o Identify which team members you can utilize this protocol with in your school building. o How are you going to use this protocol when you return to your classroom to examine student achievement? 22
AGENDA • INTRODUCING CORE CONCEPTS • USING DATA TO DRIVE INSTRUCTION –SGO ASSESSMENT DATA • CLOSING THOUGHTS 23
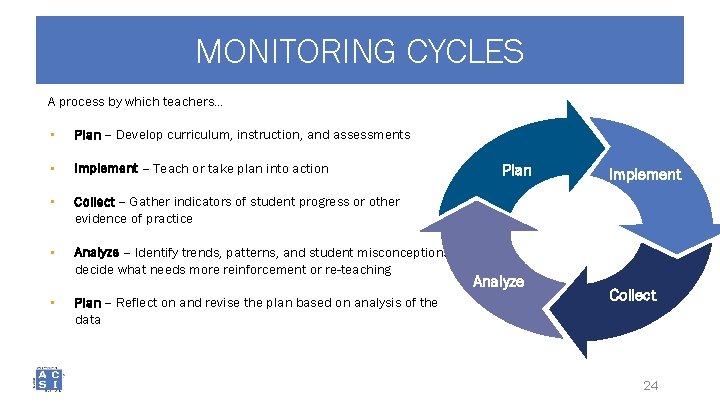
MONITORING CYCLES A process by which teachers… • Plan – Develop curriculum, instruction, and assessments • Implement – Teach or take plan into action • Collect – Gather indicators of student progress or other evidence of practice • Analyze – Identify trends, patterns, and student misconceptions; decide what needs more reinforcement or re-teaching • Plan – Reflect on and revise the plan based on analysis of the data Plan Analyze Implement Collect 24
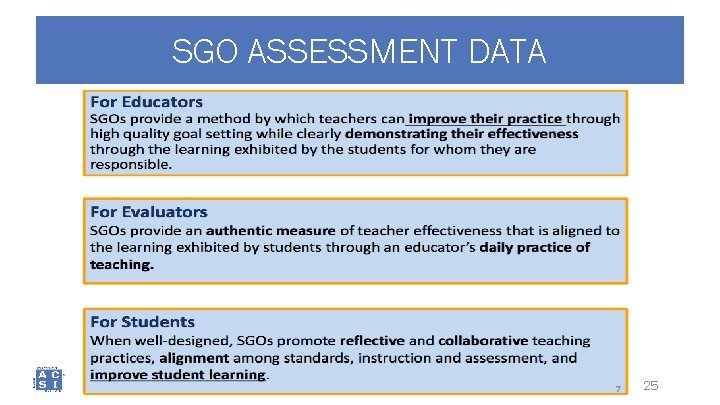
SGO ASSESSMENT DATA 25
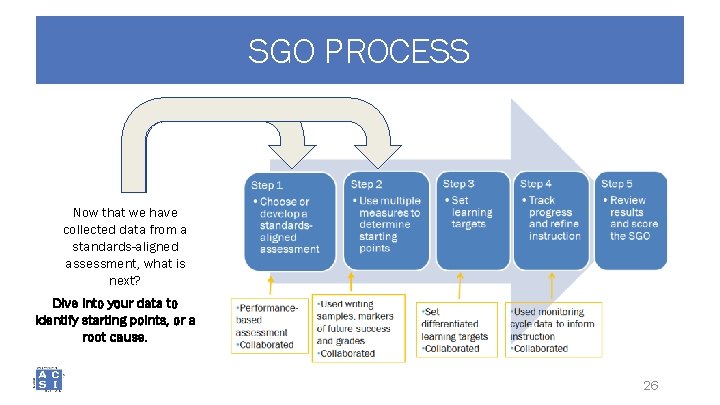
SGO PROCESS Now that we have collected data from a standards-aligned assessment, what is next? Dive into your data to identify starting points, or a root cause. 26
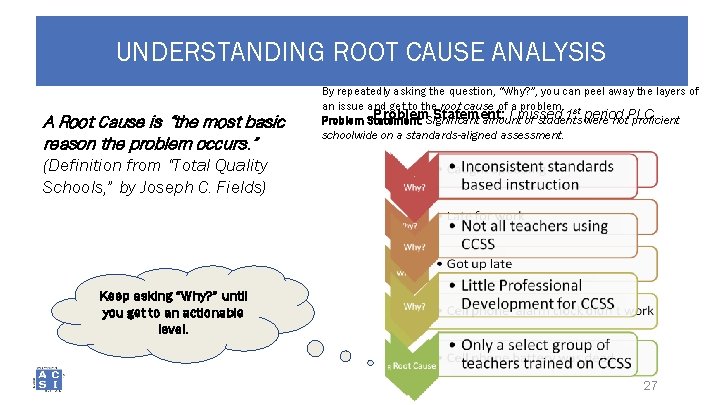
UNDERSTANDING ROOT CAUSE ANALYSIS A Root Cause is “the most basic reason the problem occurs. ” By repeatedly asking the question, “Why? ”, you can peel away the layers of an issue and get to the root cause of a problem. st Problem. Significant Statement: I missed 1 period Problem Statement: amount of students were not. PLC. proficient schoolwide on a standards-aligned assessment. (Definition from “Total Quality Schools, ” by Joseph C. Fields) Keep asking “Why? ” until you get to an actionable level. 27
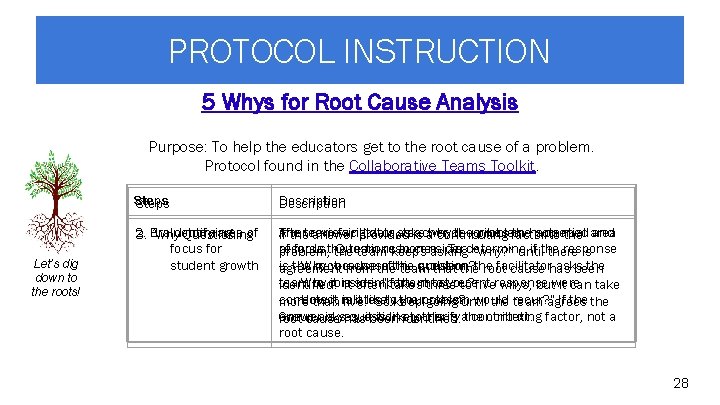
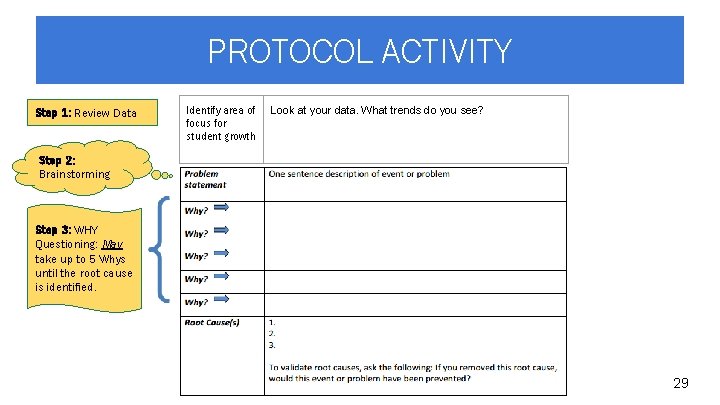
PROTOCOL INSTRUCTION 5 Whys for Root Cause Analysis Purpose: To help the educators get to the root cause of a problem. Protocol found in the Collaborative Teams Toolkit. Let’s dig down to the roots! Steps Description 1. Identify area of 2. 3. Brainstorming Why Questioning focus for student growth After reviewing data, asks teacher describes thehappened potential The facilitator the problem and If theteam answer provided is awhy contributing factor to the area of focus. the Questions to consider: records team To determine if the response problem, the teamresponse. keeps asking “Why? ” until there is ·is the Why you chose question? root cause ofthis the problem, facilitator asks the agreement from the team that thethe root cause has been ·team Why it is. It so important to you? to consider "Iftakes the most recent identified. often three to fiveresponse whys, butwere it can take ·more How it relates to your class? corrected, is it likely the problem would recur? " If the than five! So keep going until the team agrees Group asks questions to this clarify context. factor, not a answer is yes, itbeen is likely is athe contributing root cause has identified. root cause. 28
PROTOCOL ACTIVITY Step 1: Review Data Identify area of focus for student growth Look at your data. What trends do you see? Step 2: Brainstorming Step 3: WHY Questioning: May take up to 5 Whys until the root cause is identified. 29
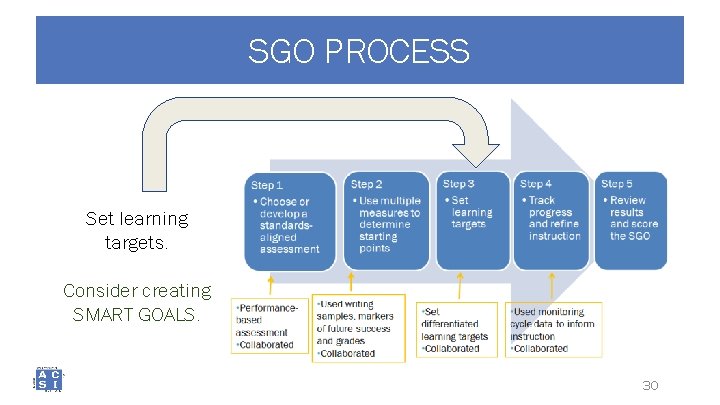
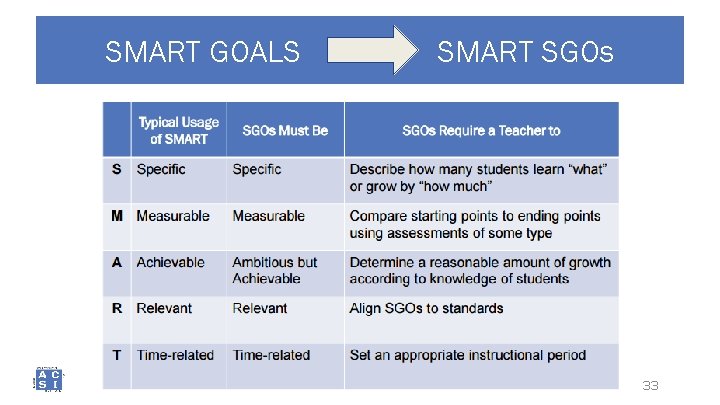
SGO PROCESS Set learning targets. Consider creating SMART GOALS. 30
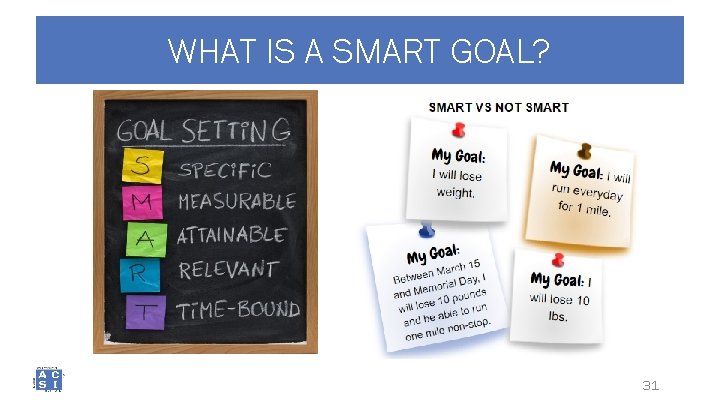
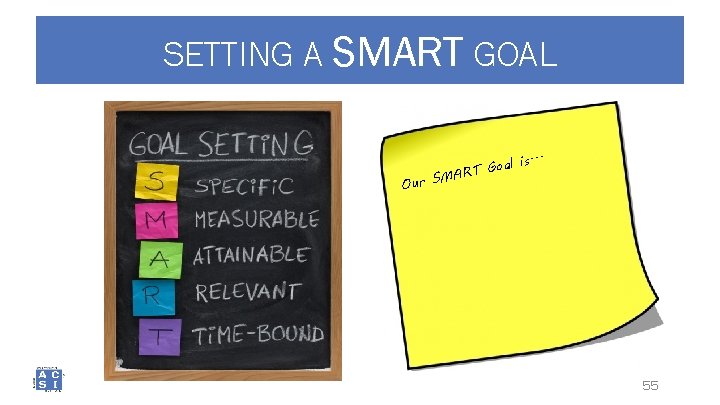
WHAT IS A SMART GOAL? 31
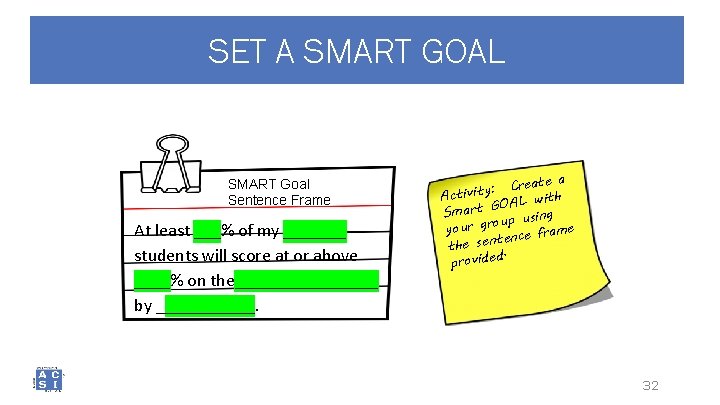
SET A SMART GOAL SMART Goal Sentence Frame At least ___% of my _______ students will score at or above ____% on the________ by ______. eate a r C : y t Activi th OAL wi G t r a Sm p using u o r g r e you nce fram e t n e s the. provided 32
SMART GOALS SMART SGOs 33
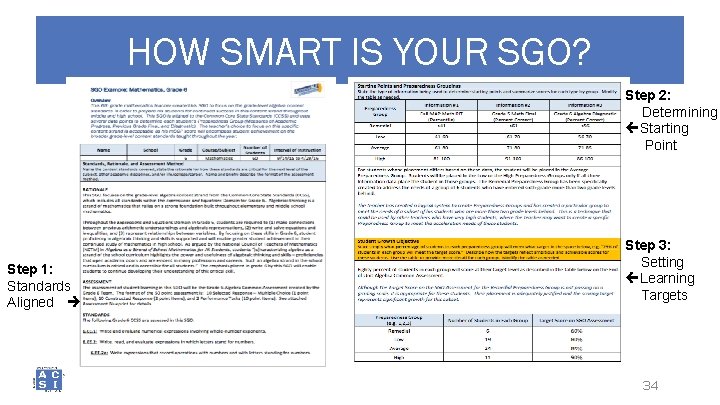
HOW SMART IS YOUR SGO? Step 2: Determining Starting Point Step 1: Standards Aligned Step 3: Setting Learning Targets 34
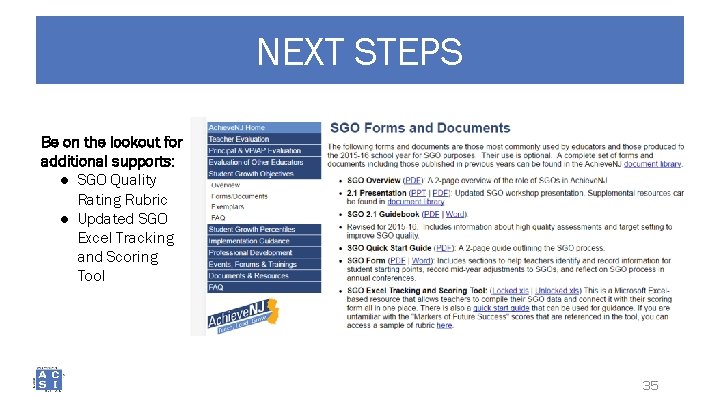
NEXT STEPS Be on the lookout for additional supports: ● SGO Quality Rating Rubric ● Updated SGO Excel Tracking and Scoring Tool 35
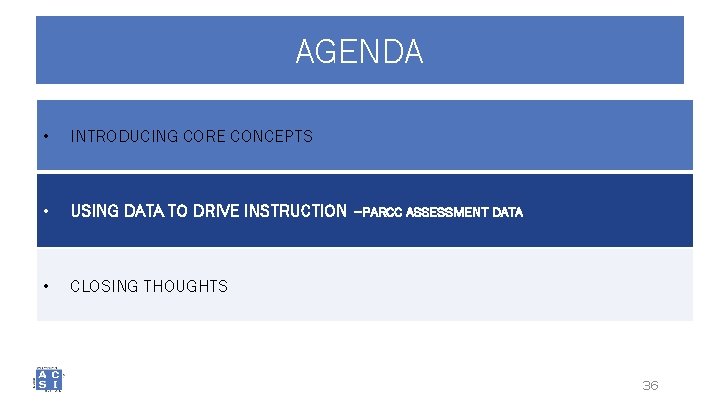
AGENDA • INTRODUCING CORE CONCEPTS • USING DATA TO DRIVE INSTRUCTION –PARCC ASSESSMENT DATA • CLOSING THOUGHTS 36
MONITORING CYCLES A process by which teachers… • Plan – Develop curriculum, instruction, and assessments • Implement – Teach or take plan into action • Collect – Gather indicators of student progress or other evidence of practice • Analyze – Identify trends, patterns, and student misconceptions; decide what needs more reinforcement or re-teaching • Plan Analyze Implement Collect Plan – Reflect on/ revise the plan based on analysis of the data 37
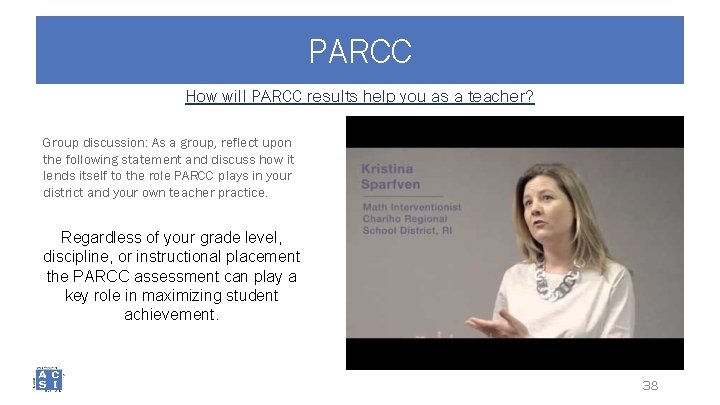
PARCC How will PARCC results help you as a teacher? Group discussion: As a group, reflect upon the following statement and discuss how it lends itself to the role PARCC plays in your district and your own teacher practice. Regardless of your grade level, discipline, or instructional placement the PARCC assessment can play a key role in maximizing student achievement. 38
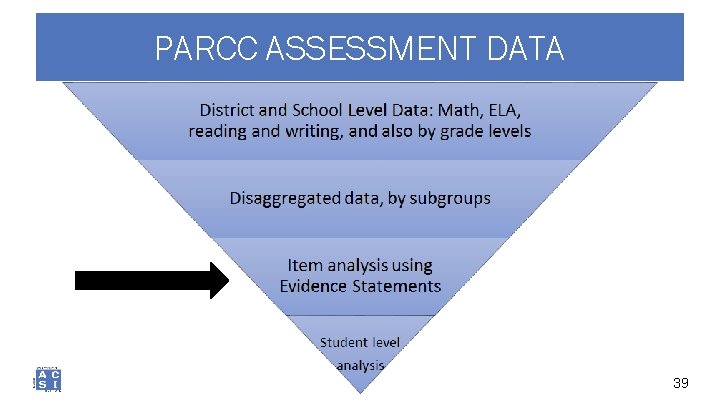
PARCC ASSESSMENT DATA 39 39
MATERIALS NEEDED TO DO THIS WORK Evidence Based Tables Published by PARCC Literacy Evidence Tables (Reading and Writing) Math Evidence Tables Partnership Resource Center Create an Account - It’s Free! NJ Code: nj 1787 PARCC Released Items 40
PROTOCOL INSTRUCTION Data Driven Dialogue http: //schoolreforminitiative. org/doc/data_driven_dialogue. pdf Phase I: Predictions - Surfacing perspectives, beliefs, assumptions, predictions, possibilities, questions, and expectations Phase II: Go Visual - Re-create the data visually Phase III: Observations - Analyzing the data for patterns, trends, surprises, and new questions that “jump” out Phase IV: Inferences - Generating hypotheses, inferring, explaining, and drawing conclusions; defining new actions and interactions and the data needed to guide their implementation; building ownership for decisions 41
PROTOCOL ACTIVITY PHASE 1 PREDICTIONS Look at Evidence Tables to formulate predictions before reviewing data Please reflect privately and record several of your preliminary thoughts about the data. One or more of the following thought-starters may be helpful. ● I assume… ● I predict… ● I wonder… ● My questions/expectations are influenced by… ● Some possibilities for learning that this data may present… 42
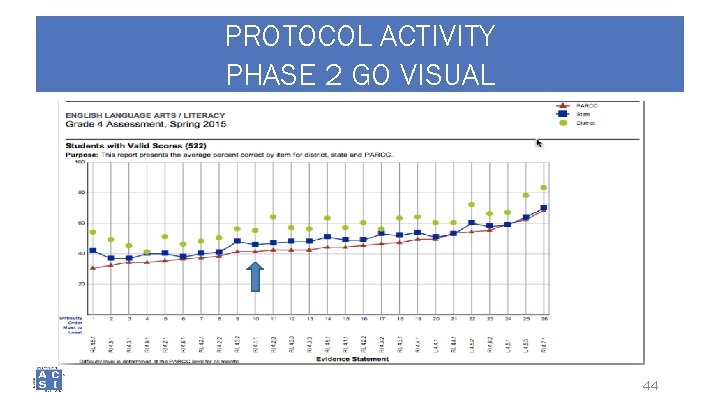
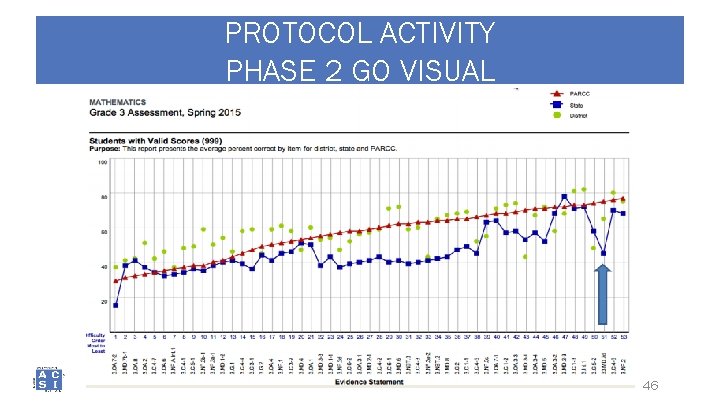
PROTOCOL ACTIVITY PHASE 2 GO VISUAL Re-create the data visually, on large sheets of paper, on a data wall, etc. Mark up the data to better understand it (i. e. , highlight trend lines in different colors, do math calculations and chart those, color code parts of the data that relate to each other). Make the data your own! 43
PROTOCOL ACTIVITY PHASE 2 GO VISUAL 44
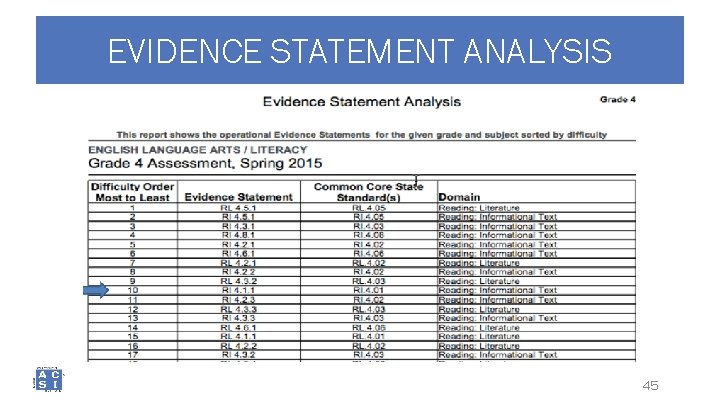
EVIDENCE STATEMENT ANALYSIS 45
PROTOCOL ACTIVITY PHASE 2 GO VISUAL 46
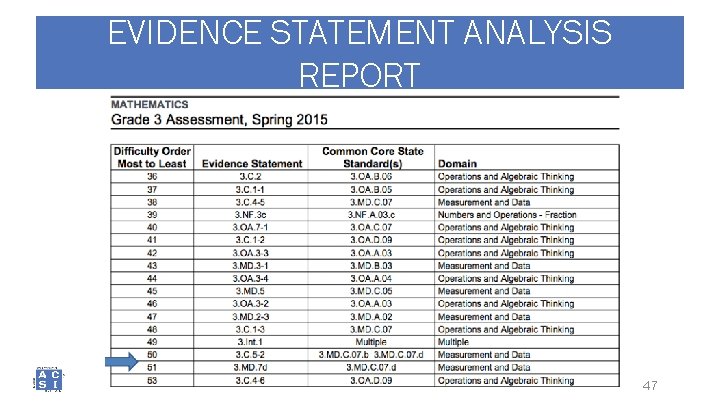
EVIDENCE STATEMENT ANALYSIS REPORT 47
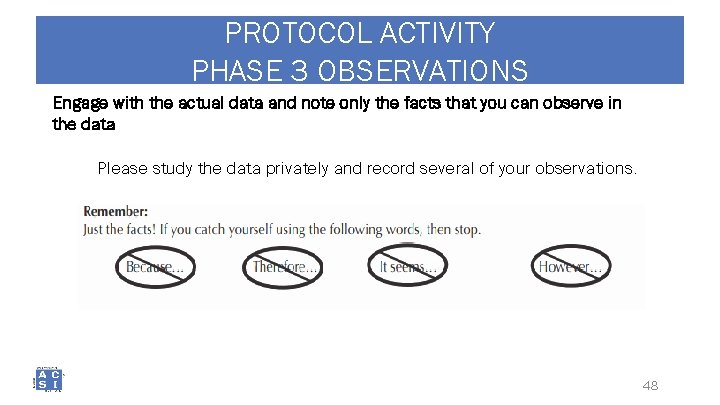
PROTOCOL ACTIVITY PHASE 3 OBSERVATIONS Engage with the actual data and note only the facts that you can observe in the data Please study the data privately and record several of your observations. 48
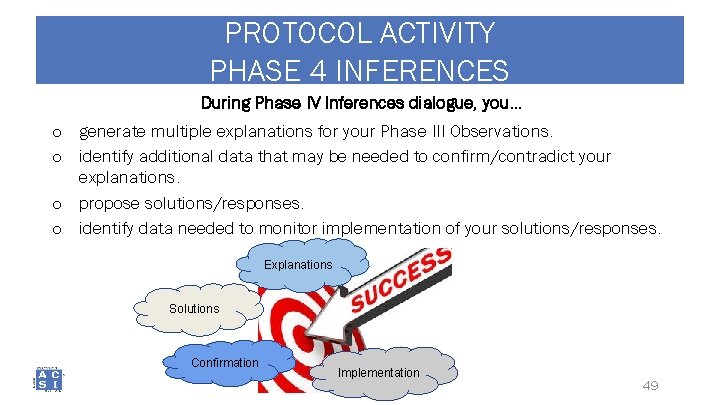
PROTOCOL ACTIVITY PHASE 4 INFERENCES During Phase IV Inferences dialogue, you… o generate multiple explanations for your Phase III Observations. o identify additional data that may be needed to confirm/contradict your explanations. o propose solutions/responses. o identify data needed to monitor implementation of your solutions/responses. Explanations Solutions Confirmation Implementation 49
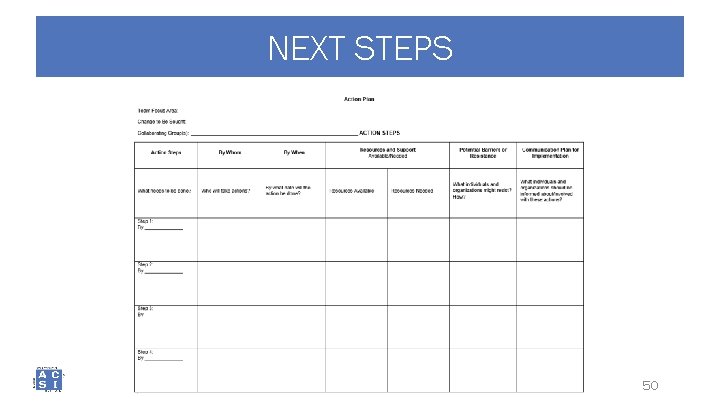
NEXT STEPS 50
AGENDA • INTRODUCING CORE CONCEPTS • USING DATA TO DRIVE INSTRUCTION • CLOSING THOUGHTS 51
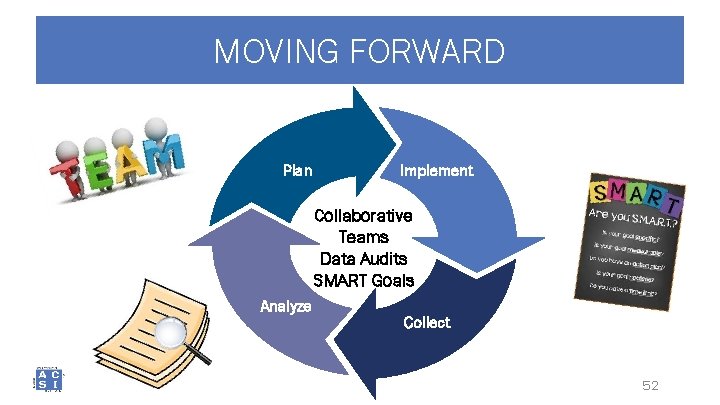
MOVING FORWARD Plan Implement Collaborative Teams Data Audits SMART Goals Analyze Collect 52
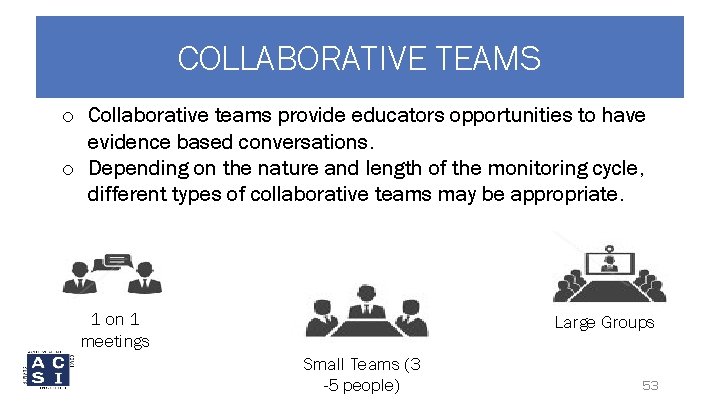
COLLABORATIVE TEAMS o Collaborative teams provide educators opportunities to have evidence based conversations. o Depending on the nature and length of the monitoring cycle, different types of collaborative teams may be appropriate. 1 on 1 meetings Large Groups Small Teams (3 -5 people) 53
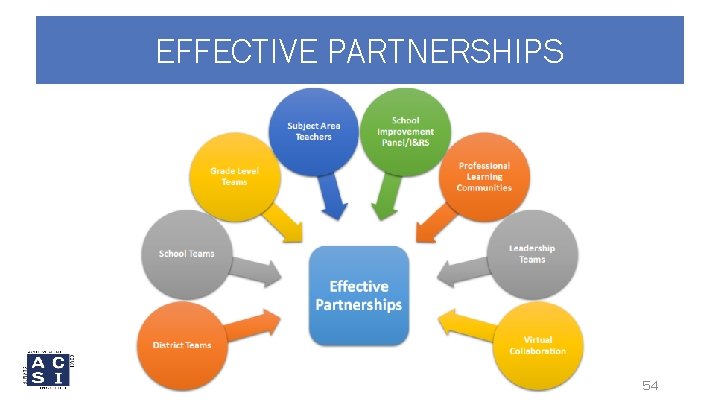
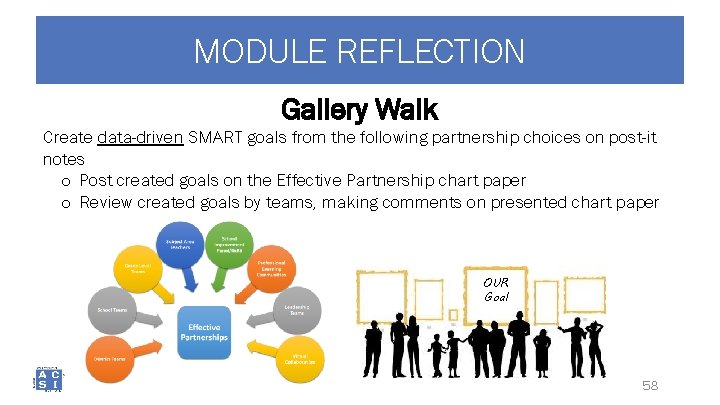
EFFECTIVE PARTNERSHIPS 54
SETTING A SMART GOAL l is. . . a o G MART Our S 55
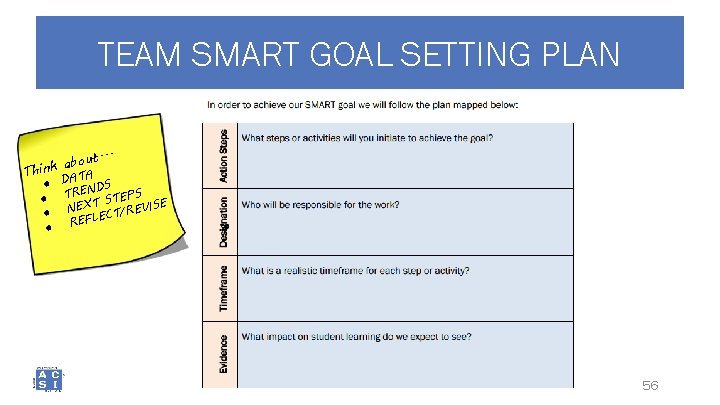
TEAM SMART GOAL SETTING PLAN. . . about k n i h T TA ● DA NDS RE ● T XT STEPS E IS E ● N FLECT/REV E ● R 56
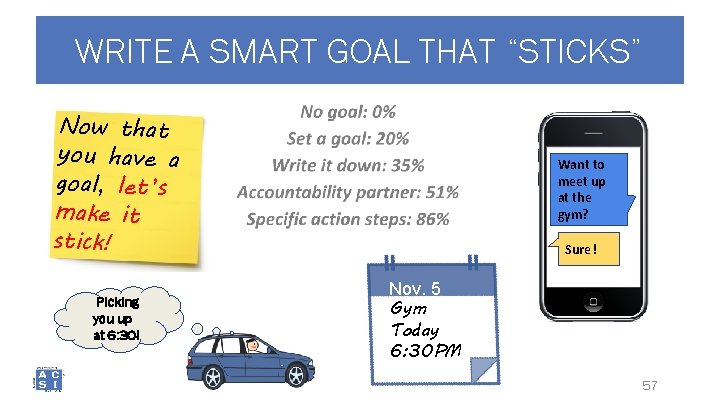
WRITE A SMART GOAL THAT “STICKS” Now that you have a goal, let’s make it stick! Picking you up at 6: 30! Want to meet up at the gym? Sure! Nov. 5 Gym Today 6: 30 PM 57
MODULE REFLECTION Gallery Walk Create data-driven SMART goals from the following partnership choices on post-it notes o Post created goals on the Effective Partnership chart paper o Review created goals by teams, making comments on presented chart paper OUR Goal 58
ADDITIONAL RESOURCES o Collaborative Teams. Toolkit o Blended Online Learning Modules o NJ CORE o PARCC PRC 59