Update on pixel module interfaces Mauro Citterio On
- Slides: 16
Update on pixel module interfaces Mauro Citterio On behalf of INFN Milano Mauro Citterio - SVT Parallel meeting – Frascati, December 2 - 2009 1
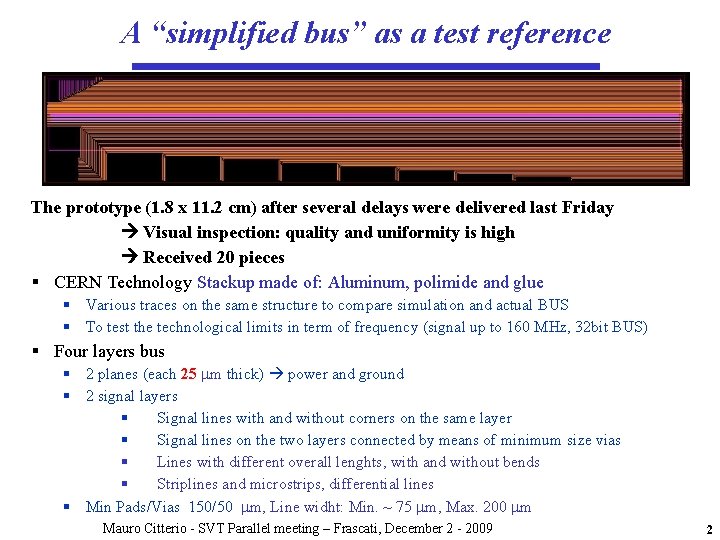
A “simplified bus” as a test reference The prototype (1. 8 x 11. 2 cm) after several delays were delivered last Friday Visual inspection: quality and uniformity is high Received 20 pieces § CERN Technology Stackup made of: Aluminum, polimide and glue § Various traces on the same structure to compare simulation and actual BUS § To test the technological limits in term of frequency (signal up to 160 MHz, 32 bit BUS) § Four layers bus § 2 planes (each 25 mm thick) power and ground § 2 signal layers § Signal lines with and without corners on the same layer § Signal lines on the two layers connected by means of minimum size vias § Lines with different overall lenghts, with and without bends § Striplines and microstrips, differential lines § Min Pads/Vias 150/50 mm, Line widht: Min. ~ 75 mm, Max. 200 mm Mauro Citterio - SVT Parallel meeting – Frascati, December 2 - 2009 2
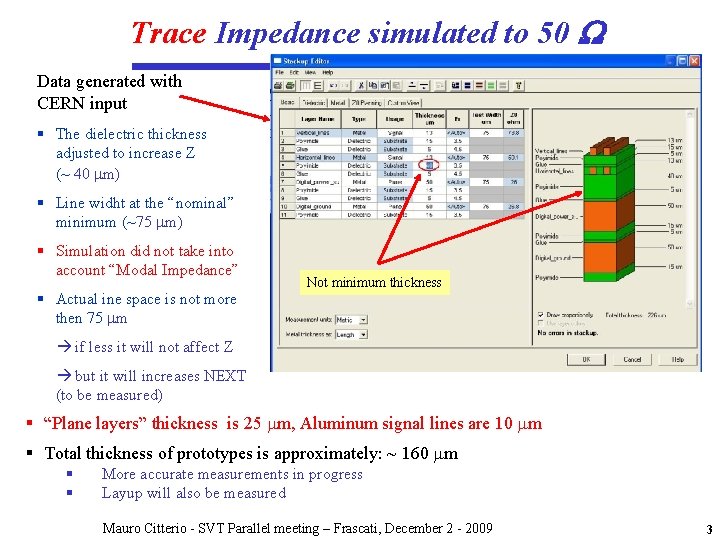
Trace Impedance simulated to 50 W Data generated with CERN input § The dielectric thickness adjusted to increase Z (~ 40 mm) § Line widht at the “nominal” minimum (~75 mm) § Simulation did not take into account “Modal Impedance” § Actual ine space is not more then 75 mm Not minimum thickness if less it will not affect Z but it will increases NEXT (to be measured) § “Plane layers” thickness is 25 mm, Aluminum signal lines are 10 mm § Total thickness of prototypes is approximately: ~ 160 mm § § More accurate measurements in progress Layup will also be measured Mauro Citterio - SVT Parallel meeting – Frascati, December 2 - 2009 3
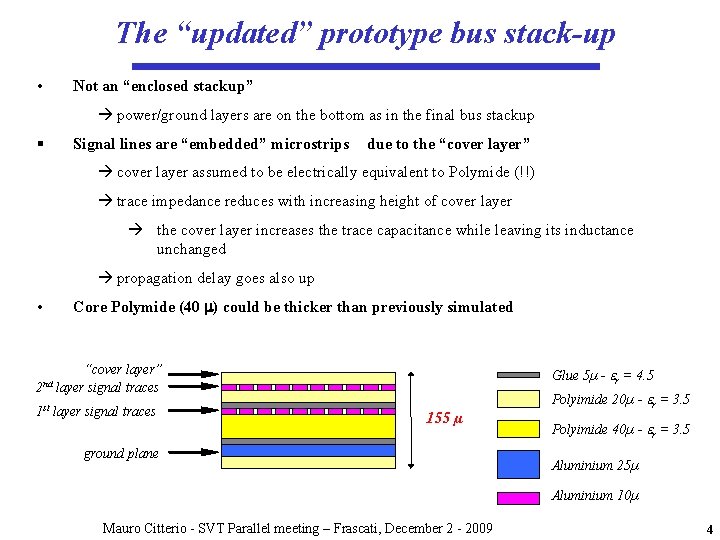
The “updated” prototype bus stack-up • Not an “enclosed stackup” power/ground layers are on the bottom as in the final bus stackup § Signal lines are “embedded” microstrips due to the “cover layer” cover layer assumed to be electrically equivalent to Polymide (!!) trace impedance reduces with increasing height of cover layer the cover layer increases the trace capacitance while leaving its inductance unchanged propagation delay goes also up • 2 nd Core Polymide (40 m) could be thicker than previously simulated “cover layer” layer signal traces 1 st layer signal traces Glue 5µ - er = 4. 5 155 µ ground plane Polyimide 20µ - er = 3. 5 Polyimide 40µ - er = 3. 5 Aluminium 25µ Aluminium 10µ Mauro Citterio - SVT Parallel meeting – Frascati, December 2 - 2009 4
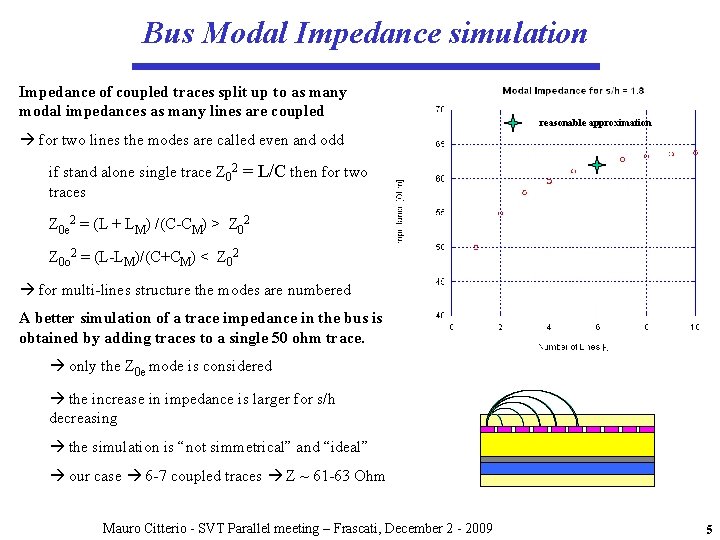
Bus Modal Impedance simulation Impedance of coupled traces split up to as many modal impedances as many lines are coupled reasonable approximation for two lines the modes are called even and odd if stand alone single trace Z 02 = L/C then for two traces Z 0 e 2 = (L + LM) /(C-CM) > Z 02 Z 0 o 2 = (L-LM)/(C+CM) < Z 02 for multi-lines structure the modes are numbered A better simulation of a trace impedance in the bus is obtained by adding traces to a single 50 ohm trace. only the Z 0 e mode is considered the increase in impedance is larger for s/h decreasing the simulation is “not simmetrical” and “ideal” our case 6 -7 coupled traces Z ~ 61 -63 Ohm Mauro Citterio - SVT Parallel meeting – Frascati, December 2 - 2009 5
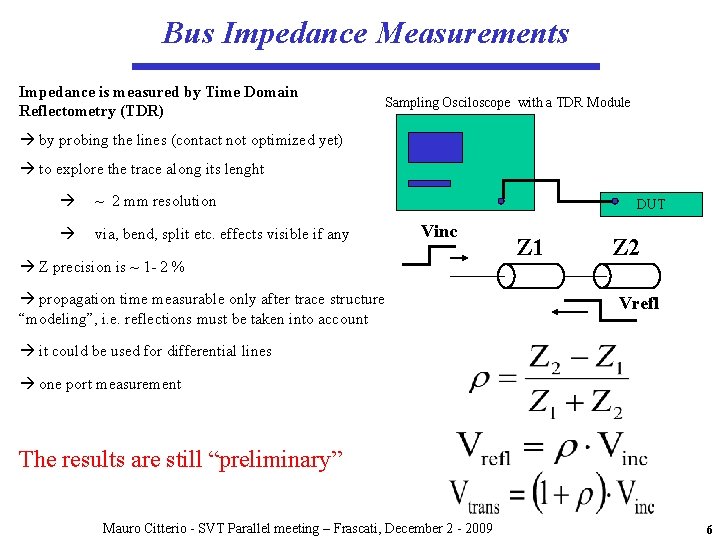
Bus Impedance Measurements Impedance is measured by Time Domain Reflectometry (TDR) Sampling Osciloscope with a TDR Module by probing the lines (contact not optimized yet) to explore the trace along its lenght ~ 2 mm resolution via, bend, split etc. effects visible if any DUT Vinc Z precision is ~ 1 - 2 % propagation time measurable only after trace structure “modeling”, i. e. reflections must be taken into account Z 1 Z 2 Vrefl it could be used for differential lines one port measurement The results are still “preliminary” Mauro Citterio - SVT Parallel meeting – Frascati, December 2 - 2009 6
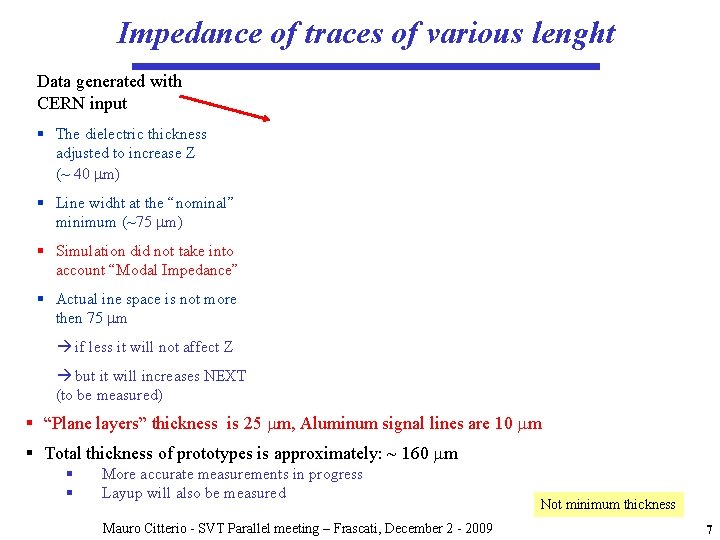
Impedance of traces of various lenght Data generated with CERN input § The dielectric thickness adjusted to increase Z (~ 40 mm) § Line widht at the “nominal” minimum (~75 mm) § Simulation did not take into account “Modal Impedance” § Actual ine space is not more then 75 mm if less it will not affect Z but it will increases NEXT (to be measured) § “Plane layers” thickness is 25 mm, Aluminum signal lines are 10 mm § Total thickness of prototypes is approximately: ~ 160 mm § § More accurate measurements in progress Layup will also be measured Mauro Citterio - SVT Parallel meeting – Frascati, December 2 - 2009 Not minimum thickness 7
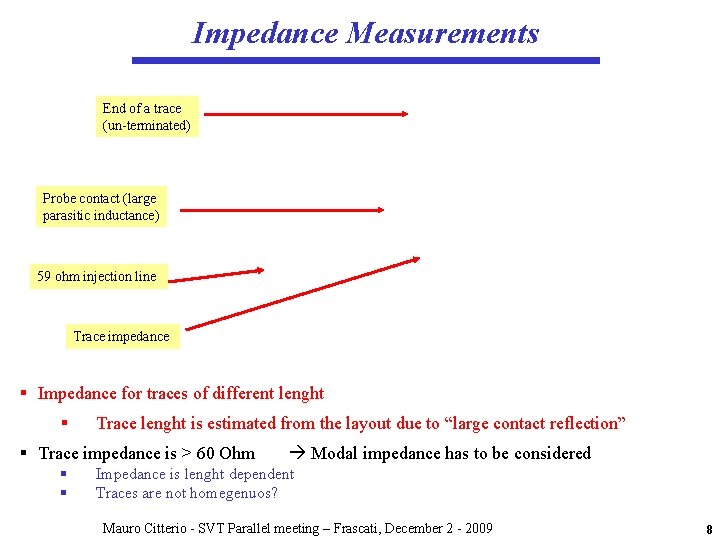
Impedance Measurements End of a trace (un-terminated) Probe contact (large parasitic inductance) 59 ohm injection line Trace impedance § Impedance for traces of different lenght § Trace lenght is estimated from the layout due to “large contact reflection” § Trace impedance is > 60 Ohm § § Modal impedance has to be considered Impedance is lenght dependent Traces are not homegenuos? Mauro Citterio - SVT Parallel meeting – Frascati, December 2 - 2009 8
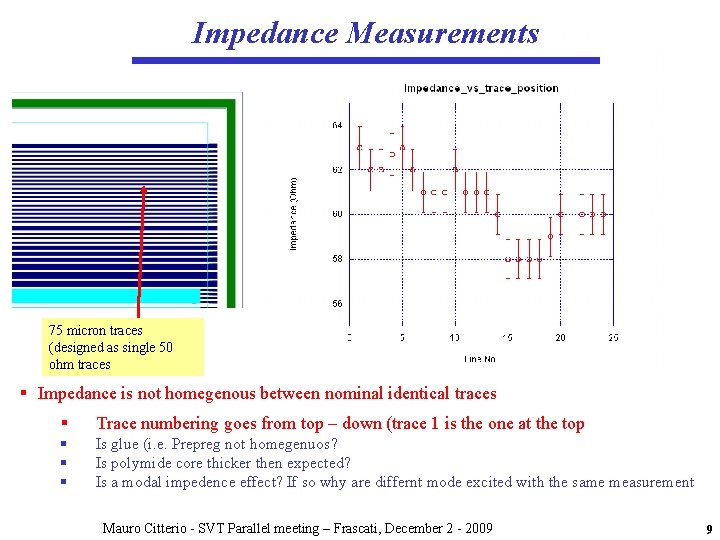
Impedance Measurements 75 micron traces (designed as single 50 ohm traces § Impedance is not homegenous between nominal identical traces § Trace numbering goes from top – down (trace 1 is the one at the top § § § Is glue (i. e. Prepreg not homegenuos? Is polymide core thicker then expected? Is a modal impedence effect? If so why are differnt mode excited with the same measurement Mauro Citterio - SVT Parallel meeting – Frascati, December 2 - 2009 9
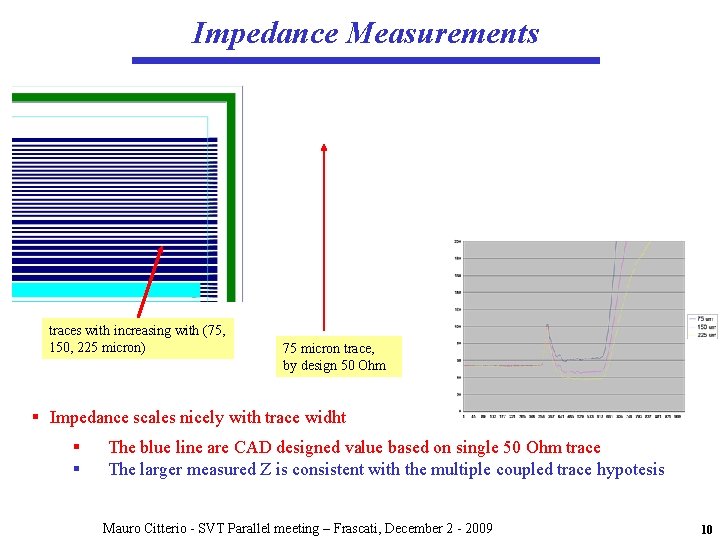
Impedance Measurements traces with increasing with (75, 150, 225 micron) 75 micron trace, by design 50 Ohm § Impedance scales nicely with trace widht § § The blue line are CAD designed value based on single 50 Ohm trace The larger measured Z is consistent with the multiple coupled trace hypotesis Mauro Citterio - SVT Parallel meeting – Frascati, December 2 - 2009 10
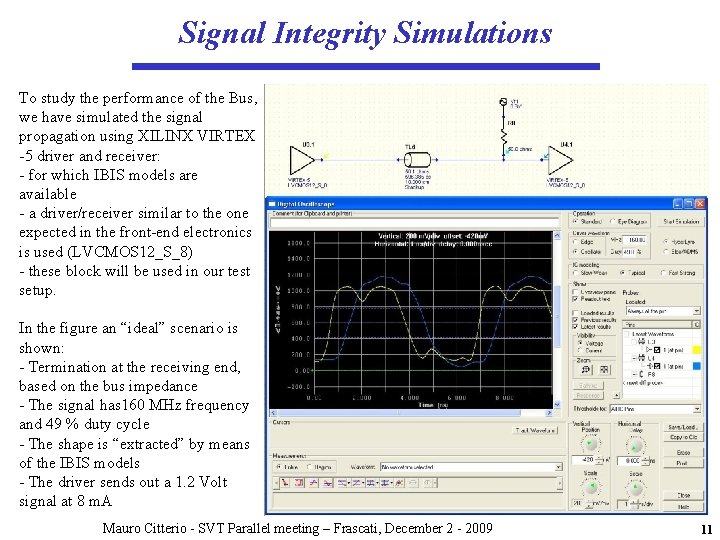
Signal Integrity Simulations To study the performance of the Bus, we have simulated the signal propagation using XILINX VIRTEX -5 driver and receiver: - for which IBIS models are available - a driver/receiver similar to the one expected in the front-end electronics is used (LVCMOS 12_S_8) - these block will be used in our test setup. In the figure an “ideal” scenario is shown: - Termination at the receiving end, based on the bus impedance - The signal has 160 MHz frequency and 49 % duty cycle - The shape is “extracted” by means of the IBIS models - The driver sends out a 1. 2 Volt signal at 8 m. A Mauro Citterio - SVT Parallel meeting – Frascati, December 2 - 2009 11
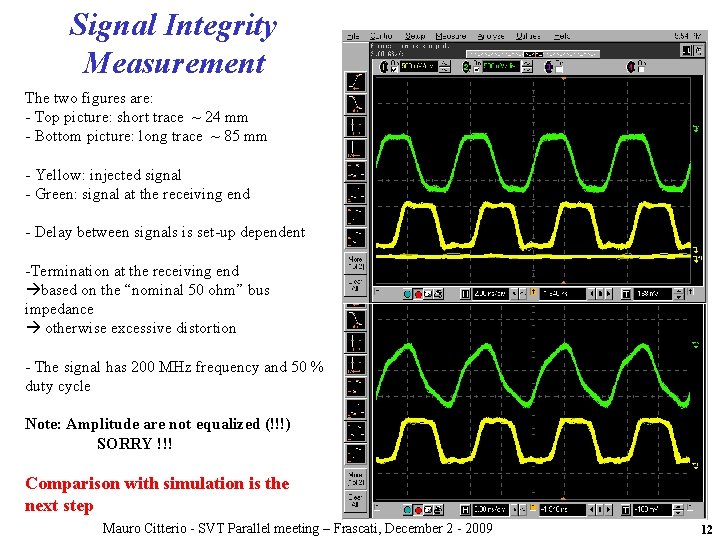
Signal Integrity Measurement The two figures are: - Top picture: short trace ~ 24 mm - Bottom picture: long trace ~ 85 mm - Yellow: injected signal - Green: signal at the receiving end - Delay between signals is set-up dependent -Termination at the receiving end based on the “nominal 50 ohm” bus impedance otherwise excessive distortion - The signal has 200 MHz frequency and 50 % duty cycle Note: Amplitude are not equalized (!!!) SORRY !!! Comparison with simulation is the next step Mauro Citterio - SVT Parallel meeting – Frascati, December 2 - 2009 12
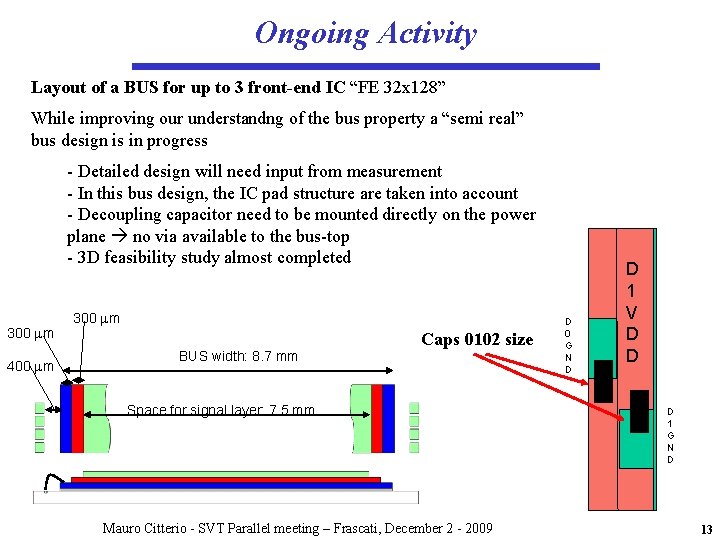
Ongoing Activity Layout of a BUS for up to 3 front-end IC “FE 32 x 128” While improving our understandng of the bus property a “semi real” bus design is in progress - Detailed design will need input from measurement - In this bus design, the IC pad structure are taken into account - Decoupling capacitor need to be mounted directly on the power plane no via available to the bus-top - 3 D feasibility study almost completed 300 mm 400 mm 300 mm BUS width: 8. 7 mm Caps 0102 size Space for signal layer: 7. 5 mm Mauro Citterio - SVT Parallel meeting – Frascati, December 2 - 2009 D 0 G N D D 1 V D D D 1 G N D 13
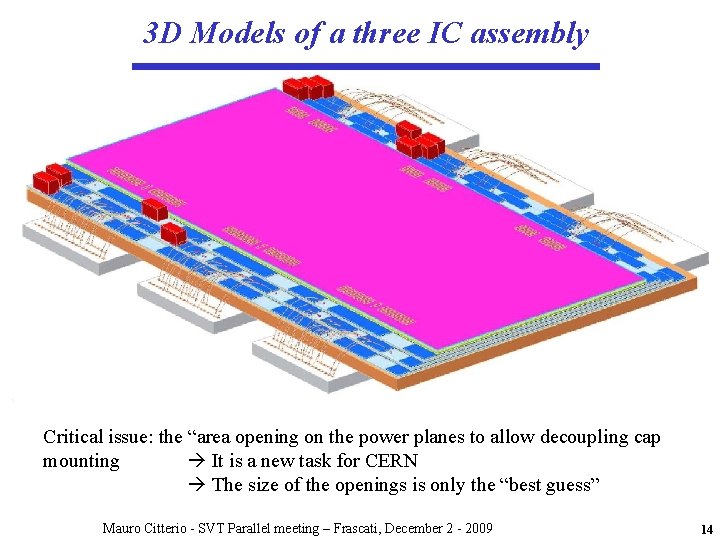
3 D Models of a three IC assembly Critical issue: the “area opening on the power planes to allow decoupling cap mounting It is a new task for CERN The size of the openings is only the “best guess” Mauro Citterio - SVT Parallel meeting – Frascati, December 2 - 2009 14
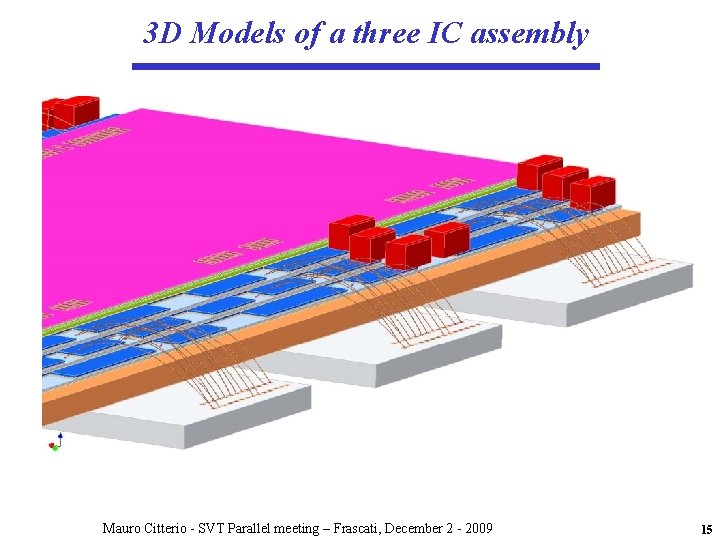
3 D Models of a three IC assembly Mauro Citterio - SVT Parallel meeting – Frascati, December 2 - 2009 15
Conclusions • Prototype bus workmanship: – Not enough time for a complete evaluation – First impression: • the quality is high • The construction took a very long time The “prototype” has three electrical layers The final bus will have at least nine electrical layers Second source manufacturer should be identified • Impedance measurements: – Measurements are encouraging – Not all measurements are understood theoretically • Some ideas to be investigated more • Signal integrity: – Attenuation on long traces needs a better model – More measurements needed • Essentail is the measurement of the crosstalk between lines when “all traces” on the bus are active Mauro Citterio - SVT Parallel meeting – Frascati, December 2 - 2009 16