Unit 8 1 Graphing Exponential Functions ThenNow Graph

- Slides: 22
Unit 8 -1: Graphing Exponential Functions
Then/Now • Graph exponential growth functions. • Graph exponential decay functions.
Vocabulary • exponential function • exponential growth • asymptote • growth factor • exponential decay • decay factor
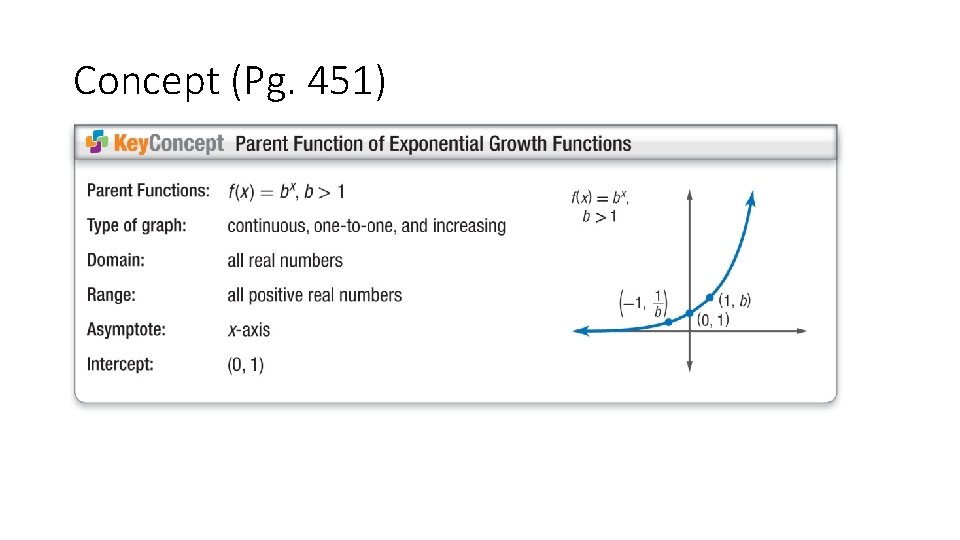
Concept (Pg. 451)
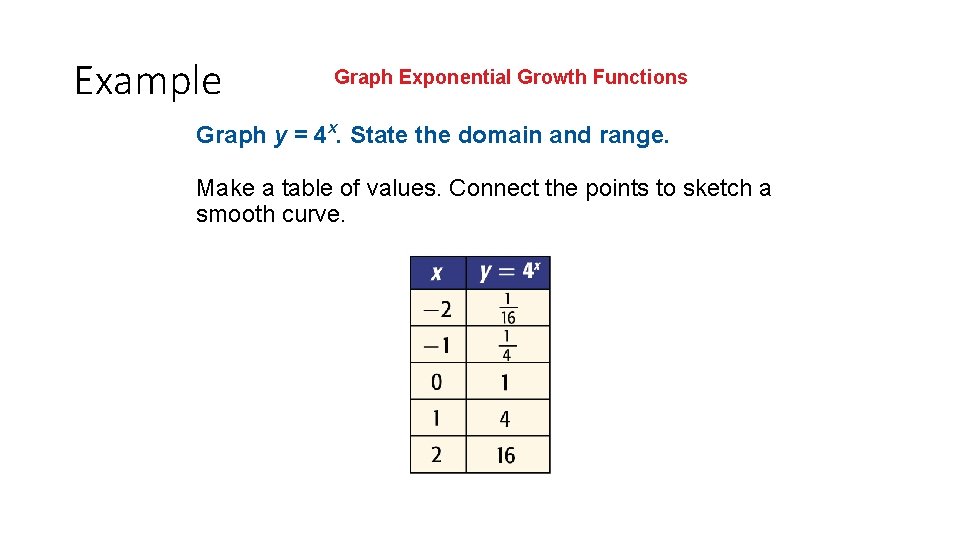
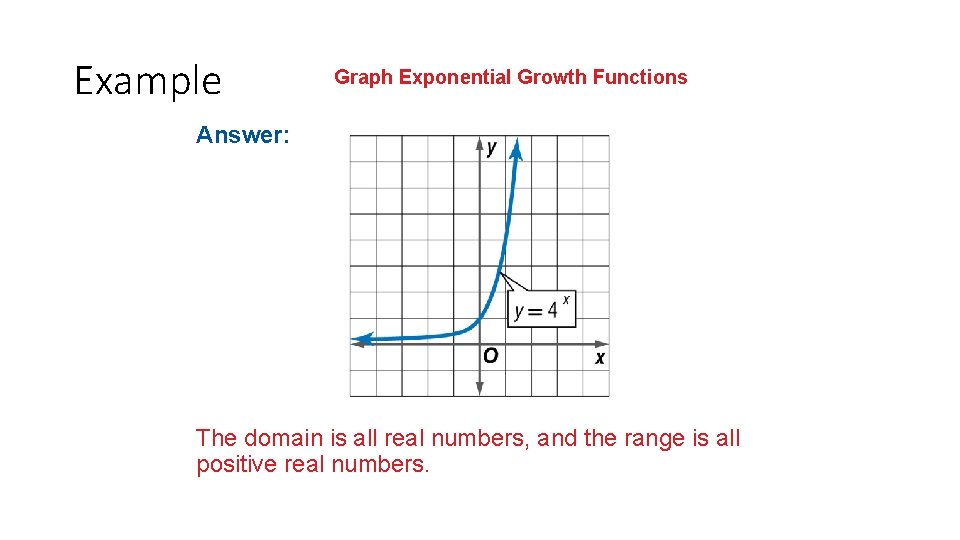
Example Graph Exponential Growth Functions Graph y = 4 x. State the domain and range. Make a table of values. Connect the points to sketch a smooth curve.
Example Graph Exponential Growth Functions Answer: The domain is all real numbers, and the range is all positive real numbers.
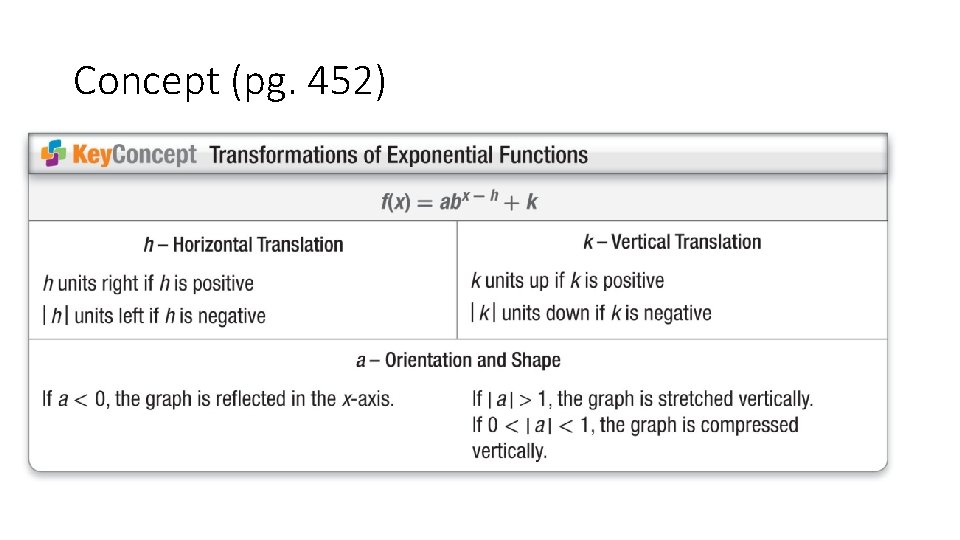
Concept (pg. 452)
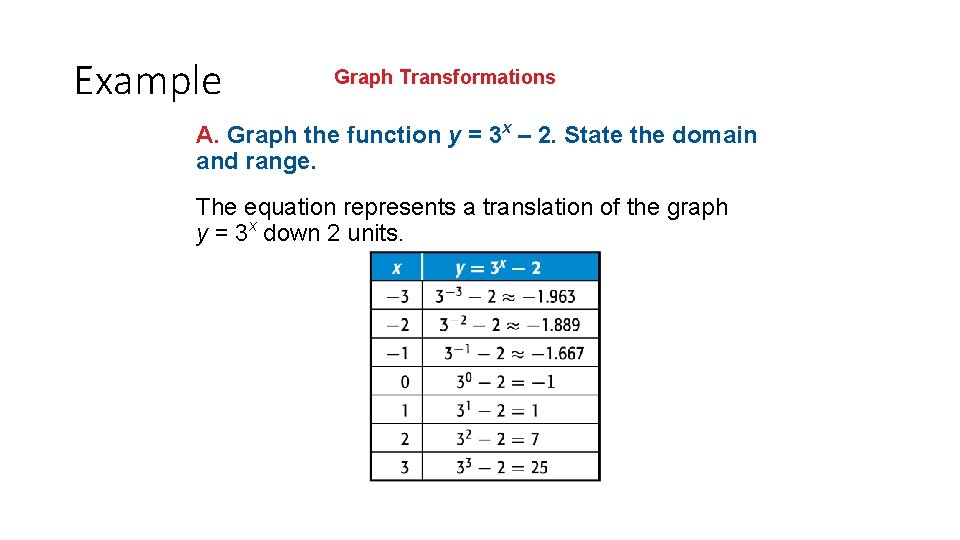
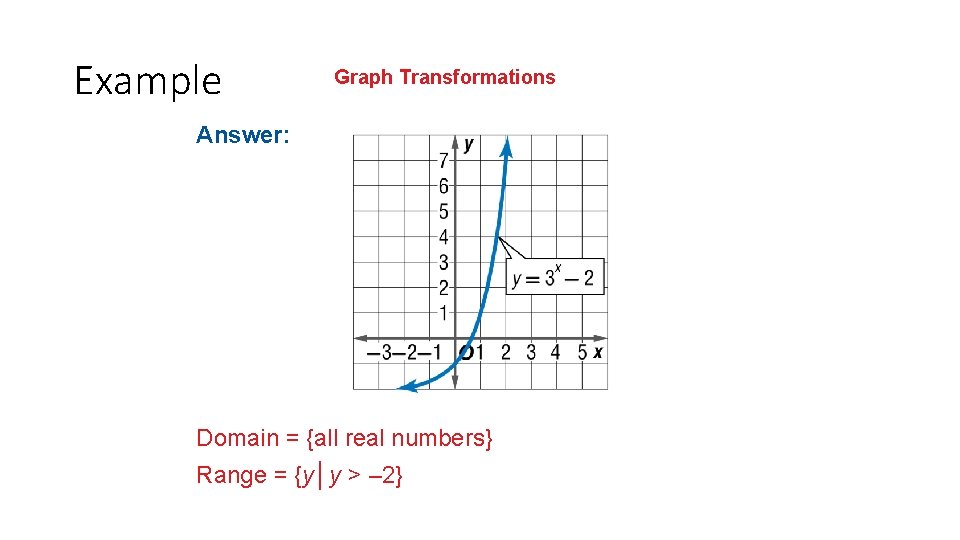
Example Graph Transformations A. Graph the function y = 3 x – 2. State the domain and range. The equation represents a translation of the graph y = 3 x down 2 units.
Example Graph Transformations Answer: Domain = {all real numbers} Range = {y│y > – 2}
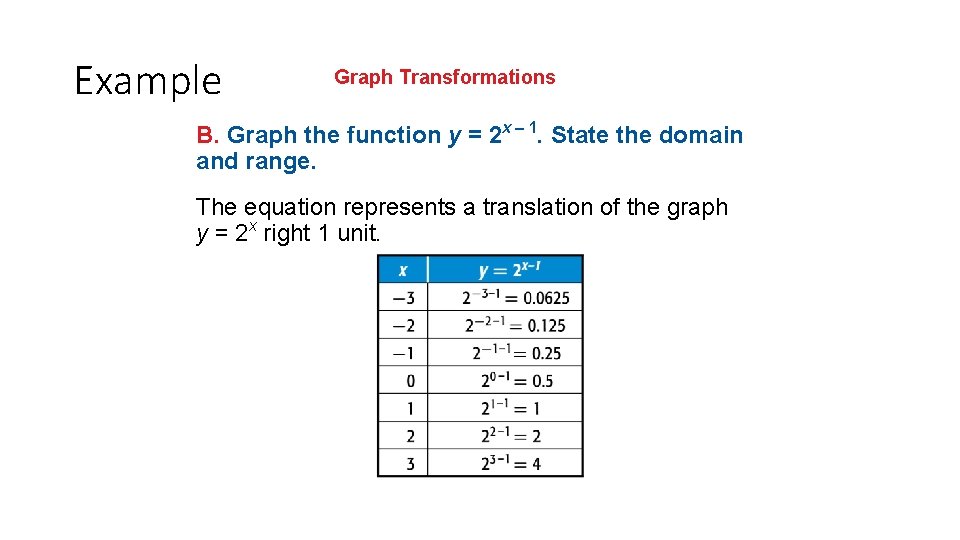
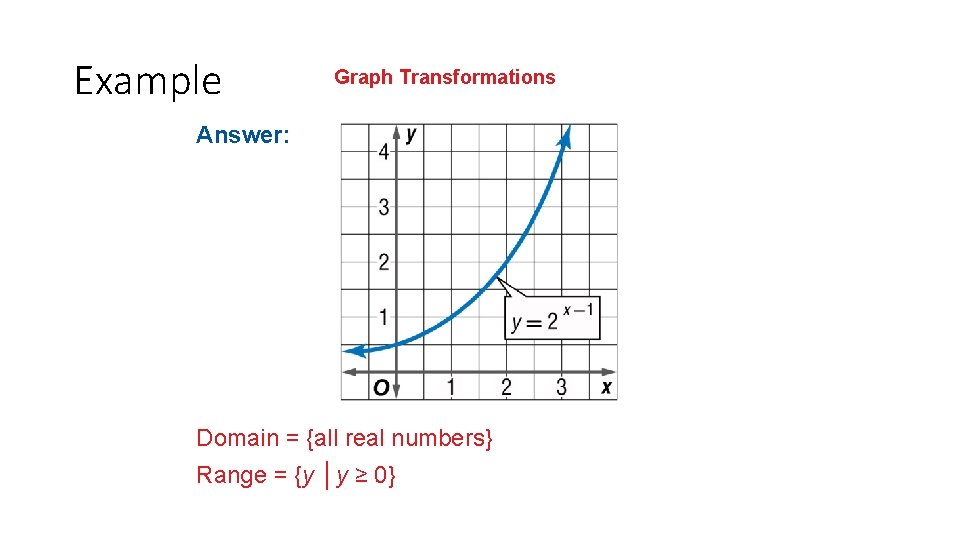
Example Graph Transformations B. Graph the function y = 2 x – 1. State the domain and range. The equation represents a translation of the graph y = 2 x right 1 unit.
Example Graph Transformations Answer: Domain = {all real numbers} Range = {y │y ≥ 0}
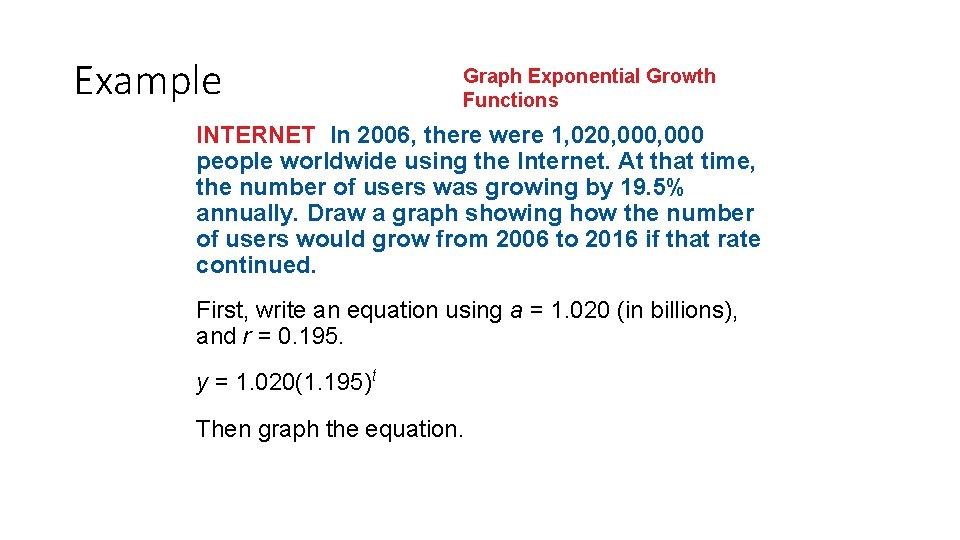
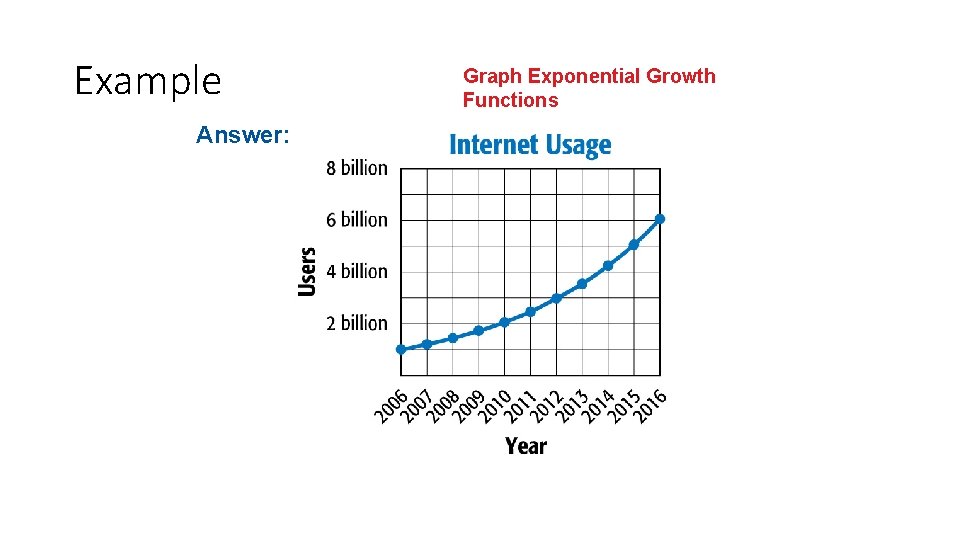
Example Graph Exponential Growth Functions INTERNET In 2006, there were 1, 020, 000 people worldwide using the Internet. At that time, the number of users was growing by 19. 5% annually. Draw a graph showing how the number of users would grow from 2006 to 2016 if that rate continued. First, write an equation using a = 1. 020 (in billions), and r = 0. 195. y = 1. 020(1. 195)t Then graph the equation.
Example Answer: Graph Exponential Growth Functions
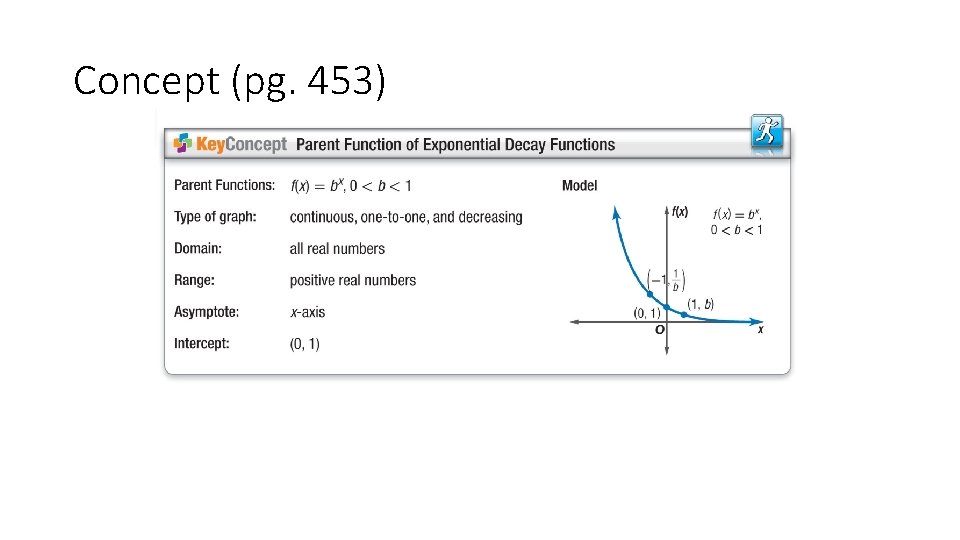
Concept (pg. 453)
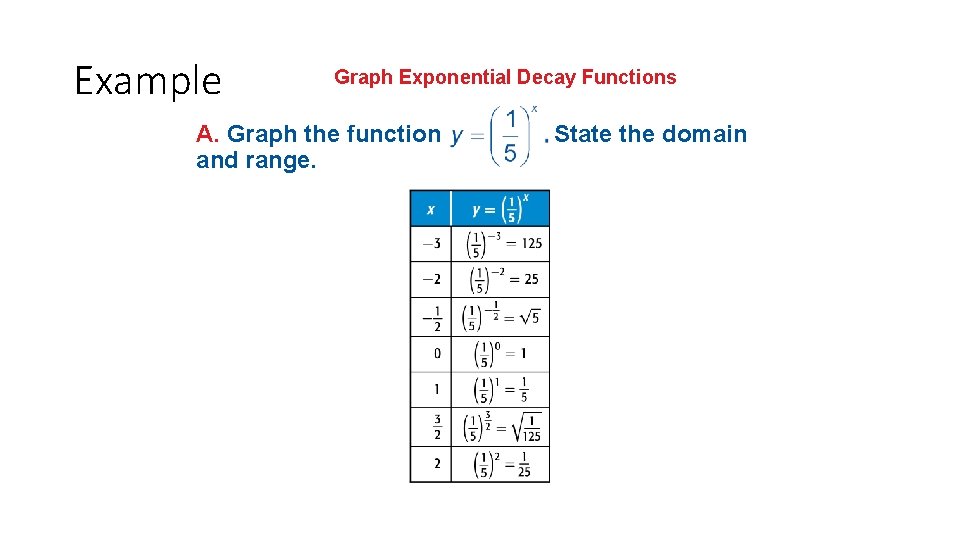
Example Graph Exponential Decay Functions A. Graph the function and range. State the domain
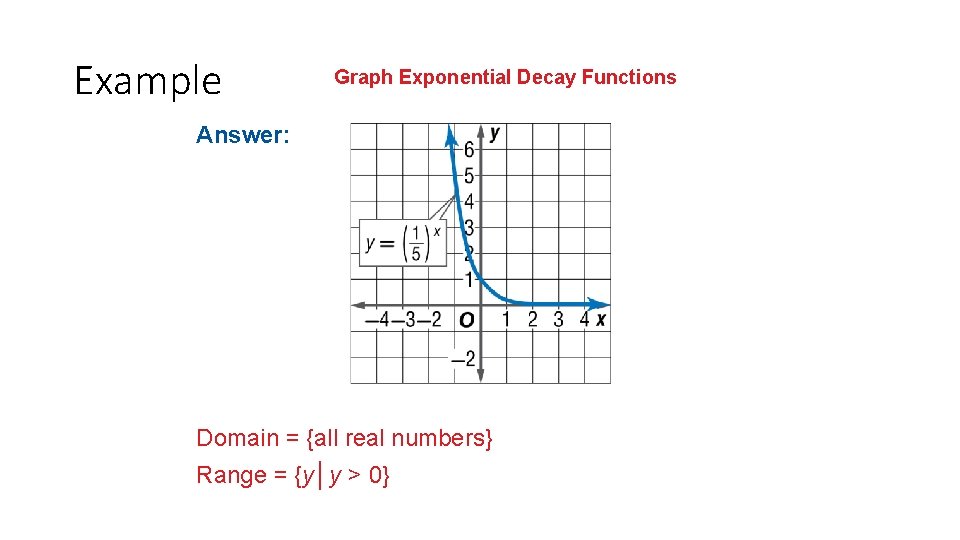
Example Graph Exponential Decay Functions Answer: Domain = {all real numbers} Range = {y│y > 0}
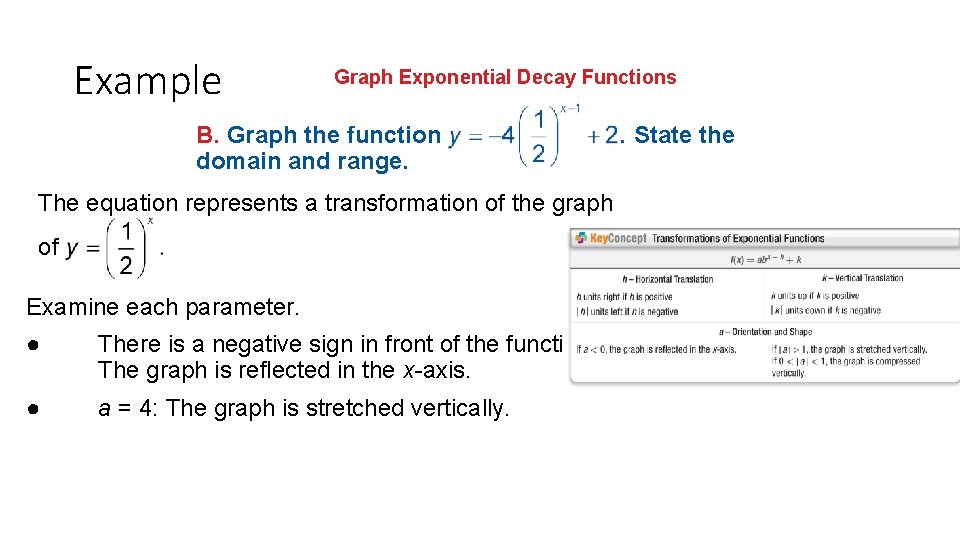
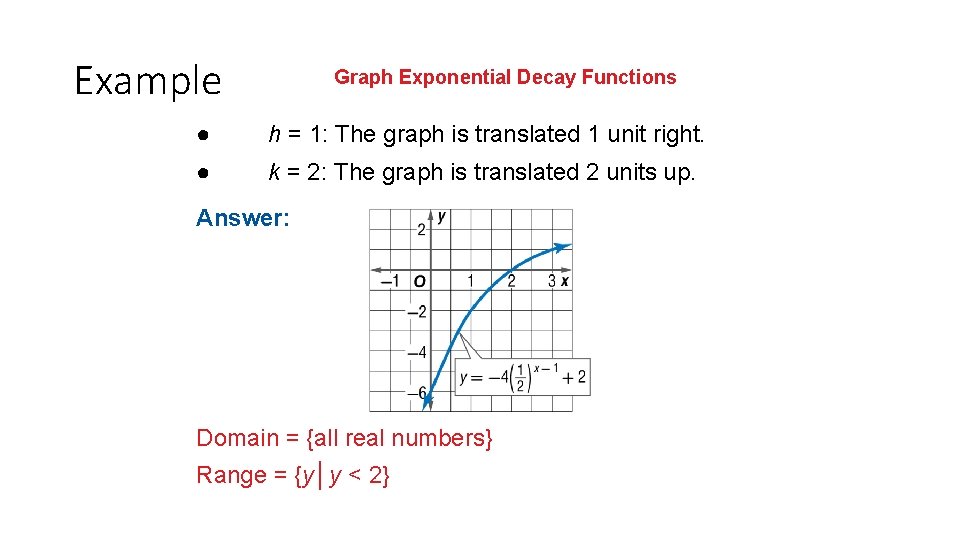
Example Graph Exponential Decay Functions B. Graph the function domain and range. The equation represents a transformation of the graph of Examine each parameter. ● There is a negative sign in front of the function: The graph is reflected in the x-axis. ● a = 4: The graph is stretched vertically. State the
Example Graph Exponential Decay Functions ● h = 1: The graph is translated 1 unit right. ● k = 2: The graph is translated 2 units up. Answer: Domain = {all real numbers} Range = {y│y < 2}
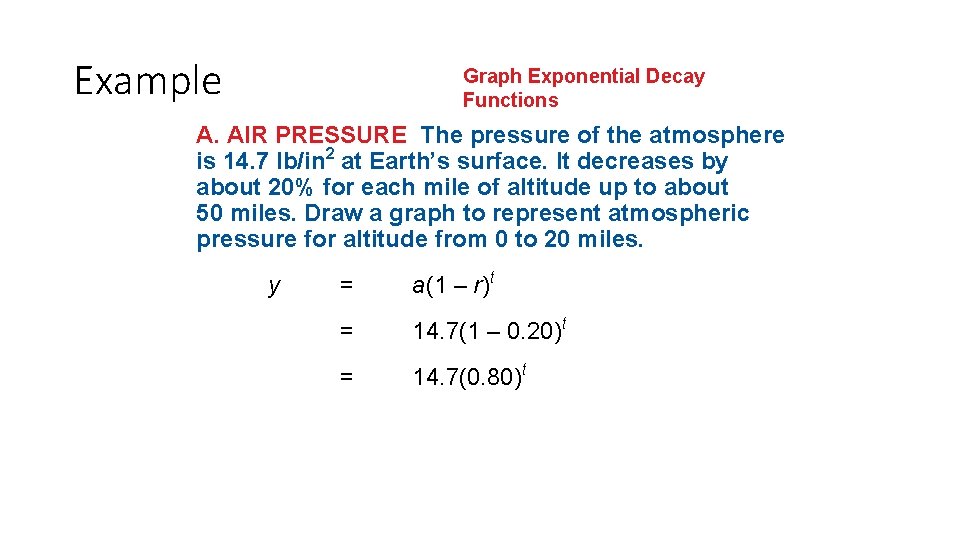
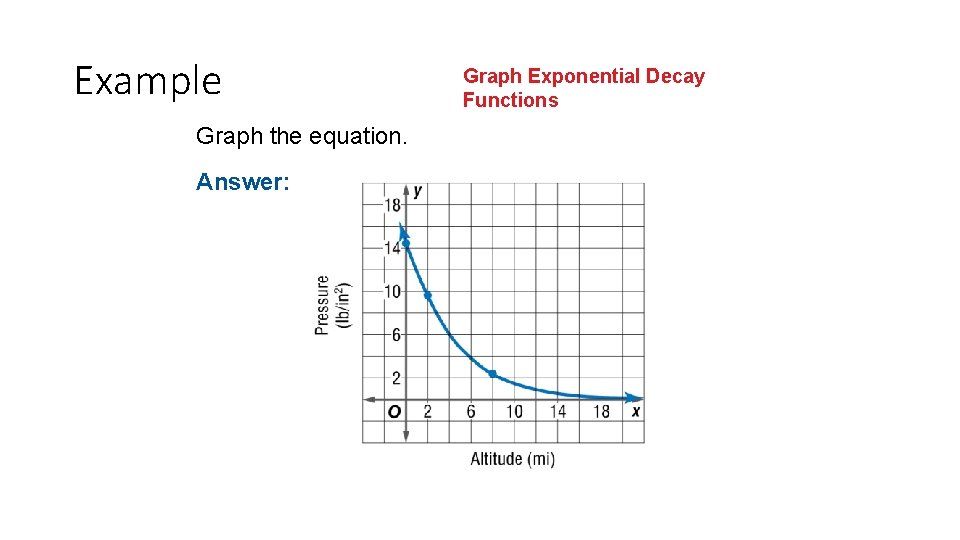
Example Graph Exponential Decay Functions A. AIR PRESSURE The pressure of the atmosphere is 14. 7 lb/in 2 at Earth’s surface. It decreases by about 20% for each mile of altitude up to about 50 miles. Draw a graph to represent atmospheric pressure for altitude from 0 to 20 miles. y = a(1 – r)t = 14. 7(1 – 0. 20)t = 14. 7(0. 80)t
Example Graph the equation. Answer: Graph Exponential Decay Functions
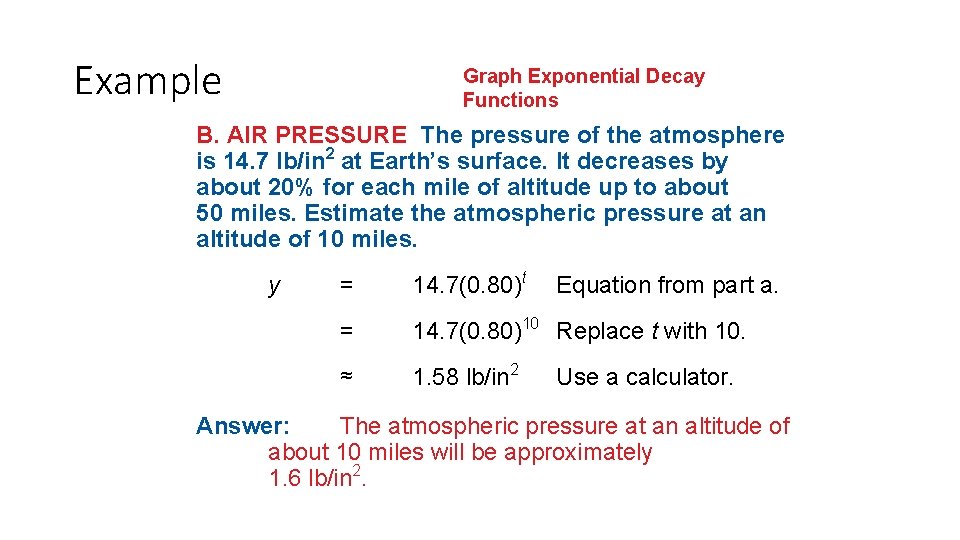
Example Graph Exponential Decay Functions B. AIR PRESSURE The pressure of the atmosphere is 14. 7 lb/in 2 at Earth’s surface. It decreases by about 20% for each mile of altitude up to about 50 miles. Estimate the atmospheric pressure at an altitude of 10 miles. y = 14. 7(0. 80)t = 14. 7(0. 80)10 Replace t with 10. ≈ 1. 58 lb/in 2 Equation from part a. Use a calculator. Answer: The atmospheric pressure at an altitude of about 10 miles will be approximately 1. 6 lb/in 2.
Assignment Pg. 455 #2 -4 all (Graph) #7 #12 #34